Immunohistochemical staining of myosin heavy chain isoforms has emerged as the state-of-the-art discriminator of skeletal muscle fiber-type (i.e., type I, type IIA, type IIX, type IIB). Here, we present a staining protocol along with a novel semi-automated algorithm that facilitates rapid assessment of fiber-type and fiber morphology.
A subscription to JoVE is required to view this content. Sign in or start your free trial.
Method Article
Semi-automated Analysis of Mouse Skeletal Muscle Morphology and Fiber-type Composition
In This Article
Summary
Abstract
For years, distinctions between skeletal muscle fiber types were best visualized by myosin-ATPase staining. More recently, immunohistochemical staining of myosin heavy chain (MyHC) isoforms has emerged as a finer discriminator of fiber-type. Type I, type IIA, type IIX and type IIB fibers can now be identified with precision based on their MyHC profile; however, manual analysis of these data can be slow and down-right tedious. In this regard, rapid, accurate assessment of fiber-type composition and morphology is a very desirable tool. Here, we present a protocol for state-of-the-art immunohistochemical staining of MyHCs in frozen sections obtained from mouse hindlimb muscle in concert with a novel semi-automated algorithm that accelerates analysis of fiber-type and fiber morphology. As expected, the soleus muscle displayed staining for type I and type IIA fibers, but not for type IIX or type IIB fibers. On the other hand, the tibialis anterior muscle was composed predominantly of type IIX and type IIB fibers, a small fraction of type IIA fibers and little or no type I fibers. Several image transformations were used to generate probability maps for the purpose of measuring different aspects of fiber morphology (i.e., cross-sectional area (CSA), maximal and minimal Feret diameter). The values obtained for these parameters were then compared with manually-obtained values. No significant differences were observed between either mode of analysis with regards to CSA, maximal or minimal Feret diameter (all p > 0.05), indicating the accuracy of our method. Thus, our immunostaining analysis protocol may be applied to the investigation of effects on muscle composition in many models of aging and myopathy.
Introduction
It has been known for some time that skeletal muscle is composed of single fibers of many types1. Initially, two groups of fibers were characterized based on their contractile properties and named, appropriately, slow-twitch (type I) and fast-twitch (type II). These categories were further distinguished on the basis of fiber metabolism. Since type I fibers are rich in mitochondria and reliant on oxidative metabolism, they were elucidated by robustly positive nicotinamide adenine dinucleotide-tetrazolium reductase (NADH-TR) diaphorase2 or succinate dehydrogenase (SDH)3 staining. By contrast, type II fibers exhibited lesser and variable degrees of NADH-TR diaphorase or SDH staining and were divided into two fast-twitch subgroups (type IIA and type IIB) somewhat crudely based on their relative oxidative capacities. These distinctions between fibers have been visualized more effectively by myosin-ATPase staining where type I fibers stain dark after a pre-incubation at pH 4.0 and type IIB fibers absorb precipitate following pre-incubation at pH 10.0 with type IIA fibers staining intermediately4.
More recently, immunohistochemical staining of myosin heavy chain (MyHC) isoforms has emerged as a finer discriminator of fiber-type5. Type I, type IIA and type IIB fibers can be all identified with precision based on their MyHC profile. In addition, another fast-twitch metabolically-intermediate fiber type, type IIX, has been identified6. Hybrid fibers expressing more than one MyHC have also been confirmed5,7,8. Some species such as the cat and the baboon are known not to express Type IIB MyHCs6. Though MyHC immunostaining is currently the state-of-the-art assessment of muscle composition, the analysis of the data obtained via this technique is cumbersome and time-consuming without automated assistance. To this end, a handful of semi-automated methods to analyze these data have been developed5,9,10. Here, we present a relatively standard protocol for immunohistochemical identification of muscle fiber-type5,7,8,10, along with a novel semi-automated algorithm that accelerates analysis of fiber-type and fiber morphology with accuracy.
Access restricted. Please log in or start a trial to view this content.
Protocol
All procedures involving mice were approved by the University of Colorado-Anschutz Medical Campus Institutional Animal Care and Use Committee (91813(05)1D).
1. Day 1: Primary (1°) Immunostaining with Bovine Serum Albumin (BSA) Blocking
- Air-dry frozen sections of mouse hindlimb muscle (e.g., tibialis anterior, soleus) mounted on charged slides for ~ 30 min11. Draw a border around the sections using a hydrophobic barrier PAP pen.
- Place ~ 250 µL of 5% BSA/phosphate buffered saline (BSA/PBS) on each slide to block non-specific antibody binding. Incubate slides at room temperature for 1 h.
- While blocking, prepare 1:50 dilutions of the 1° antibody supernatant in 5% BSA/PBS (all are mouse monoclonal antibodies; see Table 16,12); prepare 250 µL of solution per slide. Keep 1° antibody stocks and dilutions on ice.
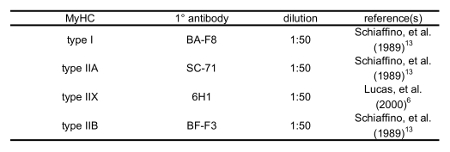
Table 1: Primary Antibodies used to Distinguish MyHCs.
- Following aspiration of the 5% BSA/PBS blocking solution, add 250 µL of 1° antibody dilution to the appropriate slides. Add 250 µL of 5% BSA/PBS to secondary (2°) antibody-only negative control slides.
- Incubate at 4 °C for 24 - 48 h in a humid environment.
NOTE: A Petri dish covered in aluminum foil with dampened filter paper may serve as a suitable incubation chamber.
2. Day 2: 2° Immunostaining with Fluorescent Antibodies
- Aspirate 1° antibody solution or control 5% BSA/PBS solution. Wash all slides three times, 10 min with 5% BSA.
- While washing, prepare 1:200 dilutions of the purified, fluorophore-conjugated 2° antibodies in 5% BSA/PBS (see Table 2, all are goat anti-mouse). Prepare 250 µL of solution per slide. Keep 2° fluorophore-conjugated antibodies in the dark on ice.

Table 2: Fluorophore-conjugated Secondary Antibodies used to Visualize Primary Antibody Recognition of MyHCs.
- Following aspiration of the third application of 5% BSA/PBS blocking solution, add 250 µL of 2° antibody dilution to all slides. Incubate for 90 min at room temperature in a dark, humid environment.
- Aspirate 2° antibody solution. Wash all slides three times, 10 min with 5% BSA/PBS.
- Rinse with PBS. Dry for 10 min.
- Mount the coverglass with a non-permanent, low-viscosity aqueous mounting medium.
- When dry, seal the slide edges with nail polish. Dry and store in a dark slidebox.
3. Imaging Slides with Epifluorescence Microscopy
- Clean the slides with a small, 70% ethanol-soaked lab-wipe.
- Obtain digital images of immunostained muscle sections using an epifluorescence microscope equipped with a photographic apparatus (see the Table of Materials).
- Select an area of approximately 1 mm2 (10X objective, 1.4 NA).
- View Alexa 488-conjugated 2° antibody fluorescence via a 505 nm long-pass filter. View the fluorescence generated by excitation of Alexa 594-conjugated 2° antibodies via a 595 nm long-pass filter. Digitize images with a PC computer equipped with a compatible imaging software. Include the scale bar from imaging software for later analysis.
4. Analysis of Images with Fiji
Note: Before proceeding with analysis, Fiji (available freely from the National Institutes of Health, Bethesda, MD) must be installed via https://imagej.net/Fiji/Downloads. Also, the macro used in this process is provided in the Supplemental File. Place the macro file in an easily accessible directory.
- Load a brightfield image of a selected section in Fiji. Navigate to Plugins → Segmentation → Trainable Weka Segmentation.
- In order to stipulate the cellular areas of the section, draw a line on a fiber, and click "Add to class 1". Then, draw a line on the space between fibers, and click "Add to class 2" to mark the extracellular domains. Repeat until there are 5-10 labels in each class.
- Click Train Classifier. On the resulting red and green overlay, add more labels manually (see step 4.2) to incorrectly segmented pieces of the image, if necessary. Repeat until fibers (red) are appropriately separated from the space between fibers (green).
- Click "Get Probability" and save the image in a newly labeled folder.
- Repeat the above procedure (steps 4.2 - 4.3) with the fluorescent image taken from the same field. Label immunostained fibers as "class 1" and all non-fluorescent regions as "class 2". Save the resulting probability map to the same folder where the processed brightfield image is stored.
- Open one of the previously saved probability maps in Fiji. Draw a straight line on the scale bar provided by the imaging software. Go to Analyze → Set Scale. Change the parameters (i.e., known distance, unit of length) to their appropriate values as given by the scale bar, then check the "Global" box to standardize the scale for each image.
- Navigate to Plugins → Macros → Run → Tyagi et al. fiber quantification macro.ijm (see the Supplemental File). Immediately, a navigation pane will appear. Open the image's host folder; a dialog box will appear. For each dialog box, change the "Background" dropdown value to "Light."
NOTE: The folder will now be populated with images of the fiber outlines and spreadsheet software files of the results (CSA and Feret diameter are most pertinent to quantifying fiber morphology; measured parameters can be adjusted in Analyze Set Measurements). Fiber morphology data generated by the pore-analysis function of Fiji will be automatically transferred to spreadsheet software files for both fluorescent and bright field images. - Calculate the fraction of fibers expressing a given MyHC in a field by dividing the number of fluorescent fibers in the field by the number of total fibers in the corresponding bright field image.
Access restricted. Please log in or start a trial to view this content.
Results
Hindlimb muscles (i.e., tibialis anterior, soleus) dissected from a male C57BL/6 mouse of unknown age were flash frozen by sinking a plastic mold containing the muscle in OCT compound in liquid nitrogen-cooled isopentane. Then, using a cryotome, 8-10 µm serial sections were cut at -20 °C and transferred to different positively-charged glass slides12.
We chose tibialis anterior and soleus because ...
Access restricted. Please log in or start a trial to view this content.
Discussion
Here, we have provided useful direction for the identification of skeletal muscle fiber types. In doing so, we describe a novel algorithm for analysis of the data.
Since our results largely confirm those of previous reports5,8,10 and reflect our own manual measurements, the algorithm appears to be accurate. Still, we encountered some infrequent experimental pitfalls including unclear fiber borders res...
Access restricted. Please log in or start a trial to view this content.
Disclosures
The authors have no conflicting interests to disclose.
Acknowledgements
We are grateful to the Boettcher Foundation and the Amyotrophic Lateral Sclerosis Association (#17-II-344) for their support of this research.
Access restricted. Please log in or start a trial to view this content.
Materials
| Name | Company | Catalog Number | Comments |
|---|---|---|---|
| Bovine Serum Albumin | Sigma Aldrich | A9418-100G | 5% in PBS |
| Hydrophobic Barrier Pap Pen | Scientific Device Laboratory | 9804-02 | |
| Microscope Slides | Globe Scientific | 1358W | |
| Coverglass | Fisher Scientific | 12-544-E | |
| Immumount | Thermo Scientific | 9990402 | |
| Nail Polish | L'Oreal | ||
| Nikon Eclipse TE-200 Inverted Fluorescence and Brightfield Microscope | Discontinued | ||
| SPOT RT/KE | SPOT Imaging Solutions | RT940 | |
| Dell Optiplex | |||
| BA-F8 Primary Antibody | Developmental Studies Hybridoma Bank at the University of Iowa | monoclonal mouse IgG2b; 1:50 | |
| SC-71 Primary Antibody | Developmental Studies Hybridoma Bank at the University of Iowa | monclonal mouse IgG1; 1:50 | |
| BF-F3 Primary Antibody | Developmental Studies Hybridoma Bank at the University of Iowa | monoclonal mouse IgGM; 1:50 | |
| 6H1 Primary Antibody | Developmental Studies Hybridoma Bank at the University of Iowa | monoclonal mouse IgGM; 1:50 | |
| Alexa Fluor 594 anti-IgG2b | Invitrogen | A21145 | goat anti-mouse; 1:200 |
| Alexa Fluor 488 anti-IgG1 | Invitrogen | A21121 | goat anti-mouse;1:200 |
| Alexa Fluor 594 anti-IgGM | Invitrogen | A21044 | goat anti-mouse;1:200 |
| OCT | Sakura Finetek | 4583 | |
| isopentane | Fisher Scientific | O3551-4 | cool with liguid nitrogen |
| PBS | Fisher Bioreagents | BP665-1 | 10x, dilute to 1x |
| Kim wipes | Kimberly-Clark | 06-666A |
References
- Engel, W. K. The essentiality of histo- and cytochemical studies of skeletal muscle in the investigation of neuromuscular disease. Neurol. 12, 778-784 (1962).
- Dobrowolny, G., et al. Skeletal muscle is a primary target of SOD1G93A-mediated toxicity. Cell Metab. 8, 425-436 (2008).
- Sultana, N., et al. Restricting calcium currents is required for correct fiber type specification in skeletal muscle. Development. 143 (9), 1547-1559 (2016).
- Guth, L., Samaha, F. J. Procedure for the histochemical demonstration of actomyosin ATPase. Exp Neurol. 28 (2), 365-367 (1970).
- Bloemberg, D., Quadrilatero, J. Rapid determination of myosin heavy chain expression in rat, mouse, and human skeletal muscle using multicolor immunofluorescence analysis. PLoS One. 7 (4), (2012).
- Lucas, C. A., Kang, L. H., Hoh, J. F. Monospecific antibodies against the three mammalian fast limb myosin heavy chains. Biochem Biophys Res Commun. 272 (1), 303-308 (2000).
- Lee, C. S., et al. Ca2+ permeation and/or binding to Cav1.1 fine-tunes skeletal muscle Ca2+ signaling to sustain muscle function. Skelet Muscle. 5 (4), (2015).
- Sawano, S., et al. A one-step immunostaining method to visualize rodent muscle fiber type within a single specimen. PLoS One. 11 (11), (2016).
- Meunier, B., Picard, B., Astruc, T., Labas, R. Development of image analysis tool for the classification of muscle fibre type using immunohistochemical staining. Histochem Cell Biol. 134 (3), 307-317 (2010).
- Kammoun, M., Casser-Malek, I., Meunier, B., Picard, B. A simplified immunohistochemical classification of skeletal muscle fibres in mouse. Eur J Histochem. 58 (2), 2254(2014).
- Kumar, A., Accorsi, A., Rhee, Y., Girgenrath, M. Do's and don'ts in the preparation of muscle cryosections for histological analysis. J Vis Exp. (99), (2015).
- Schiaffino, S., et al. Three myosin heavy chain isoforms in type 2 skeletal muscle fibres. J Muscle Res Cell Motil. 10 (197), (1989).
- Augusto, V., Padovani, C. R., Campos, G. E. R. Skeletal muscle fiber types in C57Bl6j mice. Braz J Morphol Sci. 21 (2), 89-94 (2004).
- Schiaffino, S., Reggiani, C. Fiber types in mammalian skeletal muscles. Physiol Rev. 91 (4), 1447-1531 (2011).
- Allen, D. L., Harrison, B. C., Maass, A., Bell, M. L., Byrnes, W. C., Leinwand, L. A. Cardiac and skeletal muscle adaptations to voluntary wheel running in the mouse. J Appl Physiol. 90 (5), 1900-1908 (2001).
Access restricted. Please log in or start a trial to view this content.
Reprints and Permissions
