This manuscript describes in vitro video microscopy protocols for evaluating vascular function in rat cerebral resistance arteries. The manuscript also describes techniques for evaluating microvessel density with fluorescently labeled lectin and tissue perfusion using Laser Doppler Flowmetry.
Method Article
Evaluation of Vascular Control Mechanisms Utilizing Video Microscopy of Isolated Resistance Arteries of Rats
In This Article
Summary
Abstract
This protocol describes the use of in vitro television microscopy to evaluate vascular function in isolated cerebral resistance arteries (and other vessels), and describes techniques for evaluating tissue perfusion using Laser Doppler Flowmetry (LDF) and microvessel density utilizing fluorescently labeled Griffonia simplicifolia (GS1) lectin. Current methods for studying isolated resistance arteries at transmural pressures encountered in vivo and in the absence of parenchymal cell influences provide a critical link between in vivo studies and information gained from molecular reductionist approaches that provide limited insight into integrative responses at the whole animal level. LDF and techniques to selectively identify arterioles and capillaries with fluorescently-labeled GS1 lectin provide practical solutions to enable investigators to extend the knowledge gained from studies of isolated resistance arteries. This paper describes the application of these techniques to gain fundamental knowledge of vascular physiology and pathology in the rat as a general experimental model, and in a variety of specialized genetically engineered "designer" rat strains that can provide important insight into the influence of specific genes on important vascular phenotypes. Utilizing these valuable experimental approaches in rat strains developed by selective breeding strategies and new technologies for producing gene knockout models in the rat, will expand the rigor of scientific premises developed in knockout mouse models and extend that knowledge to a more relevant animal model, with a well understood physiological background and suitability for physiological studies because of its larger size.
Introduction
The earliest studies of vascular function in arteries utilized conduit arteries, and in many cases the aorta. Force generation in large arteries was generally studied by attaching a ring segment of the artery to a force transducer in a tissue bath; in the case of the aorta, by cutting helical strips of the vessel so that the smooth muscle fibers were oriented in a longitudinal direction between the point of attachment and the force transducer, to provide the best estimate of the force generated by contraction of the smooth muscle along its longitudinal axis. The standard technique for cutting helical strips of aortas was to place a glass rod in the lumen of the vessel, make a cut in the vessel wall at the desired angle, and hold on to the end of the exposed edge of the vessel wall as the cut was extended to produce an entire helical strip of the vessel. At that point, the endothelial side of the vessel was generally blotted to remove debris before attaching the vessel strip to the force transducer and submerging the preparation in an oxygenated and temperature controlled tissue bath. Eventually, that approach led to one of the most famous and important discoveries in the history of physiology by Furchgott and Zawadski1, namely the role of endothelium derived relaxing factor (EDRF), subsequently identified as nitric oxide, in regulating vascular function. The crucial event leading to that discovery was a situation in which the investigators maintained an intact endothelium by avoiding contact of the endothelial side of the artery with foreign surfaces, and noticed that the aortic strip did not exhibit the expected contraction to acetylcholine (ACh), but instead relaxed in response to ACh. Based on that observation, the investigators developed a "sandwich" preparation in which they attached an aortic segment with an intact endothelium (but unable to generate contractile force) to a standard helical strip of aorta and converted the ACh-induced contraction into a relaxation.
Two major advances in this area that are extensively used today are the development of preparations to measure active contractile force in small resistance arteries2,3 (such as those in the intestinal mesentery3) and cannulated resistance artery preparations4,5,6. In one of the earliest reports, Mulvany and Halpern3 described the use of the wire myograph preparation to study active contractile force in isolated resistance arteries from the intestinal mesentery of spontaneously hypertensive rats (SHR) and normotensive WKY controls. Subsequent to the development of the wire myograph system, cannulated resistance artery preparations were developed to permit studies of vessels closer to in vivo conditions4,5,6. While both approaches provide valuable results, the cannulated artery preparation has the added advantages of more effectively preserving intrinsic active tone in the arteries; and allowing the investigators to study active myogenic responses to changes in transmural pressure and vessel responses to changes in flow rate and endothelial shear stress (see review by Halpern and Kelley6).
A major goal of the present paper is to describe how to employ the time-honored technique of video microscopy using isolated, cannulated resistance arteries in order to gain precise information regarding the mechanisms that regulate active tone in these crucial vessels, independent of neural, humoral, or parenchymal cell influences. This basic information, employing a standard rat model and examples from our studies of new genetically engineered rat strains, will provide the reader with an idea of the types of the insights regarding vascular function that can be gained with television microscopy approaches, and which can be employed in studies involving any control and experimental group(s) of the investigator's choosing, including powerful new experimental rat models produced by selective inbreeding and newly developed genetic engineering techniques.
Thanks to the precision of television microscopy approaches, measurement of diameter changes in cannulated artery preparations can provide highly valuable information regarding endothelium-dependent and endothelium-independent mechanisms of vascular relaxation, as well as important (and sometimes unexpected) alterations in vascular control mechanisms occurring with hypertension, high salt diet, and other experimental interventions. In addition, measurement of pressure-diameter relationships in isolated and cannulated resistance arteries that are maximally relaxed by treatment with Ca2+-free solution or a pharmacological vasodilator drug, allows the investigator to assess structural changes in arteries due to vascular remodeling and to calculate passive stress-strain relationships7 that can provide important insight into changes in the passive mechanical properties of the arteries that can affect arterial function independent of (or in addition to) changes in active control mechanisms. It is also important to note that information gained from studies of isolated resistance arteries can be supplemented by information obtained utilizing LDF, a practical method for evaluating tissue perfusion at the whole animal level8,9,10, and by information gained from assessing microvessel density using fluorescently labelled GS1 lectin, which specifically binds to glycoprotein moieties in the basement membrane of small arterioles and capillaries11,12. The latter method provides a highly accurate estimate of microvessel density that is not subject to the classic difficulties encountered in estimating microvessel density by counting vessels in vivo, for example missing non-perfused vessels where blood flow is stopped due to active closure of arterioles. When used together, these approaches can provide important insight to correlate functional alterations in isolated resistance arteries to changes in tissue perfusion at the microcirculatory level; and some examples of the use of those valuable approaches in conjunction with cannulated artery techniques will also be provided in the present manuscript.
The present paper focuses on the use of video microscopy techniques to evaluate vascular changes in arteries of outbred Sprague-Dawley rats. However, it is important to note that these techniques have proven to be highly valuable in elucidating phenotypic alterations in highly specialized genetically engineered rat strains created by selective breeding or gene editing using techniques. In this manuscript, we provide examples of how video microscopy techniques have provided important information regarding vascular function in a number of valuable rat models, including the Dahl salt-sensitive (SS) rat-an inbred rat strain that is the most widely used experimental model to study the mechanisms of salt sensitive hypertenson18,19,20,21,22,23; and consomic rats created via selective breeding of SS rats with the salt-insensitive Brown Norway (BN) rat strain. In the consomic rat panels, every chromosome from the Brown Norway rat has been introgressed individually into the Dahl SS24,25,26 genetic background. Use of consomic rat panels has provided valuable clues regarding specific chromosomes that contribute to salt sensitivity of blood pressure and other phenotypes, including vascular reactivity24,25,26,27,28.
Selective breeding strategies utilizing SS rats and consomic rats carrying individual BN chromosomes have also enabled the generation of narrowed congenic strains with small segments of individual Brown Norway chromosomes introgressed into the Dahl SS genetic background22,29. These can provide extremely valuable input on specific genes or narrow regions of chromosomes that can affect crucial physiological variables, such as blood pressure, renal damage, and vascular reactivity22,29. Another powerful addition to the rat genetic toolbox is the development of rat gene knockout models utilizing advanced gene editing techniques including ZFNs, transcriptional activator-like-effector nucleases (TALENS), and most recently CRISPR-Cas913,14,15,16,17. The advent of these powerful techniques that enable genes to be knocked out in the rat is an immensely important development because gene knockout studies to date have used (and continue to use) mice almost exclusively. Another experimental component in the present paper demonstrates the value of cannulated artery techniques and video microscopy to evaluate physiological control mechanisms in knockout rats lacking the master antioxidant and cell protective transcription factor, nuclear factor (erythroid-derived 2)-like-2 (NRF2)30,31, which were developed using TALEN technology in the Sprague-Dawley genetic background17. In those experiments, in vitro video microscopy techniques were used to provide functional verification of loss of the NRF2 gene and to test a potentially valuable therapeutic approach based on direct upregulation of NRF2-mediated antioxidant defenses. NRF-2 is of substantial therapeutic importance in combatting vascular oxidative stress in humans, in light of the disappointing results of clinical trials involving direct administration of antioxidants such as Vitamins C and E32.
Protocol
The Medical College of Wisconsin Institutional Animal Care and Use Committee (IACUC) approved all protocols described in this paper and all procedures are in compliance with the National Institutes of Health (NIH) Office of Laboratory Animal Welfare (OLAW) regulations.
1. Preparation of Solutions and Vessel Chamber
- Prior to conducting a series of experiments, prepare 2 L of 20x concentrated salt stock solution consisting of 278 g/L NaCl; 14 g/L KCl; 11.52 g/L MgSO4 .7H2O; and 9.4 g/L CaCl2 .2H2O. Also prepare 2 L of 20x concentrated buffer stock consisting of 80.8 g/L NaHCO3 and 0.4 g/L EDTA, and 2 L of 20x concentrated Ca2+-free stock solution consisting of 281.6 g/L NaCl; 14 g/L KCl, and 11.52 g/L MgSO4 .7H2O.
NOTE: 20X stock solutions can be stored in the refrigerator until use. - On the day of the experiment, prepare 2 L of physiological salt solution (PSS) from the 20x concentrated stock solutions as follows: add 100 mL of 20x salt stock to 1,800 mL of deionized water in a 2 L Erlenmeyer flask or beaker on a motorized stirring plate. Add 100 mL of 20x buffer stock while continuously equilibrating the solution with a gas mixture containing 21% O2, 5% CO2, balance N2, and stirring it with a magnetic stirring bar. Slowly add 0.28 g NaH2PO4 while monitoring the pH; adjust as necessary to pH 7.4 by adding drops of 6 N HCl or 6.5 N NaOH solution from a Pasteur pipette. After the PSS is prepared and the pH is adjusted, add 1.98 g of glucose to the PSS.
NOTE: It is important to slowly add the NaH2PO4 last while monitoring the pH of the PSS because the addition of NaH2PO4 to an alkaline solution (pH >7.4) could form a calcium phosphate precipitate, as indicated by the appearance of a cloudy solution or a white precipitate in the bottom of the container.
NOTE: The final composition of the PSS is 119 mM/L NaCl; 4.7 mM/L KCl; 1.17 mM/L Mg2SO4; 1.6 mM/L CaCl2; 1.18 mM/L NaH2PO4; 24 mM/L NaHCO3; 0.03 mM/L EDTA; and 5.5 mM/L glucose. Although the composition of the PSS can differ among laboratories, this recipe is highly suitable for maintaining vascular tone, endothelial function, and responses to vasoactive agents in isolated resistance arteries. - To determine the maximum diameter and to assess active tone in the artery by producing maximum dilation of the vessel, prepare 500 mL of Ca2+-free PSS by adding 25 mL of the 20X Ca2+-free salt stock to 450 mL of deionized water, followed by 25 mL of 20x buffer stock in an Erlenmeyer flask or beaker similar to step 1.2 above. Add 0.07 g of NaH2PO4 to the solution while monitoring and adjusting the pH of the solution. The Ca2+-free PSS is added to the PSS reservoir and vessel chamber at the end of the experiment to avoid depleting intracellular Ca2+ stores that could affect vessel responses in normal PSS. Because the Ca2+-free solution is added at the end of the experiment to produce maximum relaxation of the arteries, there is no need to add glucose to the PSS.
NOTE: When complete, the final composition of the Ca2+-free PSS is 120.6 mM/L NaCl; 4.7 mM/L KCl; 1.17 mM/L Mg2SO4; 1.18 mM/L NaH2PO4; 24 mM/L NaHCO3; 0 mM/L CaCl2; and 0.03 mM/L EDTA.
NOTE: For many studies requiring maximum dilation of the artery, a calcium entry blocker such as verapamil (1 µM) and/or a nitric oxide donor such as sodium nitroprusside (10 µM) can be added to the solution, in addition to removing Ca2+ from the PSS. - Maintain the PO2, PCO2, and pH of the PSS by continuously equilibrating the PSS flowing into the vessel chamber in a standard organ bath used to study isolated aortic rings, intestinal smooth muscle, or other tissues (Figure 1). Use synthetic fluoropolymer of tetrafluoroethylene tubing to connect the gas tank to the organ bath because this type of tubing is gas impermeable, in contrast to many other forms of tubing, e.g., latex.
- Place a small air stone connected to the equilibration gas mixture in the vessel chamber to help maintain the PSS gas composition.
NOTE: Vessel responses to changes in PO2 can be tested by equilibrating the PSS in the vessel chamber and luminal perfusate with gas mixtures containing various percentages of O2, e.g., 21% O2, 10% O2, 5% O2, and 0% O2, with 5% CO2 and balance N233,34,35. For larger arteries with thicker walls, where diffusion of oxygen into the center of the vessel wall may be a limitation, a higher percentage of oxygen, e.g., 95% O2 can be used. - Monitor the temperature in the vessel chamber closely, as individual chambers may vary in their heat transfer characteristics.
NOTE: Many commercially-prepared vessel chambers used for studies of cannulated resistance arteries utilize a peristaltic pump to deliver oxygenated PSS from a gas-equilibrated reservoir and provide very precise control of bath temperature and oxygenation of the PSS. - Place the PSS in a large (2 L) Mariotte bottle, with a stopper and central glass tube to serve as a reservoir to continuously deliver PSS into the organ bath that heats and gas-equilibrates the PSS flowing into the vessel chamber (Figure 1A).
- Place the opening of the central glass tube in the Mariotte bottle at the same level as the top of the PSS in the organ bath, to maintain a constant hydrostatic pressure head for delivery of PSS into the organ bath. Use polyethylene tubing connected to a J-shaped glass or plastic tube to deliver the PSS from the Mariotte bottle into the organ bath.
- For luminal perfusion (Figure 1A), use polyethylene tubing to connect the inflow pipette to a PSS reservoir composed of a 60 cc plastic syringe elevated to a position that maintains the desired inflow pressure (usually 80 mmHg for studies of rat cerebral arteries), as measured with a pressure transducer connected to the system via a stopcock.
- Connect the outflow pipette to a polyethylene tube to allow the PSS to flow through the vessel in response to a pressure gradient, and connect the outflow line to a reservoir similar to the inflow reservoir. Use a similar stopcock and pressure transducer connection to measure outflow pressure.
NOTE: Procedures for setting transmural pressure and controlling flow through the vessel are described in section 2, below. - At the end of the experiment, thoroughly rinse the chamber, delivery lines, and reservoir systems with distilled water. At frequent intervals, replace the tubing and delivery lines, clean or replace the stopcocks in the system, and periodically subject any glass PSS reservoirs to an acid wash to prevent the growth of bacteria and other microorganisms that cause contamination and affect vessel reactivity.
2. Cannulated Artery Preparation
- Anesthetize a Sprague-Dawley rat with 5% isoflurane and maintain the anesthesia using 1.5-2.5% medical grade oxygen36. Alternatively, administer an intramuscular injection containing ketamine (75.0 mg/kg), acepromazine (2.5 mg/kg), and xylazine (10.0 mg/kg); an intraperitoneal injection of pentobarbital (50-60 mg/kg); or any other approved method of anesthesia, depending upon protocols and/or investigator preferences.
- Decapitate the rat under deep anesthesia and remove the brain for studies of cerebral resistance arteries.
- After removal of the brain, carefully isolate the middle cerebral artery (MCA) (or other arteries of interest, e.g., basilar artery or posterior cerebral artery)37,38. To isolate the MCAs, place the brain supine in a glass Petri dish filled with ice-cold PSS (Figure 2).
- Use Vannas scissors and a Dumont #5 fine tip forceps to excise the MCA from the brain. Clean any residual brain tissue from the MCA using the forceps and transfer the artery to a temperature controlled vessel chamber containing PSS as previously described.33,34 .
- To transfer the artery to the vessel chamber, gently hold the excised vessel by the ACA or the posterior communicating artery segment and carefully place it into the chamber.
NOTE: In addition to the MCA, the cannulated vessel system is suitable for a wide variety of small vessel preparations, including skeletal muscle resistance arteries33,39,40, mesenteric resistance arteries38,41,42, and large (first order) arterioles of the cremaster muscle43, as well as human coronary arterioles and human arterioles obtained from subcutaneous adipose tissue during gluteal biopsy44,45,46,47. - Attach the artery to the inflow micropipette by pulling it toward the pipette base until the tip advances into the lumen of the MCA. Secure the artery on the inflow pipette by tying a loop prepared from a single strand fiber previously teased from 10-0 sutures around the artery (Figure 1B). Secure the opposite end of the MCA to the outflow pipette by tightening a second suture loop around the vessel (Figure 1B).
NOTE: Place the suture loops on the micropipettes prior to mounting the vessel and position them close to the final point of attachment, allowing them to be easily slipped over the artery and quickly secured when the vessel is in position, which minimizes the risk of the artery sliding off the pipettes.
NOTE: Micropipettes are prepared from borosilicate glass capillary tubing (2 mm outer diameter; 1 mm inner diameter; 10 cm long) using a vertical micropipette puller.Prior to attaching the artery, match the tip diameters of the micropipettes as closely as possible to prevent mismatches of inflow and outflow resistance in the perfusion system. - After the artery is securely tied to the micropipettes, use the micrometer connected to the inflow pipette holder to stretch the artery to its in situ length.
- Tie off all side branches with single strands teased from 10-0 sutures in order to maintain a constant pressure in the artery.
- Verify the absence of leaks by making sure that the intraluminal (transmural) pressure remains constant after temporarily closing the inflow pipette. Tie off any branches or check for holes in the vessel if the pressure falls. Restore perfusion after verifying that the transmural pressure remains constant.
NOTE: Cannulation of isolated resistance arteries requires manual dexterity and practice. The main precautions to be observed are to avoid breaking the pipettes and to make sure that the artery does not slide off the pipettes. It is important to be gentle with the isolated arteries throughout the entire procedure, as trauma to the vessel can damage the endothelium and/or interfere with normal function of the vascular smooth muscle. - Measure the internal diameter of the artery using a video microscopy setup (Figure 1A) consisting of a video camera attached to a dissecting microscope and connected to a video micrometer and television monitor (Figures 1B, 1C). This allows the observer to measure vessel diameters manually by placing movable reference lines on the inner wall of the artery and, if desired, on the outer wall of the artery as well, in order to measure vessel wall thickness.
NOTE: Some video micrometers offer automatic tracking of vessel dimensions.
NOTE: Calibrate the video micrometer with a microscope stage micrometer and the inflow and outflow pressure transducers with a mercury manometer (0 mmHg, 50 mmHg, 100 mmHg, 150 mmHg, and 200 mmHg) between experiments in order to insure accurate measurements of vessel diameter and intraluminal pressure.
NOTE: The standard control transmural pressure for rat MCA experiments is 80 mmHg. Calibration for higher and lower pressure levels assures accuracy for studies of myogenic responses to changes in transmural pressure and passive pressure-diameter curves in maximally dilated arteries. - Adjust the height of the inflow and outflow reservoirs to maintain the desired transmural pressure at a constant level. Raising the inflow reservoir by a small amount (< 5 mmHg) and lowering the outflow reservoir by the same amount maintains the mean transmural pressure and creates perfusion flow in the vessel lumen6.
NOTE: Raising the inflow reservoir and lowering the outflow reservoir by equal amounts maintains the same mean transmural distending pressure in the artery, but generates a hydrostatic pressure gradient that causes flow and shear stress in the vessel, allowing the investigator to evaluate endothelium-dependent responses to changes in intraluminal shear stress in different experimental groups48. - To assess myogenic responses and vessel responses to vasodilator stimuli, make sure that the artery exhibits a suitable level of active tone (approximately 40%) prior to the experiment. Discard any arteries lacking active tone at rest with the exception of vessels, e.g., small mesenteric arteries that do not normally exhibit active resting tone.
NOTE: For vessels that do not normally exhibit spontaneous tone, pre-constrict the arteries by an equivalent amount utilizing a vasoconstrictor agonist such as norepinephrine or phenylephrine. A good approach to choosing the dose of the agonist used to pre-constrict the artery is to utilize an EC50 dose of the vasoconstrictor agent, e.g., norepinephrine41,42. However, pharmacological vasoconstrictor agents should not be applied to arteries that exhibit spontaneous active tone under resting conditions. - Test endothelium-dependent reactivity of the cannulated resistance artery by measuring vessel diameters during the addition of increasing concentrations of ACh (10-10 M–10-5 M) to the vessel chamber. Test endothelium-independent nitric oxide sensitivity of the vascular smooth muscle by measuring vessel diameters during the addition of increasing concentrations (10-10 M–10-5 M) of the nitric oxide donor sodium nitroprusside to the vessel chamber.
NOTE: Sensitivity to vasoconstrictor agents and other vasodilator agonists can be tested in a similar fashion by adding increasing concentrations of the agonist to the vessel chamber.
NOTE: In addition to vasoactive agents, various drugs, inhibitors, and other pharmacological agents can be added to the tissue bath and/or to the luminal perfusate. Changes in PO2 (as well as PCO2 and pH) can be selectively administered to the endothelial side or the extra-luminal side of the artery by separate equilibration of the luminal perfusate with an air stone connected to a calibrated gas mixture different from the mixture used to equilibrate the PSS in the tissue bath33,34,49. Myogenic responses to changes in transmural pressure can be studied by closing the outflow pipette and raising (or lowering) the height of the PSS reservoir connected to the inflow pipette49,50,51 to increase or reduce intraluminal pressure. - To test the role of the endothelium in mediating vessel responses to specific stimuli, remove the vascular endothelium and compare vessel responses to those stimuli in the presence or absence of the endothelium. To remove the endothelium, carefully untie the artery from the outflow pipette and slowly perfuse the lumen of the artery with an air bolus (0.5-1.0 mL). After air perfusion, restore PSS perfusion to clear the cellular debris before re-tying the vessel to the outflow pipette43.
NOTE: Following the endothelial denudation procedure, it is important to verify that the endothelium is removed by testing vascular responses to an agonist (usually ACh) known to produce endothelium dependent vasodilation in that vessel type. However, in certain pathologic conditions, endothelium-dependent vasoconstrictors are released, in which case, it is important to verify that the constrictor response is eliminated following endothelial removal. - At the end of the experiment, determine the maximum diameter of the artery by adding Ca2+-free PSS to the perfusate and superfusate. Calculate active resting tone (%) as((Dmax-Drest)/Dmax) x 100, where Dmax is the maximum diameter in the presence of Ca2+-free solution and Drest is the resting control diameter.
NOTE: Diameter measurements of maximally relaxed arteries in different experimental groups are valuable in comparing active resting tone, structural remodeling (i.e., changes in wall thickness and lumen diameter), and passive mechanical properties (stress-strain relationships calculated from passive diameters at different levels of transmural pressure).
3. Evaluation of Cerebral Blood Flow Responses with LDF
- Anesthetize the animal with 5% isoflurane and secure the rat in a stereotaxic apparatus9,10.
- Maintain the animal under constant anesthesia while monitoring breathing frequency, end tidal CO2, and depth of anesthesia with a toe pinch36.
- Carefully thin the skull to translucency using a low speed dental drill and mineral oil to provide optical coupling10. Exercise caution to avoid generating excessive heat and to avoid penetrating the bone.
NOTE: Thinning of the skull allows the laser light to reach the underlying tissue and to be reflected back to the probe in order to measure the Doppler shift, the magnitude of which is determined by the number of moving particles (i.e., red blood cells) and their velocity. - Secure the LDF probe in a micromanipulator and position it directly over the thinned area of the skull. During the experiment, it is very important to prevent movement of either the LDF probe or the preparation itself, as the LDF is designed to measure flow in one restricted area of the tissue and is extremely sensitive to motion artifacts.
NOTE: Any movement of the probe away from its initial position will provide an estimate of blood flow in a different area of the tissue, precluding comparisons. While LDF does not provide absolute flow values and is not suitable for comparison between subjects, it is an excellent way to noninvasively evaluate changes in tissue perfusion in response to experimental interventions in individual subjects; and relative changes in LDF signal from control values can be averaged and compared to changes in LDF signal from control in other experimental groups.
NOTE: LDF is a convenient approach to gain insight into factors regulating blood flow at the level of the whole vascular bed in different experimental groups8,9,10. Evaluation of tissue perfusion with LDF provides a practical approach to assimilate knowledge gained from isolated vessel studies into a whole bed perspective. Barring regional differences in vascular control mechanisms between resistance arteries and the microcirculation, measurements obtained with LDF provide a good indication of tissue blood flow control that is generally consistent with results obtained with cannulated artery preparations.
4. Evaluation of Skeletal Muscle Microvessel Density with GS1 Lectin
- Remove the cremaster muscle from a male rat by cutting open the scrotum with standard fine surgical scissors and then using a Dumont #5 forceps to grasp the muscle.
NOTE: Thin muscles (e.g., the cremaster muscle, as well as the extensor digitorum longus and tibialis anterior muscles that are found in both male and female rats) are ideally suited for use as whole mounts for lectin studies, although histological sections can be used for thicker tissues. - Remove the cremaster muscle from the testicle using a single cut. Place it in ice-cold PSS and pin it out in a Petri Dish with a silicone elastomer lining on the bottom inside surface. Gently tease away connective tissue using Dumont #5 forceps.
- Rinse the muscle samples with 2 mL of buffered PSS and then immerse them in rhodamine-labeled GS1 lectin (20 µg/mL PSS) for 50 min in a 12-well cell culture plate with 2 mL/well that is wrapped in aluminum foil to exclude light.
- Remove the tissues from the lectin solution, rinse them three times in PSS with 5 min "wash" incubations on a rocker, and mount them on microscope slides. Make sure to incubate the tissues in the dark and store the slides in the dark to prevent loss of fluorescence.
NOTE: If the slides cannot be used immediately, they can be kept in the refrigerator with no loss of fluorescence. For prolonged storage, the slides can be kept in a freezer to prevent deterioration11. - Evaluate microvessel density by counting the number of intersections of the labeled microvessels with computer-generated grid lines superimposed over the image52, or with a clear grid overlay superimposed over the monitor being used to view the slides.
NOTE: GS1 lectin approaches have been used to demonstrate: salt-induced microvascular rarefaction53, the protective effect of preventing salt induced angiotensin II suppression in restoring microvessel density in salt-fed animals17,53,54; the role of NRF2 mediating the protective effect of low dose angiotensin II infusion to prevent microvessel rarefaction in salt-fed rats17; and also to evaluate the role of angiotensin II in maintaining angiogenic responses to chronic muscle stimulation in salt fed rats54,55. One advantage of the GS1 lectin technique is that it can be used to assess microvessel density in the same animals used for studies of cannulated resistance arteries or LDF.
Results
In vitro microscopy of cannulated resistance arteries allows for the study of factors influencing active tone in small resistance arteries (and larger arterioles) at normal in vivo transmural pressures and in the absence of parenchymal cell influences. In addition to assessing the reactivity of the vessels to various vasodilator and vasoconstrictor stimuli and myogenic responses to transmural pressure elevation in normal PSS, the Ca2+-free PSS can be added to the perfusate and superfusate at the end of the experiment to determine the maximum vessel diameter and wall thickness. The latter measurements are highly valuable in assessing vascular remodeling, i.e., changes in the wall/lumen ratio that may occur in response to changes in blood pressure or administration of pharmacological agents. Measurements of the diameter of maximally dilated vessels in Ca2+-free PSS are useful to calculate intrinsic tone as ((Dmax-Drest)/Dmax) x 100, where Dmax and Drest are the maximum (Ca2+-free PSS) and resting diameter (PSS), respectively, at the control equilibration pressure (usually 80 mmHg for MCA). In our experience, active tone in the MCA averages around 40% at a transmural pressure of 80 mmHg. Measuring the diameter of maximally dilated arteries is also a practical way to evaluate the passive mechanical properties of the vessels by measuring the diameter of the arteries at different levels of transmural distending pressure and using the results to calculate stress-strain relationships and other mechanical properties of the vessels7,56.
Figure 3 is a schematic representation of three narrowed congenic strains derived from the SS.13BN rat utilizing additional selective breeding approaches. In these rat strains, the chromosomal segments either include the Brown Norway renin allele (Ren1-BN) or are cut off just above (Ren1-SSA) or just below (Ren1-SSB) the renin gene locus (thus retaining the SS renin allele). In that study29, the chromosomal segment containing the Brown Norway renin allele contained only 25 genes.
Figure 4 illustrates the response to the endothelium-dependent vasodilator ACh (1 µM) in isolated MCAs from male Dahl SS rats and the three narrowed congenic strains shown in Figure 3. Combined use of these three congenic strains that either include (Ren1-BN) or are cut off just above (Ren1-SSA) or below (Ren1-SSB) the renin gene limited the region of interest (i.e., the area surrounding the renin gene locus) to approximately 25 genes. In those experiments, the animals were normotensive and fed a low salt (0.4% NaCl) diet. In that study29 endothelium-dependent dilation to ACh was absent in the SS parental strain and in both the congenic strains retaining the SS renin allele, but was restored in the congenic strain carrying the BN renin allele in the SS genetic background. The results of that study supported the findings of earlier studies utilizing SS.13BN consomic rats57,58 and provided strong evidence that endothelial dysfunction is present in SS rats, even when they are normotensive and fed a low salt diet. Taken together, the results of those studies29,57,58 support the hypothesis that endothelial dysfunction in SS rats is due to impaired regulation of the renin gene, resulting in chronic exposure to low levels of angiotensin II in the blood.
Another study59, summarized in Figure 5, compared the response to the endothelium-dependent vasodilator ACh in isolated MCAs (MCA) from male Dahl SS rats and SS.5BN consomic rats carrying chromosome 5 (containing Brown Norway genes for various isoforms of cytochrome P450-4A ω-hydroxylase). In that study, animals were fed either a low salt (0.4% NaCl) or high salt (4% NaCl) diet. In contrast to the MCA from SS rats, endothelium dependent dilation to ACh was maintained in MCA from the SS.5BN consomic rats fed low salt diet. In addition, (and in contrast to results from SS.13BN consomic rats57,58, Sprague-Dawley rats33,39,40,60, and golden hamsters61), a high salt diet failed to eliminate ACh-induced dilation in the SS.5BN rats, indicating that CYP450-4A ω-hydroxylase and 20-hydroxyeicosatetraenoic acid (20-HETE) are important contributors to vascular oxidant stress and endothelial dysfunction in SS rats and during elevations in dietary salt intake in other strains. From an experimental perspective, the failure of the high salt diet to eliminate endothelium-dependent dilation to ACh provides an example of how studies of cannulated resistance arteries can produce unexpected findings that depart from conventional wisdom and could lead to a new understanding of complex control mechanisms affecting the function of these crucial vessels.
Figure 6 shows the response of isolated MCA to ACh (1 µM) in wild type and Nrf2(-/-) knockout rats fed a low salt diet (0.4% NaCl), high salt diet (4% NaCl), or a high salt diet containing a known NRF2 activator30,62. In the absence of salt-induced oxidative stress, ACh-induced dilation was similar in MCA from wild type and Nrf2(-/-) knockout rats. Consistent with the results of earlier studies of Sprague-Dawley rats, the high salt diet eliminated ACh-induced dilation in wild type and in Nrf2(-/-) knockout rats. Addition of the NRF2 inducer to the high salt diet restored endothelium-dependent dilation to ACh in the wild type rats, but not in the Nrf2(-/-) rats, demonstrating successful elimination of the Nrf2 gene in the knockout rats, and supporting the use of NRF2 up-regulators as a therapeutic approach to ameliorate vascular oxidative stress.
Figure 7 summarizes the results of LDF measurements comparing the responses of the pial microcirculation to progressive reductions in arterial blood pressure produced by successive blood volume withdrawals in Sprague-Dawley rats maintained on either a normal salt (0.4% NaCl) diet or a high salt (4% NaCl) diet for four weeks. In contrast to rats fed a low salt diet, rats fed the high salt diet exhibit an impaired ability to maintain a constant blood flow during reductions in perfusion pressure, indicating that the mechanisms responsible for cerebral blood flow autoregulation are compromised by long term exposure to a high salt diet. The results of those experiments are consistent with the presence of impaired vascular relaxation mechanisms in isolated cerebral arteries of salt-fed rats60 and provide a good example of how LDF measurements can be employed to support and extend the findings of studies employing isolated resistance arteries to the level of the whole vascular bed.
In addition to evaluating resistance artery function using isolated arteries and tissue perfusion using laser-Doppler flowmetry, the microvessel density and angiogenic responses to various stimuli such as chronic muscle stimulation54,55 can be evaluated in the same animals utilizing fluorescently-labeled GS1 lectin, which selectively binds to glycoprotein moieties in the basement membrane of arterioles and capillaries. Figure 8 shows typical lectin staining in the cremaster muscle of Sprague-Dawley rats fed a low salt diet or high salt diet for 2 weeks (note the lower density of microvessels in the high salt fed rats). Microvessel density is assessed by counting the intersections of lectin-labeled microvessels with a computer-generated reference grid52, and provides an excellent method to evaluate angiogenic responses54,55 or to detect and quantify the loss of microvessels in conditions such as hypertension and elevated dietary salt intake12,17,53.
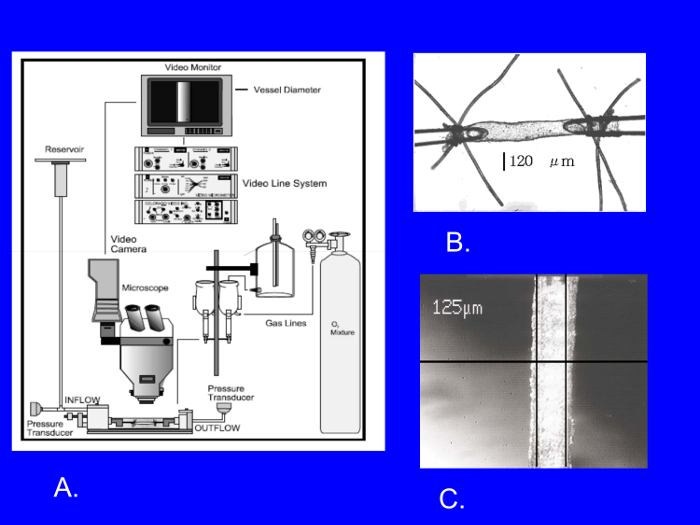
Figure 1: In vitro video microscopy setup employed to study isolated, cannulated resistance arteries (A). Cannulated resistance artery tied to glass micropipettes (B) and video micrometer display showing measurement of lumen diameter in cannulated resistance artery (C). Scale bar in Panel B represents the internal diameter of the cannulated artery (µm), and 125 µm in Panel C is the video display of the distance between the moveable reference lines placed manually on the inner walls of the artery by the observer conducting the experiment. Please click here to view a larger version of this figure.
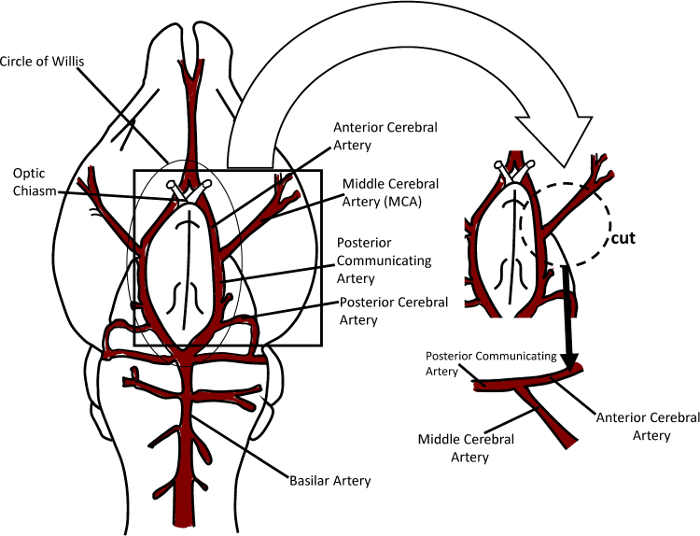
Figure 2: Schematic diagram of the procedure for isolating the middle cerebral artery from the brain and preparing it for cannulation with the micropipettes. Please click here to view a larger version of this figure.
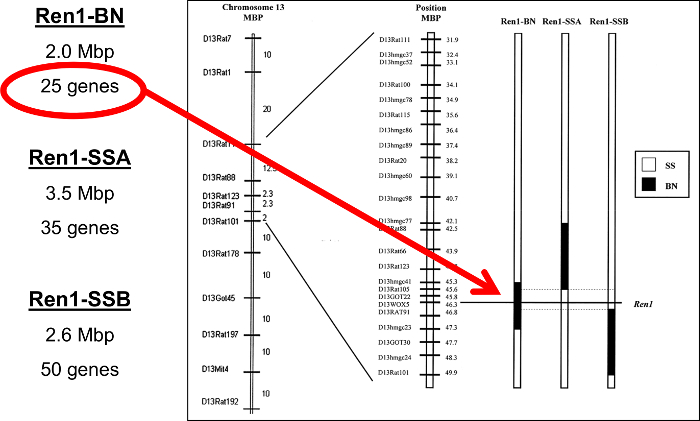
Figure 3: Schematic diagram of narrowed congenic rat strains having small segments of Brown Norway chromosome 13 introgressed into the Dahl salt sensitive genetic background. Chromosomal segments either contained the Brown Norway renin allele (Ren1-BN) or are cut off just above (Ren1-SSA) or just below (Ren1-SSB) the renin gene locus and thus retain the SS renin allele. This figure has been modified and reprinted from Durand et al.29 with permission of the American Physiological Society. Please click here to view a larger version of this figure.
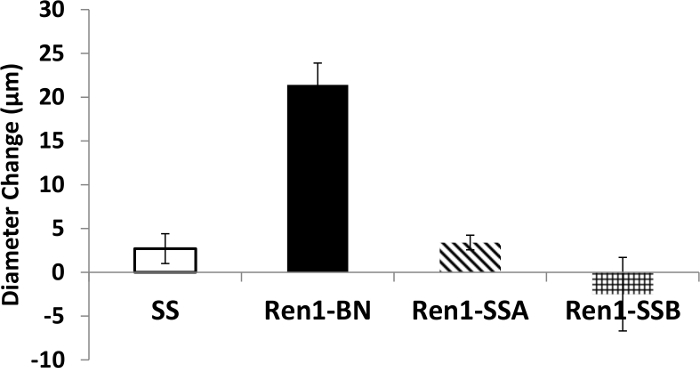
Figure 4: Response of isolated, cannulated MCAs of SS rats and congenic rat strains (illustrated in Figure 2) to 1 µM acetylcholine. Data are expressed as mean diameter change (Δ µm) ±SEM from resting control diameter prior to acetylcholine, and are replotted from an original study by Durand et al.29 Please click here to view a larger version of this figure.
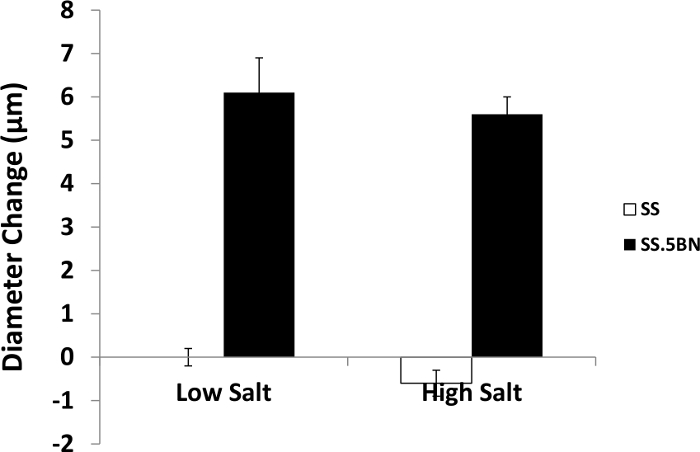
Figure 5: Response of isolated, cannulated MCAs of SS rats and SS.5BN consomic rats to 1 µM acetylcholine in animals fed low salt (0.4% NaCl) or high salt (4% NaCl) diet. Data are expressed as mean diameter change (Δ µm) ±SEM from resting control diameter prior to acetylcholine, and are replotted from an original study by Lukaszewicz et al.64 Please click here to view a larger version of this figure.
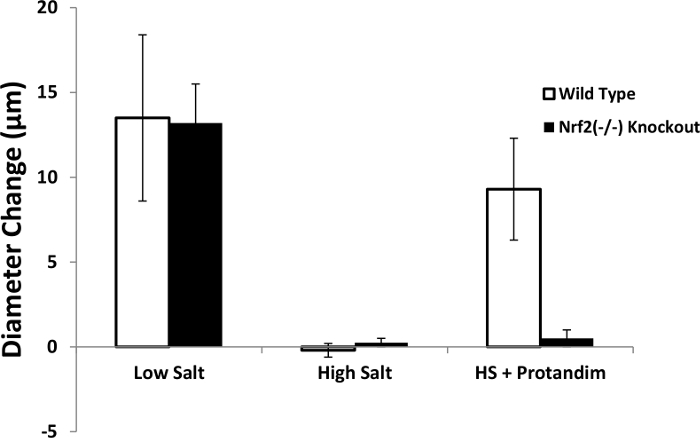
Figure 6: Response to 1 µM acetylcholine in isolated, cannulated MCAs of Nrf2(-/-) knockout rats and wild type controls fed low salt diet (0.4% NaCl), high salt diet (4% NaCl), or high salt diet containing a known NRF2 activator30,62. Data are expressed as mean diameter change (Δ µm) ±SEM from resting control diameter prior to acetylcholine. Please click here to view a larger version of this figure.
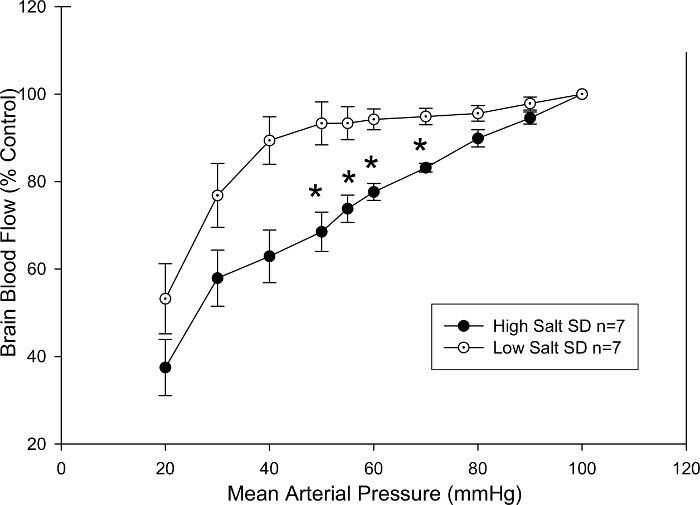
Figure 7: Cerebral blood flow assessed by LDF in the pial microcirculation. Sprague-Dawley rats maintained on a high salt diet for four weeks exhibited a significant impairment in their ability to maintain blood flow constant as arterial blood pressure was reduced in response to successive blood volume withdrawals. Data are plotted as mean percent of control ±SEM *p <0.05 vs. low salt diet at same mean arterial pressure. Please click here to view a larger version of this figure.
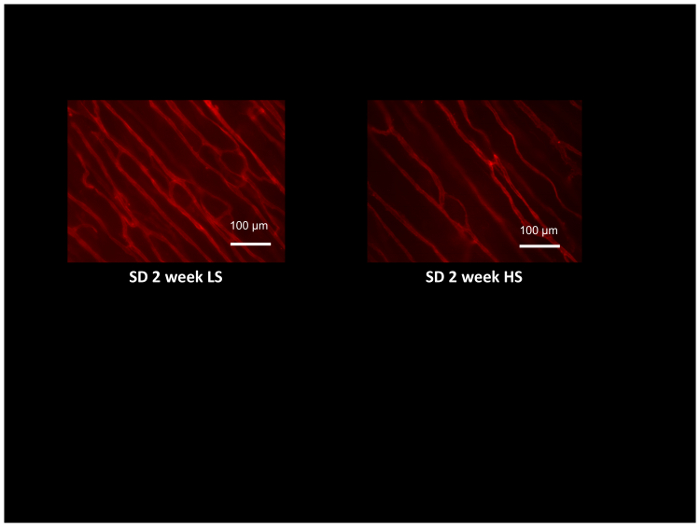
Figure 8: Micrograph of rat cremaster muscles labeled with rhodamine-labeled GS1 lectin to identify arterioles and capillaries for assessment of microvessel density. Cremaster muscles were obtained from Sprague-Dawley rats fed low salt (LS; 0.4% NaCl) or high salt (HS:4% NaCl) diet for 2 weeks, and demonstrate microvascular rarefaction in the HS-fed animals compared to LS controls. Scale bar = 100 µm. Please click here to view a larger version of this figure.
Discussion
As noted in the introduction, this paper describes the use of television microscopy and isolated resistance artery approaches to evaluate vascular function not only in standard rat models (as employed in the video), but also in highly specialized genetically engineered rat strains, which show the novel and powerful insights that can be gained utilizing these approaches. The use of these powerful techniques to evaluate active tone and passive mechanical properties of small resistance arteries can provide important information regarding a wide spectrum of vascular control mechanisms including endothelium-dependent regulation of active tone in resistance arteries, vascular smooth muscle function under normal and pathophysiological conditions, and passive properties of the arteries related to vascular remodeling and changes in vascular wall mechanics. Endothelial dysfunction has been shown to be a powerful prognostic indicator of multiple adverse cardiovascular events in humans including cardiovascular-related death63, and cannulated resistance artery preparations are especially valuable in detecting endothelial dysfunction and increasing our understanding of the mechanisms of endothelial dysfunction.
To illustrate the effectiveness of in vitro video microscopy techniques employing isolated resistance arteries, we provided examples of the use of these techniques in Dahl salt sensitive (SS) rats and in novel consomic rat strains that exhibit a reduced salt sensitivity of blood pressure compared to the SS parental strain24. Those studies investigated vascular control mechanisms related to genes on two chromosomes that are of particular interest in contributing to salt sensitivity of blood pressure and vascular alterations in the SS rat. Those chromosomes are chromosome 13, carrying the renin gene18,22,29,57,58, and chromosome 5, carrying genes for isoforms of CYP450-4A ω-hydroxylase64,65—the enzyme that synthesizes 20-HETE, which has major effects on renal function and on vascular reactivity66,67,68. Another recent and powerful addition to the rat genetic toolbox is the development of rat gene knockout models utilizing advanced gene editing techniques including: ZFNs; transcriptional activator-like-effector nucleases (TALENS), and most recently CRISPR-Cas913,14,15,16,17. In vitro video microscopy utilizing these techniques to study isolated MCAs from a Nrf2(-/-) knockout rat model that lacks the crucial antioxidant and cell protective transcription factor NRF2, has provided important and previously unknown insight into the mechanisms of salt-induced endothelial dysfunction in the absence of an elevated blood pressure17. Specific results of experiments utilizing these specialized rat models are described in a number of previous reports17,29,57,58,59,60,64,65.
While it is clear that studies of isolated, cannulated resistance arteries are extremely valuable in understanding the mechanisms regulating the function of these critically important vessels under a variety of conditions, it is very important to exercise a number of precautions in order to ensure that accurate and reliable results are obtained. While cerebral arteries and resistance arteries of many other vascular beds exhibit intrinsic tone, some arteries (notably mesenteric resistance arteries) need to be pre-contracted with vasoconstrictors such as norepinephrine in order to evaluate responses to vasodilator stimuli, and to more accurately simulate in vivo conditions, where the vessels are under the influence of neural and humoral vasoconstrictor stimuli, such as norepinephrine released from adrenergic nerve terminals. As such, it is important to be familiar with the basic properties of the arteries to be studied, either from the literature or from carefully conducted preliminary experiments. Because the endothelium plays a major role in regulating large arteries, small arteries, and arterioles in the microcirculation, it is essential to exercise caution to avoid damaging the endothelium during isolation and cannulation of the artery. The classic test for endothelium integrity is the demonstration that ACh causes vessel dilation. One caveat is that, under conditions of oxidative stress, the vessel endothelium may be intact, but vasodilatation to ACh is absent because excessive levels of superoxide scavenge the nitric oxide preventing the vasodilator response. In those cases, endothelial integrity can be verified by repeating the ACh application in the presence of a superoxide scavenger such as tempol, which should restore vasodilation in response to ACh and other endothelium-dependent vasodilator stimuli. Also, in a number of pathological conditions, the endothelium can release substances that cause contraction of the vascular smooth muscle cells and constriction of the artery; and in some cases, endothelium-dependent dilation (or constriction) is mediated via other substances such as cyclooxygenase metabolites, H2O2, epoxygenase metabolites, etc. The classic test for an endothelium-dependent vasodilator or vasoconstrictor substance is to demonstrate that the dilation or constriction of the artery is eliminated by endothelial removal. Finally, the identity of various endothelium-dependent vasodilator and vasoconstrictor substances can generally be ascertained by administration of specific inhibitors or scavengers, such as L-NAME to inhibit nitric oxide synthase, indomethacin to inhibit the formation of cyclooxygenase metabolites, catalase to scavenge H2O2, thromboxane synthase inhibitors, epoxygenase inhibitors, and/or antagonists of the CYP450-4A/20-HETE pathway.
It is also important (and instructive) to quantify the amount of active tone at the end of the experiment by perfusing and superfusing the artery with a Ca2+-free PSS, or administering a maximal dose of a powerful vasodilator agent such as papaverine. A typical level of active resting tone in the MCA, calculated as ((Dmax-Drest)/Dmax) x 100, is approximately 40%, where Dmax and Drest are the maximum (Ca2+-free PSS) and resting diameter (PSS), respectively, at the control equilibration pressure (usually 80 mmHg for MCA). Vessels with substantially less active tone or arteries showing segmental constrictions or dilations are excluded from analysis, as those signs are indicative of trauma to the vessels. Measurement of the diameters of maximally dilated arteries in Ca2+-free solution also allows the investigator to evaluate the passive mechanical properties of the vessels by measuring arterial diameter and calculating stress-strain relationships during sequential elevations in transmural pressure in the maximally dilated vessels7,56. These passive stress-strain relationships are easily obtained, and provide a valuable indication of any changes in mechanical characteristics of the vessels.
Cleanliness of the pipettes, connectors, and tubing supplying the reservoirs is absolutely critical for successful experiments. In this regard, it is important to flush all solutions out of the tubing after the experiment is completed, and to rinse and clean the tissue bath, the delivery tubing, and all reservoirs used to store, warm, and gas-equilibrate the PSS prior to reaching the vessel chamber. Stopcocks and valves in the delivery system should also be cleaned and changed periodically, as should any tubing carrying PSS. A classic sign of contaminated tubing is a gray haze generated by mold and bacteria; and those changes are accompanied by loss of normal reactivity of the blood vessels due to substances produced by the bacterial contamination. However, contamination by bacteria and other microorganisms can still be present in the absence of any visible evidence.
We believe that the present paper provides a helpful example for the use of time-honored techniques that are exceptionally well-suited for studies of the all-important small resistance arteries of different vascular beds. When combined with standard approaches for evaluating tissue perfusion, such as LDF and the GS1 lectin method for evaluating microvessel density, in vitro video microscopy of cannulated resistance arteries provides extremely valuable insight into the factors that control tissue perfusion and how these may be altered in disease states. In addition to providing a powerful means to study fundamental mechanisms of vascular smooth muscle and endothelial function in standard rat models, the use of video microscopy to study individual resistance arteries can be applied to other animal models and to human resistance arteries. The application of video microscopy of isolated resistance arteries of novel genetically engineered rat models opens new doors to understanding phenotypic changes that occur in response to altered function of a multitude (and ever-growing list) of genes.
Disclosures
The authors have no competing financial interests.
Acknowledgements
The authors express their sincere thanks to Katie Fink and Lynn Dondlinger for their invaluable assistance in the preparation of this manuscript.
Grant Support: NIH #R21-OD018309; #R56-HL065289; and #R01-HL128242.
Materials
| Name | Company | Catalog Number | Comments |
|---|---|---|---|
| SS Rat | Medical College of Wisconsin | SS/JHsd/Mcwi strain | Contact Dr. Aron Geurts (ageurts@mcw.edu) |
| SS.5BN Consomic Rat | Medical College of Wisconsin | SS-Chr 5BN/Mcwi strain | Contact Dr. Aron Geurts (ageurts@mcw.edu) |
| SS.13BN Consomic Rat | Medical College of Wisconsin | SS-Chr 13BN/Mcwi strain | Contact Dr. Aron Geurts (ageurts@mcw.edu) |
| Ren1-BN Congenic Rat | Medical College of Wisconsin | SS.BN-(D13hmgc41-D13)hmgc23/Mcwi strain | Contact Dr. Aron Geurts (ageurts@mcw.edu) |
| Ren1-SSA Congenic Rat | Medical College of Wisconsin | SS.BN-(D13rat77-D13rat105/Mcwi strain | Contact Dr. Aron Geurts (ageurts@mcw.edu) |
| Ren1-SSB Congenic Rat | Medical College of Wisconsin | SS.BN-(D13rat124-D13rat101/Mcwi strain | Contact Dr. Aron Geurts (ageurts@mcw.edu) |
| Nrf2(-/-) Knockout Rat and Wild Type Littermates | Medical College of Wisconsin | SD-Nfe212em1Mcwi strain | Contact Dr. Aron Geurts (ageurts@mcw.edu) |
| Low Salt Rat Chow (0.4% NaCl)-AIN-76A | Dyets, Inc. | 113755 | |
| High Salt Rat Chow (4% NaCl)-AIN-76A | Dyets, Inc. | 113756 | |
| Colorado Video Caliper | Colorado Video, Inc. | Model 308 | |
| Video Camera | Hitachi | KPM1AN | |
| Microscope | Olympus Life Science | CKX41 | |
| Television Monitor | Panasonic | WVBM1410 | |
| Pressure Transducers | Stoelting | 56360 | |
| Blood Pressure Display Unit | Stoelting | 50115 | |
| Cannulated Artery Chamber | Living Systems Instrumentation | CH-1 | Single vessel chamber for general use |
| Temperature Controller for Single Chamber | Living Systems Instrumentation | TC-09S | |
| Gas Dispersion Tube, Miniature,Straight | Living Systems Instrumentation | GD-MS | Provides aeration in the vessel bath |
| Gas Exchange Oxygenator, Miniature | Living Systems Instrumentation | OX | Allows gas exchange with perfusate |
| Laser-Doppler Flowmeter | Perimed | PeriFlux 5000 LDPM | |
| GS1 Lectin | Vector Labs | RL-1102 | |
| Glass Capillary Tubes for Micropipettes | Fredrich Haer Co. | 27-33-1 | 2 mm ODX1 mm ID |
| Verticle Pipette Puller | David Kopf Instruments | Model 700C | |
| Nylon suture material (10/0)-3 PLY | Ashaway Line and Twine Manufacturing Co. | 114-ANM-10 | Single strands of 3 ply nylon suture teased out for use on vessels |
| Dumont #5 Forceps-Inox | Fine Science Tools | 11254-20 | |
| Vannas Scissors | Fine Science Tools | 15003-08 | |
| Protandim | Protandim | NRF2 Inducer: Contact Dr. Joe McCord (JOE.MCCORD@UCDENVER.EDU) | |
| Sodium Chloride | Fisher Bioreagents | BP358-212 | |
| Sodium Bicarbonate | Fisher Chemical | S233-3 | |
| Dextrose (d-glucose) anhydrous | Fisher Chemical | D16-500 | |
| Magnesium Sulfate (MgSO4-7H2O) | Sigma Aldrich | M1880-500 G | |
| Calcium Chloride (CaCl2-2 H2O) | Sigma | C5080-500G | |
| Sodium Phosphate-Monobasic (NaH2PO4) | Sigma | S0751-500G | |
| Potassium Chloride (KCl) | Fisher Chemical | P217-500G | |
| Ethylenediaminetetraacetic acid disodium salt dihydrate (EDTA) | Sigma | ED255-500G |
References
- Furchgott, R. F., Zawadzki, J. V. The obligatory role of endothelial cells in the relaxation of arterial smooth muscle by acetylcholine. Nature. 288, 373-376 (1980).
- Bevan, J. A., Osher, J. V. A direct method for recording tension changes in the wall of small blood vessels in vitro. Agents Actions. 2, 257-260 (1972).
- Mulvany, M. J., Halpern, W. Contractile properties of small arterial resistance vessels in spontaneously hypertensive and normotensive rats. Circ. Res. 41, 19-26 (1977).
- Speden, R. N. The use of excised, pressurized blood vessels to study the physiology of vascular smooth muscle. Experientia. 41, 1026-1028 (1985).
- Osol, G., Halpern, W. Myogenic properties of cerebral blood vessels from normotensive and hypertensive rats. Am. J. Physiol. 249, H914-H921 (1985).
- Halpern, W., Kelley, M. In vitro methodology for resistance arteries. Blood Vessels. 28, 245-251 (1991).
- Feihl, F., Liaudet, L., Waeber, B. The macrocirculation and microcirculation of hypertension. Curr Hypertens Rep. 11, 182-189 (2009).
- Smits, G. J., Roman, R. J., Lombard, J. H. Evaluation of laser-Doppler flowmetry as a measure of tissue blood flow. J Appl Physiol. 61, 666-672 (1985).
- Hudetz, A. G., Roman, R. J., Harder, D. R. Spontaneous flow oscillations in the cerebral cortex during acute changes in mean arterial pressure. J Cereb Blood Flow Metab. 12, 491-499 (1992).
- Hudetz, A. G., Smith, J. J., Lee, J. G., Bosnjak, Z. J., Kampine, J. P. Modification of cerebral laser-Doppler flow oscillations by halothane, PCO2, and nitric oxide synthase blockade. Am J Physiol. 269, H114-H120 (1995).
- Hansen-Smith, F. M., Watson, L., Lu, D. Y., Goldstein, I. Griffonia simplicifolia I: fluorescent tracer for microcirculatory vessels in nonperfused thin muscles and sectioned muscle. Microvasc Res. 36, 199-215 (1988).
- Greene, A. S., Lombard, J. H., Cowley, A. W., Hansen-Smith, F. M. Microvessel changes in hypertension measured by Griffonia simplicifolia I lectin. Hypertension. 15, 779-783 (1990).
- Aitman, T., Dhillon, P., Geurts, A. M. A RATional choice for translational research? Dis Model Mech. 9, 1069-1072 (2016).
- Geurts, A. M., et al. Knockout rats via embryo microinjection of zinc-finger nucleases. Science. 325, 433(2009).
- Geurts, A. M., et al. Generation of gene-specific mutated rats using zinc-finger nucleases. Methods Mol Biol. 597, 211-225 (2010).
- Geurts, A. M., Moreno, C. Zinc-finger nucleases: new strategies to target the rat genome. Clin Sci (Lond). 119, 303-311 (2010).
- Priestley, J. R., Kautenburg, K. E., Casati, M. C., Endres, B. T., Geurts, A. M., Lombard, J. H. The NRF2 knockout rat: a new animal model to study endothelial dysfunction, oxidant stress, and microvascular rarefaction. Am J Physiol Heart Circ Physiol. 310, H478-H487 (2016).
- Cowley, A. W., et al. Brown Norway chromosome 13 confers protection from high salt to consomic Dahl S rat. Hypertension. 37, 456-461 (2001).
- Rapp, J. P. Dahl salt-susceptible and salt-resistant rats. A review. Hypertension. 4, 753-763 (1982).
- Rapp, J. P., Wang, S. M., Dene, H. A genetic polymorphism in the renin gene of Dahl rats cosegregates with blood pressure. Science. 243, 542-544 (1989).
- Manning, R. D. Jr, Meng, S., Tian, N. Renal and vascular oxidative stress and salt-sensitivity of arterial pressure. Acta Physiol Scand. 179, 243-250 (2003).
- Moreno, C., et al. Multiple blood pressure loci on rat chromosome 13 attenuate development of hypertension in the Dahl S hypertensive rat. Physiol Genomics. 31, 228-235 (2007).
- Tobian, L., Lange, J., Iwai, J., Hiller, K., Johnson, M. A., Goossens, P. Prevention with thiazide of NaCl-induced hypertension in Dahl "S" rats. Evidence for a Na-retaining humoral agent in "S" rats. Hypertension. 1, 316-323 (1979).
- Mattson, D. L., et al. Chromosome substitution reveals the genetic basis of Dahl salt-sensitive hypertension and renal disease. Am J Physiol Renal Physiol. 295, F837-F842 (2008).
- Kunert, M. P., et al. Consomic strategies to localize genomic regions related to vascular reactivity in the Dahl salt-sensitive rat. Physiol Genomics. 26, 218-225 (2006).
- Cowley, A. W., Liang, M., Roman, R. J., Greene, A. S., Jacob, H. J. Consomic rat model systems for physiological genomics. Acta Physiol Scand. 181, 585-592 (2004).
- Kunert, M. P., Dwinell, M. R., Lombard, J. H. Vascular responses in aortic rings of a consomic rat panel derived from the Fawn Hooded Hypertensive strain. Physiol Genomics. 42A, 244-258 (2010).
- Liang, M., et al. Renal medullary genes in salt-sensitive hypertension: a chromosomal substitution and cDNA microarray study. Physiol Genomics. 8, 139-149 (2002).
- Durand, M. J., Moreno, C., Greene, A. S., Lombard, J. H. Impaired relaxation of cerebral arteries in the absence of elevated salt intake in normotensive congenic rats carrying the Dahl salt-sensitive renin gene. Am J Physiol Heart Circ Physiol. 299, H1865-H1874 (2010).
- Hybertson, B. M., Gao, B., Bose, S. K., McCord, J. M. Oxidative stress in health and disease: the therapeutic potential of Nrf2 activation. Mol Aspects Med. 32, 234-246 (2011).
- Itoh, K., et al. An Nrf2/small Maf heterodimer mediates the induction of phase II detoxifying enzyme genes through antioxidant response elements. Biochem Biophys Res Commun. 236, 313-322 (1997).
- Myung, S. K., et al. Efficacy of vitamin and antioxidant supplements in prevention of cardiovascular disease: systematic review and meta-analysis of randomised controlled trials. BMJ. 346, f10(2013).
- Fredricks, K. T., Liu, Y., Lombard, J. H. Response of extraparenchymal resistance arteries of rat skeletal muscle to reduced PO2. Am J Physiol. 267, H706-H715 (1994).
- Fredricks, K. T., Liu, Y., Rusch, N. J., Lombard, J. H. Role of endothelium and arterial K+ channels in mediating hypoxic dilation of middle cerebral arteries. Am J Physiol. 267, H580-H586 (1994).
- Frisbee, J. C., Maier, K. G., Falck, J. R., Roman, R. J., Lombard, J. H. Integration of hypoxic dilation signaling pathways for skeletal muscle resistance arteries. Am J Physiol Regul Integr Comp Physiol. 283, R309-R319 (2002).
- Pavlov, T. S., Ilatovskaya, D. V., Palygin, O., Levchenko, V., Pochynyuk, O., Staruschenko, A. Implementing Patch Clamp and Live Fluorescence Microscopy to Monitor Functional Properties of Freshly Isolated PKD Epithelium. J Vis Exp. (103), (2015).
- Nelson, M. T., Conway, M. A., Knot, H. J., Brayden, J. E. Chloride channel blockers inhibit myogenic tone in rat cerebral arteries. J Physiol. 502 (Pt 2), 259-264 (1997).
- Brayden, J. E., Halpern, W., Brann, L. R. Biochemical and mechanical properties of resistance arteries from normotensive and hypertensive rats. Hypertension. 5, 17-25 (1983).
- Weber, D. S., Lombard, J. H. Elevated salt intake impairs dilation of rat skeletal muscle resistance arteries via ANG II suppression. Am J Physiol Heart Circ Physiol. 278, H500-H506 (2000).
- Weber, D. S., Lombard, J. H. Angiotensin II AT1 receptors preserve vasodilator reactivity in skeletal muscle resistance arteries. Am J Physiol Heart Circ Physiol. 280, H2196-H2202 (2001).
- Wang, J., Roman, R. J., Falck, J. R., de la Cruz, L., Lombard, J. H. Effects of high-salt diet on CYP450-4A omega-hydroxylase expression and active tone in mesenteric resistance arteries. Am J Physiol Heart Circ Physiol. 288, H1557-H1565 (2005).
- Raffai, G., et al. Modulation by cytochrome P450-4A omega-hydroxylase enzymes of adrenergic vasoconstriction and response to reduced PO2 in mesenteric resistance arteries of Dahl salt-sensitive rats. Microcirculation. 17, 525-535 (2010).
- Mishra, R. C., Wulff, H., Hill, M. A., Braun, A. P. Inhibition of Myogenic Tone in Rat Cremaster and Cerebral Arteries by SKA-31, an Activator of Endothelial KCa2.3 and KCa3.1 Channels. J Cardiovasc Pharmacol. 66, 118-127 (2015).
- Freed, J. K., Beyer, A. M., LoGiudice, J. A., Hockenberry, J. C., Gutterman, D. D. Ceramide changes the mediator of flow-induced vasodilation from nitric oxide to hydrogen peroxide in the human microcirculation. Circ Res. 115, 525-532 (2014).
- Beyer, A. M., Durand, M. J., Hockenberry, J., Gamblin, T. C., Phillips, S. A., Gutterman, D. D. An acute rise in intraluminal pressure shifts the mediator of flow-mediated dilation from nitric oxide to hydrogen peroxide in human arterioles. Am J Physiol Heart Circ Physiol. 307, H1587-H1593 (2014).
- Durand, M. J., et al. Vascular actions of angiotensin 1-7 in the human microcirculation: novel role for telomerase. Arterioscler Thromb Vasc Biol. 36, 1254-1262 (2016).
- Beyer, A. M., et al. Transition in the mechanism of flow-mediated dilation with aging and development of coronary artery disease. Basic Res Cardiol. 112, 5(2017).
- Muller, J. M., Chilian, W. M., Davis, M. J. Integrin signaling transduces shear stress--dependent vasodilation of coronary arterioles. Circ Res. 80, 320-326 (1997).
- Liu, Y., Harder, D. R., Lombard, J. H. Interaction of myogenic mechanisms and hypoxic dilation in rat middle cerebral arteries. Am J Physiol Heart Circ Physiol. 283, H2276-H2281 (2002).
- Potocnik, S. J., et al. Endothelium-dependent vasodilation in myogenically active mouse skeletal muscle arterioles: role of EDH and K+ channels. Microcirculation. 16, 377-390 (2009).
- Harder, D. R. Pressure-dependent membrane depolarization in cat middle cerebral artery. Circ Res. 55, 197-202 (1984).
- Greene, A. S., Rieder, M. J. Measurement of vascular density. Methods Mol. Med. 51, 489-496 (2001).
- Hernandez, I., Cowley, A. W., Lombard, J. H., Greene, A. S. Salt intake and angiotensin II alter microvessel density in the cremaster muscle of normal rats. Am J Physiol. 263, H664-H667 (1992).
- Resende, M. M., Amaral, S. L., Moreno, C., Greene, A. S. Congenic strains reveal the effect of the renin gene on skeletal muscle angiogenesis induced by electrical stimulation. Physiol Genomics. 33, 33-40 (2008).
- Petersen, M. C., Munzenmaier, D. H., Greene, A. S. Angiotensin II infusion restores stimulated angiogenesis in the skeletal muscle of rats on a high-salt diet. Am J Physiol Heart Circ Physiol. 291, H114-H120 (2006).
- Frisbee, J. C., Weber, D. S., Liu, Y., DeBruin, J. A., Lombard, J. H. Altered structure and mechanics of skeletal muscle arteries with high-salt diet and reduced renal mass hypertension. Microvasc Res. 59, 323-328 (2000).
- Drenjancevic-Peric, I., Lombard, J. H. Introgression of chromosome 13 in Dahl salt-sensitive genetic background restores cerebral vascular relaxation. Am J Physiol Heart Circ Physiol. 287, H957-H962 (2004).
- Drenjancevic-Peric, I., Phillips, S. A., Falck, J. R., Lombard, J. H. Restoration of normal vascular relaxation mechanisms in cerebral arteries by chromosomal substitution in consomic SS.13BN rats. Am J Physiol Heart Circ Physiol. 289, H188-H195 (2005).
- Lukaszewicz, K. M., Paudyal, M. P., Falck, J. R., Lombard, J. H. Role of vascular reactive oxygen species in regulating cytochrome P450-4A enzyme expression in Dahl salt-sensitive rats. Microcirculation. 23, 540-548 (2016).
- Lombard, J. H., Sylvester, F. A., Phillips, S. A., Frisbee, J. C. High-salt diet impairs vascular relaxation mechanisms in rat middle cerebral arteries. Am J Physiol Heart Circ Physiol. 284, H1124-H1133 (2003).
- Priestley, J. R., et al. Reduced angiotensin II levels cause generalized vascular dysfunction via oxidant stress in hamster cheek pouch arterioles. Microvasc Res. 89, 134-145 (2013).
- Velmurugan, K., Alam, J., McCord, J. M., Pugazhenthi, S. Synergistic induction of heme oxygenase-1 by the components of the antioxidant supplement Protandim. Free Radic Biol Med. 46, 430-440 (2009).
- Widlansky, M. E., Gokce, N., Keaney, J. F., Vita, J. A. The clinical implications of endothelial dysfunction. J Am Coll Cardiol. 42, 1149-1160 (2003).
- Lukaszewicz, K. M., Falck, J. R., Manthati, V. L., Lombard, J. H. Introgression of Brown Norway CYP4A genes on to the Dahl salt-sensitive background restores vascular function in SS-5BN consomic rats. Clin Sci (Lond). 124, 333-342 (2013).
- Lukaszewicz, K. M., Lombard, J. H. Role of the CYP4A/20-HETE pathway in vascular dysfunction of the Dahl salt-sensitive rat. Clin Sci (Lond). 124, 695-700 (2013).
- Roman, R. J. P-450 metabolites of arachidonic acid in the control of cardiovascular function. Physiol Rev. 82, 131-185 (2002).
- Roman, R. J., Maier, K. G., Sun, C. W., Harder, D. R., Alonso-Galicia, M. Renal and cardiovascular actions of 20-hydroxyeicosatetraenoic acid and epoxyeicosatrienoic acids. Clin Exp Pharmacol. 27, 855-865 (2000).
- Roman, R. J., Alonso-Galicia, M. P-450 eicosanoids: A novel signaling pathway regulating renal function. News Physiol Sci. 14, 238-242 (1999).
Reprints and Permissions
