Methods for the measurement and analysis of the temporal discrimination threshold are presented, and its application to the study of the pathogenesis of cervical dystonia are discussed.
A subscription to JoVE is required to view this content. Sign in or start your free trial.
Method Article
Measurement & Analysis of the Temporal Discrimination Threshold Applied to Cervical Dystonia
* These authors contributed equally
In This Article
Summary
Abstract
The temporal discrimination threshold (TDT) is the shortest time interval at which an observer can discriminate two sequential stimuli as being asynchronous (typically 30-50 ms). It has been shown to be abnormal (prolonged) in neurological disorders, including cervical dystonia, a phenotype of adult onset idiopathic isolated focal dystonia. The TDT is a quantitative measure of the ability to perceive rapid changes in the environment and is considered indicative of the behavior of the visual neurons in the superior colliculus, a key node in covert attentional orienting. This article sets out methods for measuring the TDT (including two hardware options and two modes of stimuli presentation). We also explore two approaches of data analysis and TDT calculation. The application of the assessment of temporal discrimination to the understanding of the pathogenesis of cervical dystonia and adult onset idiopathic isolated focal dystonia is also discussed.
Introduction
Temporal discrimination describes a person's ability to discriminate, or perceive, rapid changes in their environment. The temporal discrimination threshold (TDT) is the shortest time interval at which an individual can perceive that two sequential sensory stimuli are asynchronous. Temporal discrimination has been shown to be abnormally prolonged in disorders affecting the basal ganglia, including dystonia1,2,3,4,5,6,7.
Dystonia is the third most common neurological movement disorder - after Parkinson's disease and Essential Tremor. It is characterized by sustained or intermittent muscle contractions causing abnormal, often repetitive, movements or postures8. Dystonia can affect any part of the body. When it affects one body part it is known as focal dystonia8. Dystonia affecting the neck muscles is known as cervical dystonia, and is the most common phenotype of adult onset idiopathic isolated focal dystonia.9,10 The pathogenesis of cervical dystonia remains unknown; it is considered to be a genetic disorder with autosomal dominant inheritance and markedly reduced penetrance. Environmental factors are also considered important in relation to disease penetrance and expression.
The superior colliculus, a sensorimotor structure situated in the dorsal midbrain, is important for the rapid detection of environmental stimuli in the process of covert attentional orienting2,11,12. Visual stimuli access the superior colliculus rapidly through the retino-tectal magnocellular pathway. The TDT is a simple, objective measure believed to represent the processing of visual (and other sensory stimuli) in the superficial layers of the superior colliculus. The TDT has been studied in individuals with cervical dystonia, their unaffected relatives and healthy control participants. Compared to age- and sex-matched control participants, an abnormal TDT has high sensitivity (97%, 36 of 37 patients) and specificity (98-100%) in cervical dystonia1. An abnormal TDT has been found in 50% of unaffected first-degree female relatives of patients with cervical dystonia (14 of 25, aged 48 years or older), demonstrating age- and sex-related penetrance with autosomal dominant inheritance13,14. An abnormal TDT in unaffected relatives of cervical dystonia patients (compared to relatives with normal TDTs) is associated with increased putaminal volume (by voxel-based morphometry)15 and reduced putaminal activity (by fMRI)4. The superior colliculus is considered a significant node in the neuronal network, which is dysfunctional in cervical dystonia12. The assessment of temporal discrimination is regarded as providing important clues as to the pathomechanisms underlying cervical dystonia.
The goal of this article is to present two methods for measuring and analyzing temporal discrimination, as well as demonstrating the application of this method to studying the pathophysiology of cervical dystonia.
Access restricted. Please log in or start a trial to view this content.
Protocol
The Medical Research Ethics Committee at St. Vincent's University Hospital, Dublin gave approval for the recruitment of patients with cervical dystonia, their siblings (unaffected by dystonia), and healthy controls, to participate in the protocol described below.
1. Hardware & Software Solutions
Note: Two hardware options have been developed to display visual stimuli with precise inter-stimulus intervals. Both were designed and built in-house at the Trinity Centre for Bioengineering, Trinity College Dublin, and have been previously described5,16. Those wishing to replicate the exact hardware solutions used herein may request same by contacting the Trinity Centre for Bioengineering directly. Alternatively, a full set of instructions including 3D printing files for the headset, instructions for the accompanying Arduino microcontroller, etc. can be downloaded from http://www.dystoniaresearch.ie/temporal-discrimination-threshold/. The stimuli presented in the table top approach may be generated using custom programs in Presentation (e.g., Neurobehavioural Systems), installed on a desktop computer and programmed to control the light-emitting diodes (LED) via the parallel port of the computer. Alternatively, as described below, the table top LEDs may be controlled via an Arduino microcontroller. Both the Presentation code and Arduino files are also available to download from the above link.
- TDT hardware: Table-Top Method
- Mark an 'X', as a fixation point, on a black mat or sheet placed on the table in front of the participant.
- Ask the participant to position themselves so that they are sitting directly in front of the fixation point.
- Place the yellow light-emitting diode (LED) pairs (5 mm diameter, 90 cd/m2 luminance), encased in a box, on the table in front of the participant.
- Orient the box such that the LEDs are vertically aligned and positioned 7 ° from the subject's center point on the left and right side, as needed.
- Conduct this experiment in a darkened room. A small amount of background luminance may be required to enable the operator to see enough to run the experiment.
- Instruct the participant to focus on the fixation point at all times and not to look directly at the flashing LEDs.
- Connect the microcontroller to the LED box and follow the on-screen instructions displayed on the liquid crystal display of the microcontroller box, e.g., select presentation method: 'random' or 'staircase', and select mode: 'left top first', etc.
- Ask the participant to respond "same" or "different" following presentation of each stimulus pair, depending on whether they perceive the stimuli to be synchronous or asynchronous.
- Inform the participant when each trial is about to commence, by vocalizing the on-screen countdown from 5 - 0 s.
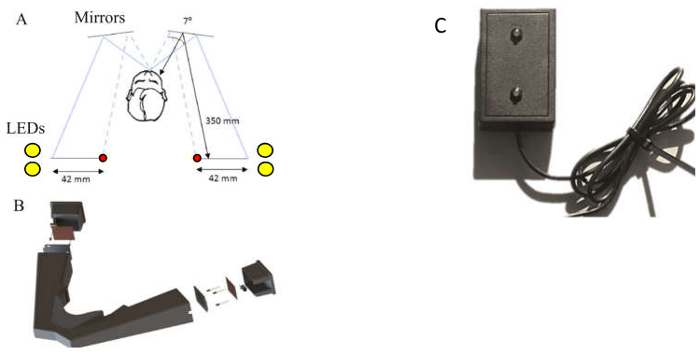
Figure 1: (a) Schematic of the design of the headset. A pair of yellow LEDs (5 mm diameter),and the red fixation LED (3 mm diameter), are placed on the left and right side of the participant via a head-mounted unit and made visible by way of reflection in the mirrors in front of the user. (b) Schematic 3D model of the headset. The headset was developed from laser-sintered nylon plastic, weighs 0.70 kg, has a low transparency index and is black in color to minimize light penetrance. (a and b) are reproduced, with slight modification, from Butler et al.16 with permission from IOP Publishing. (c) The LED stimulus box for table-top presentation.
- TDT Hardware: Portable TDT Headset
- Conduct the experiment in any suitable location.
- Connect the microcontroller to the headset and follow the on-screen instructions displayed on the liquid crystal display of the microcontroller box, e.g., select presentation method: 'random' or 'staircase', and mode: 'left top first', etc.
- Direct the participant to position themselves with their elbows on a table in front of them. Then, holding the device in their hands, direct them to gently press their face into the rubber sealant surrounding the eyepiece, thereby sealing out ambient light.
- Instruct the participant to focus on the red fixation LED at all times and not to look directly at the flashing LEDs.
- Ask the participant to respond "same" or "different" following presentation of each stimulus pair, depending on whether they perceive the stimuli to be synchronous or asynchronous.
- Inform the participant when each trial is about to commence, by vocalizing the on-screen countdown from 5 - 0 s.
2. Stimulus Presentation
Note: Two approaches to stimulus presentation have been employed.
- Staircase method
- Select 'staircase' presentation; stimuli are presented every 5 s with the inter-stimulus interval starting at 0 and becoming progressively more asynchronous (increasing by 5 ms) each time.
- Select any of the four presentation modalities: (i) left top LED first (ii) left bottom LED first (iii) right top LED first, or (iv) right bottom LED first.
- Repeat step 2.1.2 so that each modality is run twice, resulting in a total of eight runs.
- Terminate the trial when a participant responds "different" for three consecutive pairs of stimuli.
- Random Presentation Method
- Select 'Random' presentation; stimuli pairs are presented every 5 s. The inter-stimulus interval varies, in a randomized fashion, from 0-100 ms.
- Select any of the four presentation modalities: (i) left top LED first (ii) left bottom LED first (iii) right top LED first, or (iv) right bottom LED first.
- Repeat step 2.2.2 so that each modality is run twice, resulting in a total of eight runs.
Note: Each run is the same length and will complete automatically.
3. Data Analysis
- Single TDT value
- Using the data from the staircase method, highlight the first of the final three "different" responses for each of the eight runs. These are the threshold values for each run.
- Calculate the temporal discrimination threshold (TDT) for each participant by taking the median of the thresholds from each of their eight runs; resulting in a single TDT value (in milliseconds) per individual.
- Calculate the Zscore for each participant. Define the Zscore as the difference between the participant's TDT, and the mean TDT from an age-matched control population (
 , divided by the standard deviation of the TDT values for that control population
  .
.

- Determine if the individual has a normal or abnormal TDT. A Zscore ≥ 2.5 is deemed to reflect an abnormal TDT.
- Distribution Analysis
- Using the data from the staircase method, encode the response data such that '0' corresponds to "same" and '1' corresponds to "different", Table 1.
- Download a free MATLAB.exe to perform the distribution analysis described below from http://www.dystoniaresearch.ie/temporal-discrimination-threshold/. See Butler et al.16 for a full description of this method. Alternatively, proceed as described below.
- Pad out the data to ensure all runs are the same length as the longest run. This is done by assuming all subsequent responses, following termination of a run, are "different", Table 1(b).
- Average responses across trials for each participant, Table 1(c). This can be plotted as a function of stimulus asynchrony.
- Fit this averaged or representative data with a cumulative Gaussian function. The mean of this distribution represents the point at which participants are equally likely to respond “same” or “different”. This point is referred to as the ‘point of subjective equality’ (PSE). The standard deviation of the Gaussian distribution, also referred to as the ‘just noticeable difference’ (JND), indicates how sensitive participants are to changes in temporal asynchrony around their mean.
- Extend the analysis by submitting the data to a non-parametric bootstrapping procedure in order to estimate the 95% confidence intervals for the TDT and the PSE and JND of the psychometric, cumulative Gaussian function. To do this, generate new representative data sets by random sampling with replacement from the original responses, Table 1(b), for each time step. Calculate the TDT and fit a new psychometric function for each representative data set16.
- Calculate the goodness of fit, or deviance (D), for each participant using the log-likelihood ratio,16,17

where K is the number of time points, ni is the number of repetitions at that time point, generally eight repetitions (four right and four left), yi is the observed proportion of asynchronous responses, pi is the proportion of asynchronous responses predicted by the fitted curve. A deviance value of 0 means a perfect fit. - Plot the results.
Note: Data from the random presentation approach can be analyzed to determine the single or distributed TDT as described in section 3 above for data arising from the staircase presentation method. However, due to the random presentation order of inter-stimuli intervals, these data must first be ordered (from smallest to largest inter-stimulus interval), prior to commencing the analysis described above, Table 2. In addition, it is not necessary to pad the data following random presentation as, by default, all runs are of equal length.
Access restricted. Please log in or start a trial to view this content.
Results
Examples of filled score sheets are provided in Tables 1 and 2, where these respectively represent results following staircase and random stimulus presentation methods. The thresholds for each run (the timing of the first of three stimulus pairs deemed to be 'different'), are highlighted. In the case of Table 1, the TDT is calculated as 25 ms (i.e., the median of 40, 25, 25, 25, 45, 25, 40, 10 ms). These data are...
Access restricted. Please log in or start a trial to view this content.
Discussion
TDT Measurement and Analysis
Two forms of apparatus (table-top and headset), two methods of stimulus presentation (staircase and random), and two approaches to data analysis (traditional and distribution) have been presented to illustrate how to measure and quantify a person's temporal discrimination ability. The portable headset provides a convenient hardware option that ensures consistency in distance and angles between the participant and the LED light sources while al...
Access restricted. Please log in or start a trial to view this content.
Disclosures
Rebecca B Beck, Eavan M Mc Govern, John Butler, Dorina Birsanu, Brendan Quinlivan, Ines Beiser, Shruti Narasimham have no funding sources, financial disclosures or conflict of interests to declare. Michael Hutchinson receives research grants from Dystonia Ireland, the Health Research Board of Ireland (CSA-2012-5), Foundation for Dystonia Research (Belgium) and the Irish Institute of Clinical Neuroscience. Sean O'Riordan reports receiving a speaker's honorarium from Abbvie. Richard Reilly receives funding from Science Foundation Ireland, Enterprise Ireland and the Health Research Board of Ireland.
Acknowledgements
This research was supported by grants from the Health Research Board, Dystonia Ireland, Science Foundation Ireland and the Irish Institute for Clinical Neuroscience.
Access restricted. Please log in or start a trial to view this content.
Materials
| Name | Company | Catalog Number | Comments |
|---|---|---|---|
| TDT head set | Can be supplied by Trinity Centre for Bioengineering, Trinity College Dublin. Alternatively full instructions are available for free download from http://www.dystoniaresearch.ie/temporal-discrimination-threshold/ | 1 | A custom-built, portable device for the presentation of visual stimuli. |
| TDT table top LED box | Can be supplied by Trinity Centre for Bioengineering, Trinity College Dublin. Alternatively full instructions are available for free download from http://www.dystoniaresearch.ie/temporal-discrimination-threshold/ | 2 | A custom-built, table-top device for the presentation of visual stimuli. |
| Microcontroller | Can be supplied by Trinity Centre for Bioengineering, Trinity College Dublin. Alternatively full instructions are available for free download from http://www.dystoniaresearch.ie/temporal-discrimination-threshold/ | 3 | A custom-built microcontroller for the delivery of visual stimuli in staircase or random order, with precise inter-stimulus intervals. |
References
- Bradley, D., et al. Temporal discrimination thresholds in adult-onset primary torsion dystonia: an analysis by task type and by dystonia phenotype. J Neurol. 259 (1), 77-82 (2012).
- Hutchinson, M., et al. The endophenotype and the phenotype: temporal discrimination and adult-onset dystonia. Mov Disord. 28 (13), 1766-1774 (2013).
- Kimmich, O., et al. Sporadic adult onset primary torsion dystonia is a genetic disorder by the temporal discrimination test. Brain. 134 (Pt 9), 2656-2663 (2011).
- Kimmich, O., et al. Temporal discrimination, a cervical dystonia endophenotype: penetrance and functional correlates. Mov Disord. 29 (6), 804-811 (2014).
- Molloy, A., et al. A headset method for measuring the visual temporal discrimination threshold in cervical dystonia. Tremor Other Hyperkinet Mov (N Y). 4, 249(2014).
- Termsarasab, P., et al. Neural correlates of abnormal sensory discrimination in laryngeal dystonia. Neuroimage Clin. 10, 18-26 (2016).
- Fiorio, M., et al. Defective temporal processing of sensory stimuli in DYT1 mutation carriers: a new endophenotype of dystonia? Brain. 130 (1), 134-142 (2007).
- Albanese, A., et al. Phenomenology and classification of dystonia: a consensus update. Mov Disord. 28 (7), 863-873 (2013).
- Nutt, J. G., Muenter, M. D., Aronson, A., Kurland, L. T., Melton, L. J. 3rd Epidemiology of focal and generalized dystonia in Rochester, Minnesota. Mov Disord. 3 (3), 188-194 (1988).
- Williams, L., et al. Epidemiological, clinical and genetic aspects of adult onset isolated focal dystonia in Ireland. Eur J Neurol. , (2016).
- Bell, A. H., Munoz, D. P. Activity in the superior colliculus reflects dynamic interactions between voluntary and involuntary influences on orienting behaviour. Eur J Neurosci. 28 (8), 1654-1660 (2008).
- Hutchinson, M., et al. Cervical dystonia: a disorder of the midbrain network for covert attentional orienting. Front Neurol. 5, 54(2014).
- Williams, L. J., et al. Young Women do it Better: Sexual Dimorphism in Temporal Discrimination. Front Neurol. 6, 258(2015).
- Butler, J. S., et al. Age-Related Sexual Dimorphism in Temporal Discrimination and in Adult-Onset Dystonia Suggests GABAergic Mechanisms. Front Neurol. 6, 258(2015).
- Bradley, D., et al. Temporal discrimination threshold: VBM evidence for an endophenotype in adult onset primary torsion dystonia. Brain. 132 (Pt 9), 2327-2335 (2009).
- Butler, J. S., et al. Non-parametric bootstrapping method for measuring the temporal discrimination threshold for movement disorders. J Neural Eng. 12 (4), 046026(2015).
- Wichmann, F. A., Hill, N. J. The psychometric function: I. Fitting, sampling, and goodness of fit. Percept Psychophys. 63 (8), 1293-1313 (2001).
- McGovern, E. M., et al. A comparison of stimulus presentation methods in temporal discrimination testing. Physiol Meas. 38 (2), N57-N64 (2017).
- Scontrini, A., et al. Somatosensory temporal discrimination in patients with primary focal dystonia. J Neurol Neurosurg Psychiatry. 80 (12), 1315-1319 (2009).
- Nardella, A., et al. Inferior parietal lobule encodes visual temporal resolution processes contributing to the critical flicker frequency threshold in humans. PLoS One. 9 (6), e98948(2014).
- Pastor, M. A., Macaluso, E., Day, B. L., Frackowiak, R. S. Putaminal activity is related to perceptual certainty. Neuroimage. 41 (1), 123-129 (2008).
- Isa, T., Hall, W. C. Exploring the superior colliculus in vitro. J Neurophysiol. 102 (5), 2581-2593 (2009).
- Isa, T., Endo, T., Saito, Y. The visuo-motor pathway in the local circuit of the rat superior colliculus. J Neurosci. 18 (20), 8496-8504 (1998).
- Kaneda, K., Isa, T. GABAergic mechanisms for shaping transient visual responses in the mouse superior colliculus. Neuroscience. 235, 129-140 (2013).
- Ramos, V. F., Esquenazi, A., Villegas, M. A., Wu, T., Hallett, M. Temporal discrimination threshold with healthy aging. Neurobiol Aging. 43, 174-179 (2016).
Access restricted. Please log in or start a trial to view this content.
Reprints and Permissions
