The goal of this protocol is to obtain high viability and high yield of hepatocytes and sinusoidal endothelial cells from liver. This is accomplished by perfusing the liver with a type IV collagenase solution via the portal vein, followed by differential centrifugation to obtain hepatocytes and sinusoidal endothelial cells.
Method Article
Purification of Hepatocytes and Sinusoidal Endothelial Cells from Mouse Liver Perfusion
In This Article
Summary
Abstract
This protocol demonstrates a method for obtaining high yield and viability for mouse hepatocytes and sinusoidal endothelial cells (SECs) suitable for culturing or for obtaining cell lysates. In this protocol, the portal vein is used as the site for catheterization, rather than the vena cava, as this limits contamination of other possible cell types in the final liver preparation. No special instrumentation is required throughout the procedure. A water bath is used as a source of heat to maintain the temperature of all the buffers and solutions. A standard peristaltic pump is used to drive the fluid, and a refrigerated table-top centrifuge is required for the centrifugation procedures. The only limitation of this technique is the placement of the catheter within the portal vein, which is challenging on some of the mice in the 18 - 25 g size range. An advantage of this technique is that only one vein is utilized for the perfusion and the access to the vein is quick, which minimizes ischemia and reperfusion of the liver that reduces hepatic cell viability. Another advantage to this protocol is that it is easy to distinguish live from dead hepatocytes by eyesight due to the difference in cellular density during the centrifugation steps. Cells from this protocol may be used in cell culture for any downstream application as well as processed for any biochemical assessment.
Introduction
Collagenase perfusion of the liver to obtain hepatocytes has been performed since the early 1950s and has been continually improved upon1,2,3,4. A very nice review of many of the methodologies, techniques, and reagents used in liver cell purification has been compiled in Meyer et al5. Obtaining a satisfactory yield of highly viable hepatocytes and SECs is technically challenging. The mechanical forces that separate the cells including the quality of collagenase are some of the variables that are difficult to control. Due to hepatocyte sensitivity to mechanical forces, their viability is markedly reduced in sub-optimal conditions, prompting the need for a protocol describing optimal conditions for isolation. SECs appear not to be as sensitive to mechanical shearing. In situ perfusion with collagenase digestion is by far the best method to disrupt cell-cell junctions to obtain single cell preparations from liver and other organs such as intestine and spleen6. This protocol demonstrates a simple method for introducing perfusion buffer into the portal vein by using a retractable plastic catheter rather than an incision that could cause the portal vein to collapse, as described in Smedsrød et al7.
The goal of this manuscript is to demonstrate the most critical steps required for success in the liver profusion procedure. These steps include catheter placement, flow of the perfusion liquids, and handling of the tissue after digestion. Flow rates are adjusted above the natural rate of blood flow, but low enough to keep the Glisson's capsule intact. Once the liver is properly digested and cells are separated in solution, cell purification is relatively simple whether it is performed by differential centrifugation, plate adhesion, or by magnetic bead purification. Live hepatocytes have a higher density and are easily purified from the nonparenchymal cells (NPCs) and dead hepatocytes with slow speed centrifugation. For most applications, plate adhesion for separating Kupffer cells (KCs) and SECs is a common method8, though there are reports that it does not produce the best purity of SECs9. KCs have a tendency to adhere to solid rigid surfaces quickly and Petri dishes (standard polystyrene) are the most commonly used material for this procedure. SEC or KC purification with the use of antibody-conjugated magnetic beads is undoubtedly the best method for significant purification of these cells, though the procedure adds another 3 - 4 h onto this protocol and the overall yield is decreased9. This report demonstrates in detail the process for an optimal liver perfusion that typically yields a high number of viable cells.
Protocol
All animal procedures outlined in this protocol have been approved by the Institutional Animal Care and Use Committee (IACUC) at the University of Lincoln - Nebraska under protocol #1435.
1. Preparation
- Preparation of solutions and culture media
- Prepare all culture media and buffer according to the Table of Materials.
- Preparation of instruments
- Set up a water bath (>10 L) at 42 °C, a peristaltic pump with variable speed, and clamps for holding flasks. Prepare curved scissors and forceps (Figure 1).
- On or adjacent to the water bath, set up a baking sheet (about 38 x 26 cm) with a Styrofoam pad (50 mL conical rack), overlaid with an absorbent underpad cut into a 20 x 20 cm piece (Figure 1).
- Place a piece of masking tape (5 - 8 cm) nearby. Place a 20 cm polyester sewing thread nearby that is cut and ready to use. Obtain a plastic catheter with a retractable needle (7 mm x 19 mm, Figure 1).
- Preparation of glassware
- Using clamps, place and immobilize a 1 L flask in the water bath containing 200 mL of 1x PBS with a stopper that has two 1 mL pipettes going into the solution. The rubber cork is notched to allow recirculation of fluid in a closed circuit.
- With another clamp, place a 125 mL flask containing 45 mL of Buffer 2 along with a stopper that has two 1 mL pipettes, one of which is in the liquid near the bottom of the flask and the other which stays above the liquid and blows oxygen into the flask.
NOTE: Each pipette in the stoppers will have a quick disconnect adaptor attached to the end for easy switching of the tubing. Oxygen will be gently flowing into both flasks via the pipette in the stopper that is not immersed in the liquid. - Set aside two sterile crystallizing dishes.
2. Animal Procedure
- Warm up the PBS and Buffer 2 solutions to 42 °C in the water bath and circulate PBS for at least 20 mL/min in the tubing in a closed circuit to keep the liquid lines warm. Immerse any excess tubing in the water bath to remain as close as possible to 42 °C. Drain the male end of the tubing into the 1 L flask containing PBS.
- Place a cotton ball on the absorbent underpad and add about 2 mL of 30% isoflurane (made up in polyethylene glycol 200 which decreases the evaporation rate of isoflurane) on the cotton ball using a transfer pipette.
- Pick up the mouse by the tail, place it in one of the crystallizing dishes, and then quickly overturn the dish onto the cotton ball so that the mouse has a small space in which to inhale the anesthesia. Observe the breathing rate of the mouse and ensure the mouse is effectively under anesthesia.
NOTE: The breathing rate should be slower and deeper, the tail flaccid, and the paws nonresponsive to the pinch test under anesthesia; see IACUC guidelines for additional details. - While the mouse is going under anesthesia (this takes 1-2 min), prepare the barrel of a 10 mL syringe by pulling out the plunger and inserting a small cotton ball. Add 1–2 mL of 30% isoflurane with a transfer pipette to the cotton ball inside the barrel and place the barrel open-end down on a table while waiting for the mouse to become unconscious.
- Quickly take off the crystallizing dish, flip the mouse on its back and place the syringe barrel over its nose. Double check the breathing rate, toe pinch, and flaccid tail. Any responses to the toe pinch and flaccid tail indicates that the mouse is not fully under anesthesia. Keep the syringe barrel over the snout to maintain unconsciousness.
- Place thumb tacks through the paws of the mouse, with the limbs outstretched in supine position.Wet the abdomen and rib cage with 70% isopropanol or ethanol.
- With the straight forceps in one hand, lift up the skin near the base of the abdomen. With scissors in the other hand, cut the tented skin and peritoneum. The incision should be horizontal or across the base of the tented skin. Be sure to cut through all layers of skin and peritoneum in order to gain access to the gut. Cut laterally around the abdomen up to the rib cage on both sides without nicking any of the organs.
- Cut off the flap of skin by cutting across the lower rib cage. Move the intestines to the right with the back of the forceps to expose the portal vein.
NOTE: Bleeding from the animal should be minimal; the animal should still be breathing and under deep anesthesia. - Place the closed curved forceps underneath the portal vein between the liver and superior pancreaticoduodenal vein (Figure 3 arrow).
- Open the forceps while underneath the portal vein. Grasp the thread and carefully pull it through so that it is centered underneath the portal vein. Tie an overhand knot around the portal vein without cinching it down.
- Place the curved forceps under the portal vein and gently pull it towards the tail of the mouse to straighten out the vein (Figure 4A).
- With the catheter in the other hand, place the bevel of the needle face-up and parallel with the lower part of the portal vein near the forceps (Figure 4B).
- Gently puncture the vein with the needle (Figure 4C). Ensure the bevel of the needle is in the lumen of the vein. Retract the spring-loaded needle and continue to push the polymer catheter through the vein until the bevel is near the venous branched area. This is within the liver. If the catheter is placed correctly, a back-flow of blood will be visible. (Figure 4D).
- Tighten the overhand knot and pull it down on the catheter to help stabilize it. Immediately turn down the pump rate from 20 mL/min to 4 mL/min and cut another major blood vessel for drainage. Cut the aorta abdominalis for optimal results.
- Place the male end of the tubing to the female end of the catheter (Figure 5A). Ensure that there are no air bubbles in the line. Be careful that the catheter is not either pushed into the liver or out of the vein. Placement of the thread is not essential, though it helps prevent back-flow out of the vein and helps keep the catheter in the correct position (Figure 5B, C).
- Use masking tape to immobilize the tubing onto the underpad. Use the straight forceps to squeeze the effluent blood vessel to inflate the liver a few times to ensure all the blood has drained out (Figure 5D).
NOTE: Standard laboratory tape may not work; however, masking tape will remain stuck to the underpad, even in wet conditions.
3. Liver Perfusion
- While the liver is flushing with PBS, measure out about 24 mg of Collagenase Type IV and place it in the flask containing 45 mL of Buffer 2 in the water bath. Be sure to swirl the liquid in the flask so that the collagenase is fully dissolved and place the flask back in the clamp so that the liquid containing portion of the flask is fully submerged in the water.
- Observe the change in color of the liver as it is flushed with PBS. Change the outflow tubing from the 1 L flask to the 125 mL flask. Do not allow air bubbles to flow into the liver.
- Once the perfusion buffer reaches the liver, briefly squeeze tight the effluent blood vessel to build up some pressure within the vessel and allow this liquid to fill all lobes of the liver. Be sure not to cut off drainage too long, as that may burst the thin connective tissue surrounding the liver (Glisson's capsule) and destroy the perfusion or flow of liquid within the capillary bed of the liver.
- Allow Buffer 2 with collagenase to perfuse through the liver until all 45 mL have flowed through the tissue.
NOTE: If successful, the Glisson's capsule should be separated from the parenchyma or the liver tissue and the liver itself should appear amorphous. - Add about 10 mL of Buffer 1 to the other crystallizing dish and place it next to the mouse.
- Remove the catheter and turn the pump off.
- With the straight forceps and scissors, cut the liver from the mouse. If the collagenase digestion was very efficient, it may be necessary to have a clean, sterile spoon on hand to scoop the liver from the mouse and place it in Buffer 1.
4. Hepatocyte Purification
NOTE: Manipulation of the cells are performed in a sterile tissue culture hood to limit contamination if the cells are to be cultured in all subsequent steps.
- Using sterile technique, grab the liver with forceps and gently shake the cells from the liver. Tear apart or pull back the Glisson's capsule: the buffer will become opaque as cells are shaken from the liver.
- Pour off the cell solution into a 50 mL conical with a 100 µm filter placed over the top.
- Add more Buffer 1 to the liver remnants and continue to shake out cells. Continue until the liver appears devoid of cells or when the undigested portions of the liver do not yield anymore cells.
- Pour the cellular liquid into another 50 mL conical containing a 40 µm filter.
- Centrifuge the conical in a swinging bucket rotor at 100 x g for 3 min.
NOTE: Do not use the maximum brake as this may dislodge the cell pellet. Use the brake at 80% which is sufficient for all remaining centrifugation steps at 4 °C - Pour off the supernatant (which contains NPCs and dead hepatocytes) into a clean conical and place it on ice. Ensure this is done in one motion to observe pellet adherence.
- Resuspend the pellet in 40 mL of Buffer 1. Repeat steps 4.5 and 4.6. Resuspend the pellet in 40 mL of Buffer 3. Repeat steps 4.5 and 4.6 twice.
- Resuspend the purified hepatocytes in warm DMEM + 10% FBS + 2x Penicillin-Streptomycin (Pen/Strep).
- If the cells are cultured on collagen coated plates, allow them to adhere for 1 h and replace the media at least once as this will prevent any nascent bacterial contaminants.
- Make the collagen coated plates by incubating them with 0.05% collagen in 0.001% acetic acid for at least 1 h at 37 °C, and then washing with 1x PBS.
- If the hepatocyte viability is low and there is a desire to obtain purified high-viable hepatocytes then use the following protocol adapted from Kreamer et al10.
- Mix 9 volumes of PVP solution (Percoll, a 23% w/w solution of water and 15 - 30 nm colloidal silica particles coated in polyvinylpyrrolidone for density centrifugation) and 1 volume of 10x HBSS to make an iso-osmotic PVP solution (SIP).
- Add 24 mL of SIP to a sterile 50 mL conical which may be stored in these conditions for up to 2 months at 4 °C.
- Adjust the hepatocyte concentration to 5 - 10 × 106 cells/mL with culture medium such as the one noted in step 4.8.
- Add 25 mL of cell suspension to each 24 mL SIP containing conical and mix by gentle inversion. The density of this solution is 1.06 g/mL.
- Centrifuge the conical at 50 x g for 10 min at 4 °C.
- Aspirate the SIP and flocculant, and resuspend the cells in HBSS.
- Wash the cells by centrifugation at 50 x g for 10 min at 4 °C.
- Repeat step 4.10.6 once more and then resuspend cells in growth medium.
5. SEC Purification
- Pellet the cells in the supernatants from step 4.6 by spinning the tubes at 163 x g for 10 min. Discard the supernatants from the tubes and resuspend all of cell pellets in 5 mL of RPMI without serum and pool them together in one tube.
- Once all pellets have been pooled, add RPMI to final volume of 35 mL.
- Centrifuge the pooled conical at 25 x g for 3 min. Carefully aspirate the top 25 mL of RPMI with a 25 mL pipette and place this media containing NPCs in a clean 50 mL conical on ice.
- Add 25 mL of fresh RPMI back to the tube and resuspend the pellet.
- Repeat step 5.3 for a second wash and pool the supernatant. Discard the remaining 10 mL of media and pellet (the pellet consists mostly of dead hepatocytes). Centrifuge the pooled supernatant at 163 x g for 10 min.
- During the centrifugation, prepare the PVP solution gradients in a 50 mL conical.
- Add 15 mL of 50% PVP solution to the 50 mL conical followed by 20 mL of 25% Percoll overlaid with a pipettor set to the slowest ejection speed. Be sure to observe a refraction line at the 15 mL mark that demarcates the two layers, as this is where the SECs and KCs will aggregate after the centrifugation.
- Resuspend the cells previously pelleted in step 5.5 in 10 mL of cold RPMI and overlay them onto the PVP solution gradient. Be sure to maintain a clear demarcation between the two layers. Centrifuge the gradient at 805 x g for 20 min with a brake set at 50%.
- Aspirate from the top down direction to the 20 mL mark on the tube and discard this material. With a 5 mL transfer pipette, collect the SECs and KCs that are located at the 25/50% interface. Discard any brown clumps of cells as these are dead hepatocytes.
- Place the cells in a 50 mL conical and add RPMI up to the 50 mL mark to dilute out the PVP solution. Centrifuge at 200 x g for 10 min, with 80% brake.
- Aspirate and discard the supernatant and resuspend the pellet while washing off the cone of the conical in 12 mL of warm RPMI.
- Separate the SECs from KCs by placing the supernatant in a polystyrene Petri dish and incubate in a humidified tissue culture incubator for 8 min at room temperature.
- Aspirate the media with a 25 mL pipette and rinse the plate with the same media, with the pipettor set at the lowest speed to collect the remaining SECs while the KCs adhere to the plate.
- Centrifuge the SECs at 200 x g for 10 min and resuspend in RPMI + 5% FBS + Pen/Strep. Then titer the cells, and place in collagen-coated culture dishes.
Results
A demonstrational, refined method for liver perfusion and purification/enrichment of hepatocytes and SECs is presented here that provides detailed tips for optimal cell purification/enrichment similar to other printed reports compiled in this referenced review 5. The critical steps which determine success for cellular purification occur in the route and technical details of the collagenase perfusion procedure and are outlined in this protocol. The set-up for the apparatus is fairly simple and cost effective with standard laboratory equipment, in contrast to other systems that have been published11 (Figure 1). In this set-up, the tray holding the mouse is sitting on the water bath with some of the excess tubing in the water bath to maintain the temperature of the liquids perfusing within the liver. The apparatus as shown here may be used for mice as well as rats, with a slightly different geometry for rat liver perfusion12 (Figure 2).
In this procedure, the liver is perfused via the portal vein instead of the vena cava (which is another popular perfusion route) due to its ease of access within the abdomen and that the vein feeds directly into the liver. The viewer should be aware that the portal vein has several small branches which may short-circuit the perfusate, and the catheter should be placed past these branches for optimal success13 (Figure 3). Once the portal vein is identified, curved forceps are used to draw a surgical suture or polyester thread beneath the portal vein between the liver and the superior pancreatic-duodenal vein. The forceps are also used to straighten out the portal vein which is under positive blood pressure (Figure 4A). The needle within the catheter should be placed parallel and next to the vein (Figure 4B) and the bevel should be gently inserted into the lumen of the vein (Figure 4C). Proper placement will be indicated by blood appearing along the catheter. Once the needle is retracted the catheter should be stabilized with a thread tied down upon it and the blood pressure will force blood up through the catheter. It is recommended that the catheter be connected to the pump tubing before blood spills out (Figure 4D). Once the pump tubing is connected, immediately cut a major blood vessel such as the vena cava or aorta abdominalis for blood/fluid drainage (Figure 5A). It is usually necessary to cut the side of the abdominal wall of the mouse for sufficient drainage, as a buildup of blood in the abdomen makes it difficult to visualize the perfusion process, and blood may carry over into the cell purification (Figure 5B). Once the PBS begins to perfuse the liver, the liver will blanch with the absence of blood (Figure 5C). If only a few of the lobes blanch, then the likely cause is that the catheter has been placed too far inside the liver and will need to be backed out slowly. Once placement of the catheter is confirmed, use water-resistant masking tape to secure the tubing in place. General laboratory tape is usually not sufficient. To confirm proper placement of the catheter, squeeze the cut blood vessel to cease drainage and observe the increase pressure within the liver. Doing this will aid in flushing blood out of the liver (Figure 5D). This should also be done when the collagenase solution initially goes into the liver to ensure that all lobes are exposed to collagenase. After the collagenase solution runs out, a good collagenase digestion is indicative by separation of the Glisson's capsule from the parenchyma.
The general procedure for cellular purification is outlined in Figure 6 and Figure 7 in which hepatocytes are harvested early on in the procedure during the low speed spins and are very pure after 4 washes in BSA-containing buffers (Figure 8). SECs are co-purified with KCs on a PVP gradient (Figure 9A) and then separated by selective adhesion on a collagen-coated polystyrene Petri dish. The purity of the SECs using this method is 83 - 90% pure and largely depends on the overall effectiveness of the collagenase digestion (Figure 9B). Quantitative measurements using light microscopy (as both hepatocytes and SECs have distinguishing features from other cells) show that in a representative preparation, hepatocytes are nearly 100% pure and SECs are just over 89% pure (Table 1). Alternatively, a higher enrichment of SECs may be obtained by magnetic column separation after the PVP gradient, although that is beyond the scope of this protocol. More information about magnetic separation of SECs and KCs may be found in Meyer et al.9 and Liu et al.14 It should be remembered that viability of hepatocytes rapidly decreases in an insufficiently digested liver, but this is not necessary true for the NPCs. Insufficiently digested livers also produce more cellular debris, which is not entirely eliminated in the centrifugation steps.
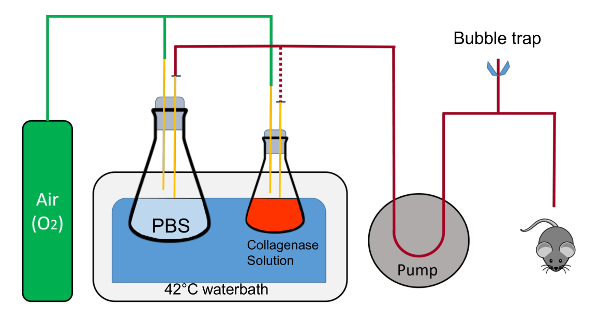
Figure 1: Schematic representation of the perfusion suite. The flasks are held in place by clamps (not shown); the tubing containing fluid is swapped from the 1L flask to the 125 mL flask during the procedure is represented by the red dotted line. Note, that the oxygen feed does not bubble directly into the solutions in the flasks. The corks should also be notched to allow a closed-circuit fluid flow with the tubing inserted within the notch. This is critical during warm-up of the tubing and for ejection of all air within the tubing. The air bleed is composed of the T-connector which is connected to Tygon tubing and pinch clamps for quick open and closure of the system. Please click here to view a larger version of this figure.
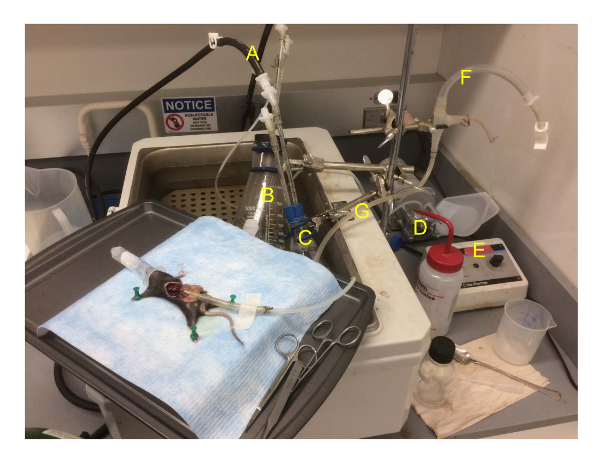
Figure 2: The perfusion suite during mouse liver perfusion. The tray with the mouse is placed on the corner of the water bath. The oxygen is disconnected from the collagenase solution as that was already oxygenated during the warm-up. Location of items are A) oxygen lines, B) 1 L flask containing PBS, C) 125 mL flask containing buffer 2 with collagenase, D) pump, E) pump controls, F) bubble trap, G) fluid line running from the flask, through the pump and to the mouse. Please click here to view a larger version of this figure.
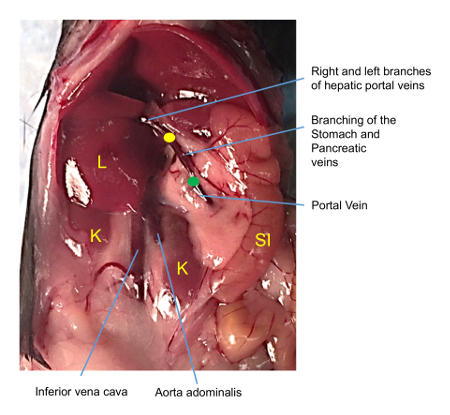
Figure 3: Image of the vasculature of the mouse abdomen. Insertion of the catheter should be just below the gastric and pancreatic vein junctions coming off the portal vein (green dot) and the tip should be placed near the left and right hepatic portal veins (yellow dot) which forms a fork into the main lobes of the liver. Once correct placement is achieved, the catheter should be stabilized with thread using a simple overhand knot. K = kidney, L = liver, SI = small intestine. Please click here to view a larger version of this figure.
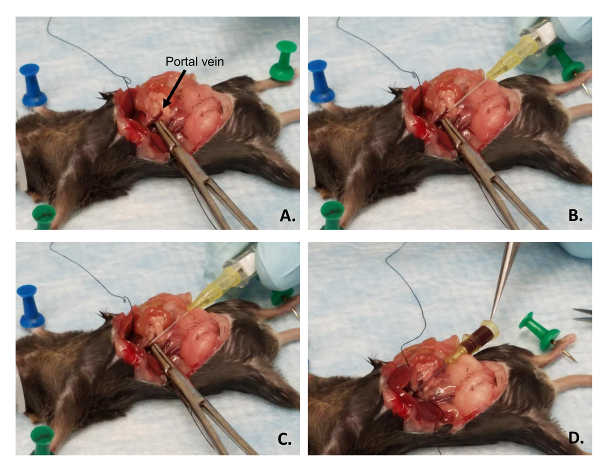
Figure 4: Catheter placement in the portal vein. (A) The forceps are used to ensure blood engorgement of the portal vein and to straighten out the vein for catheter placement. (B) The catheter is lined up in parallel with the portal vein with the bevel up. (C) The bevel of the needle within the catheter is inserted into the vein, not through the vein. (D) The needle of the catheter is retracted and blood will backflow through the catheter as indicated by the tip of the forceps. Please click here to view a larger version of this figure.
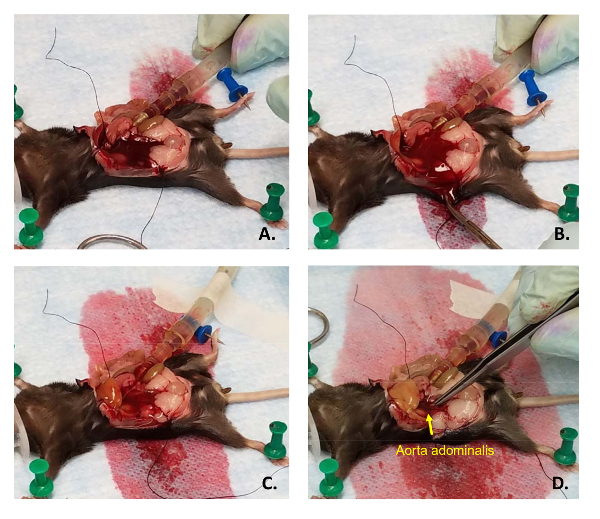
Figure 5: Proper liver perfusion. (A) After catheter placement, the female Luer end of the catheter is connecting to the male Luer end (cut from a 1 mL syringe) of the pump tubing. (B) After cutting one of the major descending blood vessels, blood and PBS are drained from the abdomen by slicing the side of mouse with scissors. (C) The liver should blanch while the blood is flushed out and (D) will swell when under pressure by squeezing shut the cut blood vessel with forceps. Please click here to view a larger version of this figure.
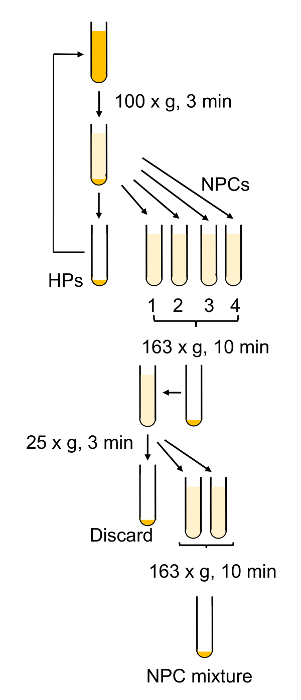
Figure 6: Schematic outline of hepatocyte purification and NPC isolation. Most of the centrifugation steps aim to remove live and dead hepatocytes from the non-parenchymal cells. Please click here to view a larger version of this figure.
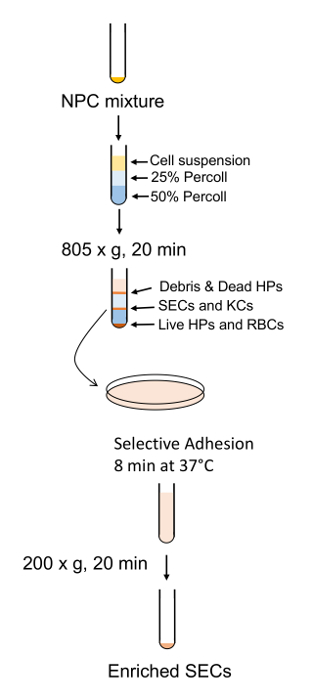
Figure 7: Schematic outline of SEC enrichment and purification. NPCs are separated by the PVP gradient followed by SEC separation by short adhesion to a standard polystyrene plate. Please click here to view a larger version of this figure.
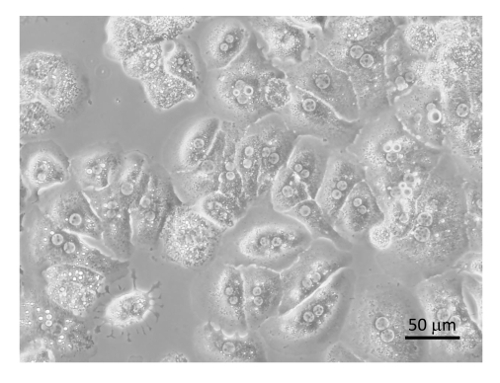
Figure 8: Purified hepatocytes. Hepatocytes were plated on collagen coated tissue culture plates with DMEM + 8% FBS + Pen/Strep and incubated for 6 h followed by image collection by a microscope at 400X. Bar equals 20 µm. Please click here to view a larger version of this figure.
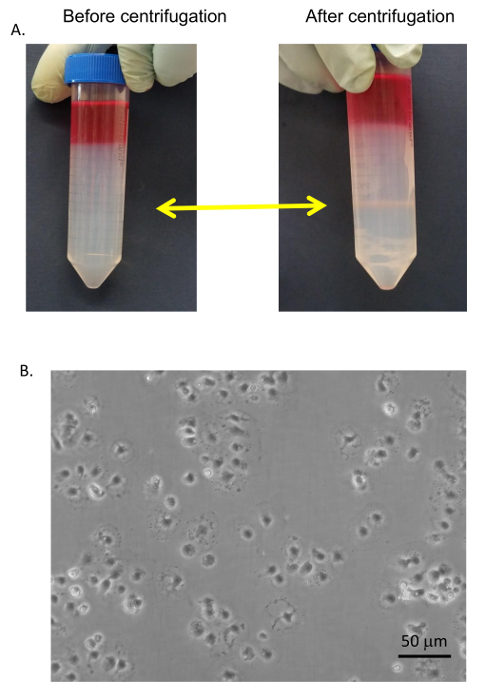
Figure 9: SEC purification. (A) SECs and KCs were collected from the 25/50% PVP interface (yellow arrows) and washed with serum-free medium. (B) The SECs were separated from the KCs by selective adhesion on standard Petri dishes, washed, and plated on collagen-coated tissue culture dishes in RPMI + 5% FBS. Images were taken by an EVOS inverted microscope at 400X. Bar equals 20 µm. Please click here to view a larger version of this figure.
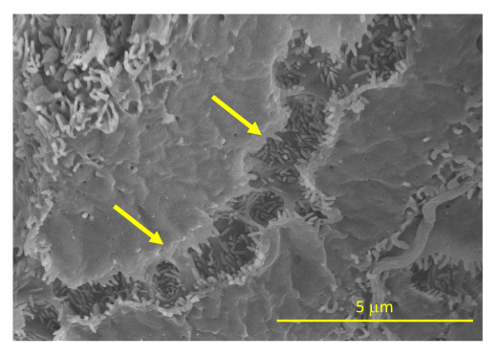
Figure 10: Scanning electron microscopy of mouse liver anatomy. A mouse liver was perfused with PBS followed by fixative (100 mM sodium cacodylate, 12 mL 25% glutaraldehyde, 15.6 mL 16% paraformaldehyde, 2.65 mM calcium chloride, 180.2 mM sucrose, mixed in 100 mL solution) at a rate of 1 mL/min for 4 min. Tissues were sliced and prepared for scanning electron microscopy. Images were collected on a Field Emission SEM at 10,000X. Yellow arrows indicate the microvilli between the hepatocytes. Bar equals 5 µm. Please click here to view a larger version of this figure.
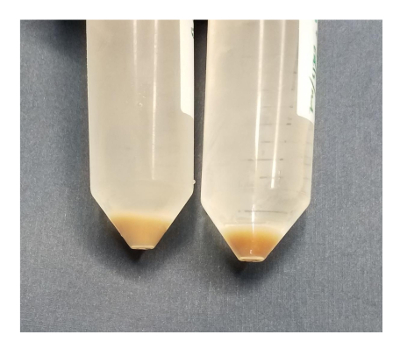
Figure 11: Visualization of dead versus live hepatocytes. After 2 washes with Buffer 1, pelleted hepatocytes may be assessed for live/dead ratio by eye. A lighter pellet (left) indicates that at least half the hepatocytes are dead. The darker pellet on the right is more firmly pelleted to the bottom of the tube and is more than 90% live. Please click here to view a larger version of this figure.
| Table 1: Cell purification | ||
| Cell Type | % target cells | % other cells |
| Hepatocytes | 99 | 1 |
| Sinsusoidal endothelial cells | 89.1 | 10.9 |
Table 1: Assessment of cell purity by light microscopy.
Discussion
This protocol highlights the tools that are available and that will afford the user a high rate of success in this procedure. A successful perfusion is fundamental for any downstream application when working with primary cells.
There are a few critical steps of the procedure that determine success. First, placement of the catheter tip within the portal vein must be correct. If placed too far inside the liver, only the minor lobes will be perfused. The tip should be just below the right and left branches of the portal vein. The advantage of using a polymer-composite catheter over a needle is that the barb of the needle is more likely to tear the vein during the perfusion than a catheter. Second, the collagenase quality and quantity determine the digestion efficiency of the liver. In this procedure, pre-qualified collagenase Type 4 was used and it is resuspended at 0.5 mg/mL in Buffer 2 if the collagenase activity to be assayed is greater than 900 IU.
At the end of the collagenase perfusion, the liver should retain a somewhat dark tan to brown color. If it is a light tan color, then most of the hepatocytes are dead. The liver should be falling apart when cut from the mouse. In the best conditions, the liver may be scooped out of the body cavity of the mouse with a small spoon. Livers in this condition always give very high cell viability. If it takes much effort to shake the cells apart, if the liver is still firm during extraction, or if there is a lot of force required to move the hepatocytes through the filters, then the hepatocytes will have a lower viability. Hepatocytes are covered with microvilli, which allows them to have a very high surface area (Figure 10). Incomplete digestion retains cell-cell junctions between hepatocytes, and mechanical shearing will tear the plasma membrane apart. In situ perfusion with collagenase is the best method to break apart the cells and maintain high viability. In Figure 11, two hepatocyte preparations are made in which the cell pellets were compared after a few washes in Buffer 1. The pellet on the left is lighter and contains a cell viability of about 50%. The pellet on the right is darker and has a viability of 92%. Similarly, when the liquid is poured from the 50 mL conical, the darker pellet is stationary within the tube, in contrast to the lighter pellet, which will slide in the tube as the liquid is poured off. Lower cell viability or inefficient perfusions may occur when the liver has high levels of sclerosis.
Since live hepatocytes have a higher density than dead hepatocytes, the centrifugation procedures will result in a preparation that is highly pure in viable hepatocytes15. If there is a significant amount of dead hepatocytes (which often occurs when conditions are suboptimal), live cells may be further enriched and separated from dead cells using PVP gradients. Additionally, since live hepatocytes pellet faster than dead hepatocytes, aspiration of the top 3rd of the pellet will also increase the ratio of live to dead cells in the pellet. These procedures are quick and easy methods to separate live from dead hepatocytes and cell debris when needed10,16. This is particularly useful if the sample is precious, and only a few million cells are required for the experiment.
In conclusion, this is an easy and efficient method for harvesting hepatocytes and SECs from the liver. At current prices, the cost of performing this procedure including all reagents and disposables is under 75 USD per preparation. If multiple mice are desired, it is best to proceed with the hepatocyte purification and keep the NPC fraction on ice until all the mice have been processed. NPCs are generally stable on ice for at least 5 h, but longer times have not been tested in this laboratory.
Disclosures
The authors have nothing to disclose.
Acknowledgements
Funding is provided in part by the NIH from grant R01HL130864.
Materials
| Name | Company | Catalog Number | Comments |
|---|---|---|---|
| 1 L Erlenmeyer flask | Fisher Scientific | S63274 | |
| 250 mL Erlenmeyer flask | Fisher Scientific | S63271 | |
| silicone tubing | Cole-Parmer | 96400-14 | This tubing runs from the flasks through the pump to the T connector and then to the 1.0 mL syringe that is connected to the catheter. |
| Tygon tubing | Fisher Scientific | R3603 | Used as an adaptor between 96400-14 and pipettes and T connector. This may also be used for the oxygen tubing. |
| T-connectors | Cole-Parmer | EW-06294-82 | |
| Quick dissconnects | Fisher Scientific | 6150-0010 | |
| Pinch Clamps | Fisher Scientific | 6165-0002 | |
| Masterflex L/S Variable speed Pump, model 7553-70 | Cole-Parmer | EW-07559-00 | Periplastic pump with variable speed |
| Pump head, model 7014-20 | Cole-Parmer | EW-07014-20 | |
| glass graduated 1.0 mL pipettes | Fisher Scientific | 13-678 | |
| curved non-serrated scissors | Fine Science Tools | 14069-12 | |
| Dumont forceps | Fine Science Tools | 11252-20 | |
| Curved forceps | Fine Science Tools | 13009-12 | |
| 10 mL syringe | Fisher Scientific | 03-377-23 | Only barrel of syringe will be needed |
| sterlized spoon | Home supply store | ||
| Cotton ball(s) | Home supply store | ||
| Polyester sewing thread | Home supply store | ||
| Masking tape | Home supply store | ||
| thumb tacks | Home supply store | ||
| styrofoam pad | 50 mL conical rack | ||
| cookie/baking sheet | Home supply store | ||
| Absorbant underpads | Fisher Scientific | 14-206-64 | |
| 19 L water bath | Fisher Scientific | TSCOL19 | |
| BD Insyte Autogaurd Shielded IV Catheter 24 guage | Becton Dickinson | 381412 | Plastic cathetar with retractable needle |
| Crystallizing dishes 100x50 | VWR | 89000-290 | |
| Polystyrene petri dishes | Sigma Aldrich | P5481-500EA | |
| 50 mL conical tubes | Fisher Scientific | 12-565-270 | |
| graduated pipettes (5 mL) | Fisher Scientific | 170355 | |
| graduated pipettes (25 mL) | Fisher Scientific | 170357 | |
| EasyStrainer 100 μM | Greiner bio-one | 542000 | 100 μm filter |
| EasyStrainer 40 μM | Greiner bio-one | 542040 | 40μm filter |
| Sterile transfer pipettes | Fisher Scientific | 13-711-20 | |
| Refrigerated swinging bucket centrifuge | Sorvall Legend XTR | 75-217-406 | Centrifuge with swinging bucket rotar |
| Galaxy 170R tissue culture incubator | Eppendorf | CO170R-120-0000 | Humidified tissue culture incubator |
| Reagents | |||
| Name | Compound | Grams (g/L) | Millimolar (mM) |
| Buffer 1, pH 7.4 | NaCl | 8.3 | 142 |
| KCl | 0.5 | 6.7 | |
| HEPES | 2.4 | 10 | |
| BSA | 15 | 0.226 | |
| Buffer 2, pH 7.4 | NaCl | 3.9 | 66.74 |
| KCl | 0.5 | 6.71 | |
| CaCl2 | 0.7 | 6.31 | |
| HEPES | 24 | 100 | |
| BSA | 15 | 0.226 | |
| Phenol Red | 0.01 | 0.03 | |
| Buffer 3, pH 7.4 | NaCl | 8 | 137 |
| KCl | 0.35 | 4.7 | |
| MgSO4 | 0.08 | 0.66 | |
| CaCl2 | 0.18 | 1.62 | |
| HEPES | 2.4 | 10 | |
| BSA | 15 | 0.226 | |
| PBS, pH 7.4 | NaCl | 8 | 137 |
| KCl | 0.2 | 2.7 | |
| Na2HPO4-7H2O | 1.15 | 4.3 | |
| KH2PO4 | 0.2 | 1.4 | |
| Other reagents | |||
| Name | Company | Catalog Number | Comments |
| Percoll (PVP solution) | GE Healthcare | 288555 | |
| Collagenase Type IV | Sigma Aldrich | C5138 | |
| Isoflurane | Abcam | ab144581 | |
| Hepatocyte Growth Medium | |||
| DMEM | Gibco | 11965118 | |
| 10% by volume fetal bovine serum | Gibco | 10437010 | |
| Pen/Strep (2x) | Gibco | 15140148 | |
| Long-term Hepatocyte Growth Medium | |||
| DMEM | |||
| 10% by volume fetal bovine serum | Gibco | 10437010 | |
| Pen/Strep (2x) | Gibco | 15140148 | |
| Glucagon | Sigma | G3157-2mg | 14 ng/mL |
| Insulin | Sigma | I9278-5mL | 0.5 U/mL |
| Hydrocortisone | Sigma | H0888-1g | 7.5 mg/mL |
| Epidermal Growth Factor | BD Biosciences | 354001-100ug | 20 ng/mL |
| LSEC medium | |||
| RPMI | Gibco | 11875119 | |
| 10% by volume fetal bovine serum | Gibco | 10437010 | |
| Pen/Strep (2x) | Gibco | 15140148 |
References
- Berry, M. N., Friend, D. S. High-yield preparation of isolated rat liver parenchymal cells: a biochemical and fine structural study. J Cell Biol. 43 (3), 506-520 (1969).
- Seglen, P. O. Preparation of isolated rat liver cells. Methods Cell Biol. 13, 29-83 (1976).
- Miller, L. L., Bly, C. G., Watson, M. L., Bale, W. F. The dominant role of the liver in plasma protein synthesis; a direct study of the isolated perfused rat liver with the aid of lysine-epsilon-C14. J Exp Med. 94 (5), 431-453 (1951).
- Edstrom, S., Ekman, L., Ternell, M., Lundholm, K. Isolation of mouse liver cells: perfusion technique and metabolic evaluation. Eur Surg Res. 15 (2), 97-102 (1983).
- Meyer, J., Gonelle-Gispert, C., Morel, P., Buhler, L. Methods for Isolation and Purification of Murine Liver Sinusoidal Endothelial Cells: A Systematic Review. PLoS One. 11 (3), 0151945(2016).
- Sies, H. The use of perfusion of liver and other organs for the study of microsomal electron-transport and cytochrome P-450 systems. Methods Enzymol. 52, 48-59 (1978).
- Smedsrod, B. Protocol for preparation of mouse liver Kupffer cells and liver sinusoidal endothelial cells. Munin open research archive. , University of Tromsø. 1-10 (2012).
- Smedsrod, B., Pertoft, H., Eggertsen, G., Sundstrom, C. Functional and morphological characterization of cultures of Kupffer cells and liver endothelial cells prepared by means of density separation in Percoll, and selective substrate adherence. Cell Tissue Res. 241 (3), 639-649 (1985).
- Meyer, J., Lacotte, S., Morel, P., Gonelle-Gispert, C., Buhler, L. An optimized method for mouse liver sinusoidal endothelial cell isolation. Exp Cell Res. 349 (2), 291-301 (2016).
- Kreamer, B. L., et al. Use of a low-speed, iso-density percoll centrifugation method to increase the viability of isolated rat hepatocyte preparations. In Vitro Cell Dev Biol. 22 (4), 201-211 (1986).
- Meijer, D. K., Keulemans, K., Mulder, G. J. Isolated perfused rat liver technique. Methods Enzymol. 77, 81-94 (1981).
- Gopalakrishnan, S., Harris, E. N. In vivo liver endocytosis followed by purification of liver cells by liver perfusion. J Vis Exp. (57), e3138(2011).
- Cook, M. J. The Anatomy of the Laboratory Mouse. , Academic Press. 2008 edn (1965).
- Liu, J., et al. Advanced Method for Isolation of Mouse Hepatocytes Liver Sinusoidal Endothelial Cells, and Kupffer Cells. Methods Mol Biol. 1540, 249-258 (2017).
- Knobeloch, D. E., Ehnert, S., Schyschka, L., Buchler, P., Schoenberg, M., Kleeff, J., Thasler, W. E., Nussler, N. C., Godoy, P., Hengstler, J., Nussler, A. K. Human Hepatocytes: Isolation, Culture, and Quality Procedures. Methods in Molecular Biology. 806, 99-120 (2012).
- Clarke, B. L., Weigel, P. H. Recycling of the asialoglycoprotein receptor in isolated rat hepatocytes. ATP depletion blocks receptor recycling but not a single round of endocytosis. J Biol Chem. 260 (1), 128-133 (1985).
Reprints and Permissions
