

Summary
Synthetic biology enables the engineering of proteins with unprecedented properties using the co-translational insertion of non-canonical amino acids. Here, we presented how a spectrally red-shifted variant of a GFP-type fluorophore with novel fluorescence spectroscopic properties, termed "gold" fluorescent protein (GdFP), is produced in E. coli via selective pressure incorporation (SPI).
Abstract
Fluorescent proteins are fundamental tools for the life sciences, in particular for fluorescence microscopy of living cells. While wild-type and engineered variants of the green fluorescent protein from Aequorea victoria (avGFP) as well as homologs from other species already cover large parts of the optical spectrum, a spectral gap remains in the near-infrared region, for which avGFP-based fluorophores are not available. Red-shifted fluorescent protein (FP) variants would substantially expand the toolkit for spectral unmixing of multiple molecular species, but the naturally occurring red-shifted FPs derived from corals or sea anemones have lower fluorescence quantum yield and inferior photo-stability compared to the avGFP variants. Further manipulation and possible expansion of the chromophore's conjugated system towards the far-red spectral region is also limited by the repertoire of 20 canonical amino acids prescribed by the genetic code. To overcome these limitations, synthetic biology can achieve further spectral red-shifting via insertion of non-canonical amino acids into the chromophore triad. We describe the application of SPI to engineer avGFP variants with novel spectral properties. Protein expression is performed in a tryptophan-auxotrophic E. coli strain and by supplementing growth media with suitable indole precursors. Inside the cells, these precursors are converted to the corresponding tryptophan analogs and incorporated into proteins by the ribosomal machinery in response to UGG codons. The replacement of Trp-66 in the enhanced "cyan" variant of avGFP (ECFP) by an electron-donating 4-aminotryptophan results in GdFP featuring a 108 nm Stokes shift and a strongly red-shifted emission maximum (574 nm), while being thermodynamically more stable than its predecessor ECFP. Residue-specific incorporation of the non-canonical amino acid is analyzed by mass spectrometry. The spectroscopic properties of GdFP are characterized by time-resolved fluorescence spectroscopy as one of the valuable applications of genetically encoded FPs in life sciences.
Introduction
Since the discovery of the green fluorescent protein in the jellyfish Aequorea victoria (avGFP) in 19621 and the first heterologous expression in 19942 in other eukaryotic cells, fluorescent proteins of the GFP family have become highly valuable tools and targets in life sciences. Extensive genetic and molecular engineering included the adjustment of species-specific codon usage, acceleration of folding, improved maturation, increased brightness, prevention of oligomerization and tailoring of spectral and photochemical properties including the ability to reversibly photoswitch3,4,5,6. GFP owes its fluorescence from its 4-(p-hydroxybenzylidene)imidazolidin-5-one (HBDI) chromophore. The latter is autocatalytically formed from the so-called chromophore triad of amino acids (Ser-65/Tyr-66/Gly-67 in avGFP) after the formation of an additional covalent bond within the peptide backbone under the influence of molecular oxygen7. The resonantly stabilized conjugated system interacts dynamically with its molecular environment, allowing for the absorption in the visible range and characteristic green fluorescence of these proteins.
Within the chromophore triad, the presence of an aromatic amino acid is mandatory. However, the standard amino acid repertoire comprises only four aromatic residues (His, Phe, Trp and Tyr). This limits conventional mutagenesis approaches to achieve substantially more red-shifted avGFP variants relative to the most red-shifted natural FPs such as DsRed8 from Discosoma striata coralimorphs or mKate/mNeptune9 from the sea anemone Entacmaea quadricolor. Therefore, the far-red and near-infrared portion of the optical spectrum above 600 nm is sparsely covered by GFP variants. This is, of course, a severe limitation for fluorescence microscopic approaches that require spectral demultiplexing of several fluorophore species at the same time. For example, long-wavelength markers are also necessary to make use of the low absorption regime of skin tissue between 700-1,000 nm in settings for deep tissue imaging10.
Fluorescent proteins derived from avGFP are divided into several classes based on the spectroscopic properties and chemical nature of their chromophores11. With its triad Ser-65/Tyr-66/Gly-67, the wild-type chromophore exists as an equilibrated mixture between the neutral, phenolic form (λmax = 395 nm, ε = 21,000 M-1cm-1) and the anionic phenolate form (λmax = 475 nm, ε = 7,100 M-1cm-1), and the emission spectrum exhibits a single peak at 508 nm. The hydroxyl group of Ser-65 is of critical importance, as it donates an H-bond to Glu-222 in the chromophore vicinity (distance: 3.7 Å), which promotes the ionization of this carboxylate. Class I is characterized by an anionic phenolate chromophore, as in EGFP (Phe-64-Leu/Ser-65-Thr; λmax = 488 nm, ε = 35,600 M-1cm-1, λem = 509 nm). Due to the Ser-65-Thr(Ala,Gly) substitution, the 395 nm excitation peak of the neutral phenol form is suppressed and the 470-475 nm peak of the anionic phenolate is five- to six-fold enhanced and shifted to 490 nm. Class II comprises proteins with a neutral phenolic chromophore, as in sapphire-GFP. Here, the Thr-203-Ile substitution almost completely suppresses the 475 nm excitation, leaving only the peak at 399 nm. Since the anionic chromophore cannot be properly solvated, its neutral form is favored. Class III comprises the "yellow" fluorescent variants (EYFP; Ser-65-Gly/Val-68-Leu/Ser-72-Ala/Thr-203-Tyr; λmax ε = 514 nm, ε=84,600 M-1cm-1, λem = 527 nm) with π-stacking interaction of an aromatic side chain and the phenolate, as brought about by the Thr-203-His(Trp,Phe,Tyr) substitutions, which lead to up to 20 nm red-shifted emission maxima (Thr-203-Tyr). Further substitution (Gln-69-Lys) results in another 1-2 nm red shift to 529 nm, the most red-shifted avGFP variant known11. The exchange of the phenol for an indole (Tyr-66-Trp) creates class IV, as in the cyan-fluorescent ECFP (Ser-65-Thr/Tyr-66-Trp; λmax1 = 434 nm, ε = 24,800 M-1cm-1; λmax2 = 452 nm, ε = 23,600 M-1cm-1; λem1 = 477 nm, λem2 = 504 nm). The accommodation of the bulky indole is probably enabled by other, compensatory mutations. The ECFP excitation and emission maxima fall inbetween those of proteins with neutral or anionic chromophores. Class V proteins harbor an imidazole in place of the phenol (Tyr-66-His), e.g., blue-fluorescent proteins like EBFP. Class VI is produced by a phenol-to-phenyl exchange favoring the neutral chromophore form exclusively, which consequently leads to the most blue-shifted excitation and emission peak positions (360 nm and 442 nm, respectively).
Classical site-directed mutagenesis is especially suitable for the production of novel avGFP chromophore variants, by the permutation of the 65-67 tripeptide and interacting residues in the frame of the 20 canonical amino acids. These possibilities can be further expanded when non-canonical variants of aromatic amino acids are introduced during ribosomal protein synthesis12. In principle, there are two ways to accomplish this. The first strategy relies on the substrate tolerance of the protein translation machinery, especially of aminoacyl-tRNA synthetases (aaRSs) towards related amino acid analogs. To achieve this with high efficiency, auxotrophic E. coli expression strains are employed that are unable to synthesize the corresponding natural amino acid. This allows the replacement of the latter by adding suitable non-canonical amino acids (ncAAs) or precursors thereof to the culture medium. This strategy, also known as Selective Pressure Incorporation (SPI)13,14, enables residue-specific replacements, which result in global incorporation of the ncAA. The second strategy uses stop codon suppressor tRNAs which are charged with the ncAA by engineered aaRS enzymes. This results in the readthrough of in-frame stop codons and allows site-specific ncAA incorporation. Consequently, this method of stop codon suppression (SCS) leads to the expansion of the genetic code15. Via mutagenesis, a stop codon is placed into the target gene at the desired site. In principle, SPI can also be used to create recombinant peptides and proteins bearing a unique ncAA installation, given that rare canonical amino acids such as Met or Trp are chosen for substitution. With Trp, SPI approaches have been shown to work with a large variety of analogs including 4-F-, 5-F- and 6-F-Trp, 7-aza-Trp, 4-OH- and 5-OH-Trp, as well as 4-, and 5-NH2-Trp or even β(thienopyrrolyl)alanine derivatives16,17,18,19,20. Thus, SPI could be highly advantageous for replacing aromatic amino acids of GFP chromophores by non-canonical variants to explore the possibility to further tailor spectra and Stokes shift of these FPs. As for all protein sequence modifications, the compatibility with FP folding and chromophore maturation must be tested experimentally.
In this work, we utilize class IV ECFP21, which carries instead of the wild-type avGFP Tyr, a Trp residue within its chromophore triad. Using SPI, this Trp-66 (and Trp-57, the only other Trp residue in ECFP) is substituted by 4-amino-Trp. The presence of the electron-donating amino group of 4-amino-Trp within the chromophore favors the resonance stabilization of a far red-shifted excited state proton transfer (ESPT) endowed with a 108 nm Stokes shift. This "gold" fluorescent protein (GdFP) constitutes the variant with the largest red shift of the fluorescence maximum (574 nm) among all avGFP-derived proteins. We describe the method of GdFP protein production by SPI and provide the protocols for the mandatory analysis of the resulting modified proteins by mass spectroscopy. Further, we show how GdFP can be utilized and analyzed in time-resolved fluorescence spectroscopy approaches.
Protocol
1. Transformation of Trp-auxotrophic E. coli
- Transform chemically or electrocompetent cells (50 µL) of a Trp-auxotrophic E. coli strain, e.g. ATTC 49980 (WP2, mutant derived from E. coli strain B/R22), with 1 µL of a 1 ng/µL aqueous solution of the pQE-80L His6-ECFP plasmid using heat shock or electroporation, respectively. Please refer to the JoVE Science Education Database23,24 for details.
NOTE: The expression vector pQE-80L His6-ECFP encodes an N-terminally 6x His-tagged ECFP21 driven by a bacterial T5 promoter with lac operator. It further carries an AmpR selection marker and a colE1 origin of replication (the pQE-80L vector backbone sequence can be found on: https://www.qiagen.com/mx/resources/resourcedetail?id=c3b71572-4d82-4671-a79b-96357fe926d1&lang=en&autoSuggest=true). The theoretical molecular weight of the His6-ECFG wild-type protein (after chromophore maturation25) is 28303.92 Da. The translated target protein sequence is as follows (His-tag underlined, vector-derived sequences in bold): MRGSHHHHHHGSMVSKGEELFTGVVPILVELDGDVNGHKFSVSGEGEGDATYGKLTLKFICTTGKLPVPWPTLVTTLTWGVQCFSRYPDHMK
QHDFFKSAMPEGYVQERTIFFKDDGNYKTRAEVKFEGDTLVNRIELKGIDFKEDGNILGHKLEYNYISHNVYITADKQKNGIKANFKIRHNIEDGS
VQLADHYQQNTPIGDGPVLLPDNHYLSTQSALSKDPNEKRDHMVLLEFVTAAGITLGMDELYK. - Plate transformed cells on LB-agar plates (Table 1) supplemented with 10 g/L glucose, 100 µg/mL ampicillin and incubate the plates at 37 °C overnight.
2. Recombinant Protein Expression
- Overnight culture of E. coli ATCC 49980 pQE-80L His6-ECFP
- Prepare 5 mL of LB medium (Table 1; supplemented with 10 g/L glucose, 100 µg/mL ampicillin) in a sterile 14 mL polystyrene culture tube for aerobic growth and inoculate with a singly colony from an agar plate using a sterile pipette tip or inoculation loop.
NOTE: Using colonies from freshly transformed cells is recommended. The plates with bacterial colonies (from step 1.2.) can be stored at 4 °C for several days. - Incubate the cells at 37 °C in an orbital shaker at 200-250 rpm overnight.
- Prepare 5 mL of LB medium (Table 1; supplemented with 10 g/L glucose, 100 µg/mL ampicillin) in a sterile 14 mL polystyrene culture tube for aerobic growth and inoculate with a singly colony from an agar plate using a sterile pipette tip or inoculation loop.
- Expression of wild-type ECFP
- Inoculate 10 mL fresh LB medium (Table 1; supplemented with 10 g/L glucose, 100 µg/mL ampicillin) with 100 µL of the overnight culture in a 100 mL Erlenmeyer flask. Incubate the flask at 37 °C in an orbital shaker at 200 rpm.
NOTE: Optionally, this step can be performed in 10 mL NMM19 medium (Table 1) supplemented with 100 µg/L ampicillin and 0.5 mM L-tryptophan (alternatively, indole can be used). - Measure the optical density at 600 nm (OD600) every 20 min. Preferentially measure cell density by determining the extinction at 600 nm (OD600) in a spectrophotometer using a cuvette with a path length of 1 cm. Always perform a reference measurement using the corresponding culture medium. Dilute the samples and mix the samples well to obtain a measurement value of 0.1-0.8, then calculate OD600 using the dilution factor. For details, please refer to previous publication 26.
- Upon reaching an OD600 value of 0.5-0.8 (approximately 2-3 h after the inoculation), take sample "before induction" for SDS-PAGE (sodium dodecyl sulfate polyacrylamide gel electrophoresis, step 4).
- Induce target protein expression by adjusting the liquid culture to 0.5 mM IPTG (isopropyl β-D-1-thiogalactopyranoside, from 1 M stock solution) and incubate it at 30 °C in an orbital shaker at 200 rpm for 4-8 h.
NOTE: Cyan fluorescent proteins are commonly expressed at temperatures below 37 °C27. - Take sample "after expression" for SDS-PAGE (step 4.).
- Harvest the bacterial cells by centrifugation for 10 min at 5,000 x g and 4 °C.
- Discard the supernatant by decanting and freeze the cell pellets at -20 °C or -80 °C until target protein purification.
- Inoculate 10 mL fresh LB medium (Table 1; supplemented with 10 g/L glucose, 100 µg/mL ampicillin) with 100 µL of the overnight culture in a 100 mL Erlenmeyer flask. Incubate the flask at 37 °C in an orbital shaker at 200 rpm.
- SPI for producing GdFP
- Inoculate 10 mL of NMM19 medium (Table 1) supplemented with 100 µg/mL ampicillin, 15 µM tryptophan and 10 µL of overnight culture in a 100 mL Erlenmeyer flask and incubate the culture flask overnight at 30 °C in an orbital shaker at 200 rpm.
NOTE: A variety of chemically defined media for cultivation of E. coli and SPI is available. In addition to NMM used herein, MOPS medium28, glucose-mineral salts medium29, Davis minimal medium30, M9 minimal medium31, or GMML32 can be used. - The next day, measure OD600 every 30 min until the value only changes by less than 0.05 over 30 min. The plateau value should be approximately 1.
NOTE: Deviations by ± 0.3 units are acceptable. Depending on the bacterial strain and medium used, the initial tryptophan concentration (step. 2.3.1) may need adjustment. - Take sample "before induction" for SDS-PAGE (step 4.).
- Harvest the bacterial cells by centrifugation for 10 min at 5,000 x g and 4 °C. Discard the supernatant by decanting.
- Resuspend the cells in 10 mL of NMM19 medium with 100 µg/mL ampicillin into a 100 mL Erlenmeyer flask and add 4-amino-indole to a final concentration of 1 mM using 50 mM stock solution. Continue the incubation for 30 min at 30 °C in an orbital shaker at 200 rpm.
NOTE: This step is recommended because of the low chemical stability of ampicillin and ensures cellular uptake of 4-amino-indole. - Induce target protein expression by adding IPTG to a final concentration of 0.5 mM using 1 M stock and incubate the sample overnight at 30 °C in an orbital shaker at 200 rpm.
NOTE: Cyan fluorescent proteins are commonly expressed at temperatures below 37 °C27. - The next day, measure OD600.
- Take sample "after expression" for SDS-PAGE (step 4.).
- Harvest the bacterial cells by centrifugation for 10 min at 5,000 x g and 4 °C and discard supernatant by decanting.
- In case such a vessel was not used for centrifugation, transfer the cell pellet into a 50 mL conical polystyrene tube using a spatula. Freeze the cell pellet at -20 °C or -80 °C until target protein purification.
- Inoculate 10 mL of NMM19 medium (Table 1) supplemented with 100 µg/mL ampicillin, 15 µM tryptophan and 10 µL of overnight culture in a 100 mL Erlenmeyer flask and incubate the culture flask overnight at 30 °C in an orbital shaker at 200 rpm.
3. Target Protein Purification via Immobilized Metal Ion Affinity Chromatography (IMAC)
- Bacterial cell lysis
- Thaw the cell pellet on ice for 10-20 min.
- Resuspend the cell pellet in a 50 mL conical polystyrene tube using 5 mL of ice-cold binding buffer (Table 1) on ice.
- Add 20 µL of 50 mg/mL lysozyme, 20 µL of 1 mg/mL DNase I, and 20 µL of 1 mg/mL RNase A. Close the tube, mix gently by inverting 5 times, and keep it on ice for 30 min.
NOTE: Partial cell disruption occurs as catalyzed by lysozyme. - Lyse the cells by sonification using an ultrasound homogenizer tip using three cycles of 3 min in a 15 mL polystyrene tube cooled by slush ice with 2 s of pulse, 4 s of pause and 45% amplitude.
NOTE: Alternatively, high pressure homogenization can be used, e.g., 20 cycles at 14,000 psi. If necessary, dilute using binding buffer to reach the minimal instrument volume. Moreover, protein extraction reagents can be used for cell disruption. See Materials table for examples. - Centrifuge the sample for 30 min at 15,000-18,000 x g, 4 °C.
- Transfer the supernatant into a fresh tube and note down the liquid volume.
- Filter the solution through a 0.45 µm syringe filter using a 5 mL plastic Luer lock syringe and a polyvinylidene fluoride (PVDF) syringe filter.
- Take sample "lysate" for SDS-PAGE (step 4.).
- Resuspend cell debris pellet in ddH2O (equal volume as former lysate).
- Take sample "pellet" for SDS-PAGE (step 4.).
- IMAC purification
- Use a 1 mL prepacked or self-packed IMAC FPLC (fast protein liquid chromatography) column according to manufacturer’s instructions. Use binding buffer (Table 1) for column equilibration as well as for the wash step which follows after the cell lysate has been applied to the column.
- Collect and pool eluate fractions with GdFP which can be identified by visible light golden color.
NOTE: Optionally, the target protein can be eluted using a linear imidazole gradient (0-250 mM) using an automated FPLC system. - Determine the protein concentration using the literature value for the extinction coefficient at 466 nm (ɛ466 nm = 23,700 M-1 cm-1)33 with elution buffer as reference. For details on the procedure, please refer to previous publication26.
- Take sample "eluate" for SDS-PAGE, and use 1-10 µg of protein per lane in case of Coomassie-staining.
NOTE: SDS sample amounts can vary depending on the staining method and dye sensitivity. - Dialyze an aliquot of the eluate fractions against dialysis buffer or MS buffer using a membrane with a molecular weight cutoff (MWCO) of 5,000-10,000. Prepare dialysis membrane according to manufacturer's instructions. Dialyze a 1 mL sample three times against 100 mL buffer for at least 2 h. For details on this procedure, please refer to previous publication34.
- For storage, freeze protein sample in dialysis buffer at -80 °C.
NOTE: Aliquots should be stable for at least 6 months.
4. SDS-PAGE Sample Preparation of E. coli Whole Cell Extract
- Transfer a cell suspension equivalent to 1 mL of OD600 = 1 suspension (e.g. 500 µL of OD600=2) into a 1.5 mL microcentrifuge tube.
- Harvest the cells by centrifugation for 10 min at 5000 x g, room temperature. Discard the supernatant by pipetting.
- Add 80 µL of ddH2O and 20 µL of 5x SDS loading dye buffer (Table 1) to the cell pellet and mix by pipetting.
- Denature the cells by heating to 95 °C for 5 min in a water bath or heat block. Subsequently, cool the samples to room temperature.
- Use 10 µL for Coomassie-stained SDS-PAGE according to previous publication35.
NOTE: SDS sample amounts can vary depending on the staining method and dye sensitivity.
5. Intact Protein Mass Analysis by High-performance Liquid Chromatography (HPLC) Coupled to Electrospray Ionization Time-of-flight Mass Spectrometry (LC-ESI-TOF-MS)
NOTE: HPLC gradient, settings and buffers may vary depending on the separation column and instrument used. See Materials table for exemplary equipment.
- Determine the protein concentration from a sample dialyzed against MS buffer as described above (step 3.2.3.) using MS buffer (see Materials table) as reference.
- Dilute the protein sample to 0.1 mg/mL using MS buffer for a final volume of 80 µL, mix by careful pipetting, transfer the solution into a MS autosampler vial with glass insert and close it with a cap. Remove air bubbles by flicking the vial.
- Fill a second autosampler vial without glass insert (buffer blank) with 1 mL of MS buffer.
- Allow the instrument to warm up. Perform instrument calibration. Make sure that sufficient amounts of liquid chromatography-grade solvents are available (>100 mL).
- Program a linear 20 min HPLC gradient from 5% to 80% buffer A (0.1 % formic acid in ddH2O), combined with buffer B (0.1 % formic acid in acetonitrile).
- Start HPLC at a flow of 0.3 mL/min and wait until the column pressure is stable.
- Set an autosampler injection volume of 5 µL for the LC-ESI-TOF-MS method, create a worklist for a blank run followed by a sample run and assign the corresponding autosampler vial positions. Run the worklist.
- After worklist completion, open the generated sample data file. Select a range in the total ion current (TIC) plot for deconvolution and deconvolute the MS spectrum using the maximum entropy deconvolution algorithm.
NOTE: Depending on experimental conditions, additional species can occur from non-matured FP or buffer ion adducts.
6. Fluorescence Lifetime Measurements and Decay-associated Spectra (DAS) of GdFP
NOTE: For the instrumentation of time-resolved fluorescence spectroscopy, please refer to Table of Materials for exemplary equipment. Absorbance as well as fluorescence excitation and emission spectra of fluorescent proteins can also be recorded using laboratory UV/Vis and fluorescence spectrophotometers.
- Wavelength-resolved fluorescence lifetime measurement of GdFP
- Prepare 2 mL of a 1 µM solution of GdFP by dilution into PBS buffer (Table 1) at pH 7. Fill the solution into a 1 cm quartz cuvette.
- Install ps-pulsed 470 nm laser for sample excitation and the 488 nm long-pass emission filter, and adjust 600 L/mm grating of the time- and wavelength-correlated single photon counting36 (TWCSPC) detector for acquisition of the wavelength regime 500-700 nm.
- Acquire fluorescence emission at a count rate of about 200 x 103 photons/s until about 103 counts are accumulated in the acquisition maximum of the fluorescence decay curves with single photon counting software.
- Measurement of the instrumental response function37 (IRF)
- Replace the sample cuvette with a 1 cm quartz cuvette filled with 1 g/L colloidal silica (~220 m2/g) in PBS buffer at pH 7.
NOTE: The silica suspension is prepared using a 400 g/L aqueous suspension. - Remove 488 nm long-pass emission filter and insert grey filters to adjust the count rate at the TWCSPC detector to below 100 x 103 counts/s.
- Adjust grating for the acquisition of 470 nm photons in channel 8 of the 16-channel TWCSPC detector.
- Acquire the IRF until about 10 x 103 counts are accumulated in the emission maximum.
- Convert fluorescence decay curves and IRF to ASCII data files with global fitting38 program.
- Conduct Global fit according to a model of a sum of three exponential components with lifetimes as linked parameters.
- Plot decay associated spectra (DAS) as amplitude distributions of individual decay components in dependency of the wavelength with data analysis software.
- Replace the sample cuvette with a 1 cm quartz cuvette filled with 1 g/L colloidal silica (~220 m2/g) in PBS buffer at pH 7.
Representative Results
Using the technique of selective pressure incorporation, Trp-66 in the chromophore triad of ECFP (and Trp-57, the only other Trp residue in ECFP) can be replaced by 4-amino-Trp, thereby generating the red-shifted GdFP with distinct spectral properties. Mass spectrometry must be used to demonstrate the desired stoichiometric integration of the non-canonical amino acid into the protein, with results shown in Figure 1. Afterwards, we provide data from microscopy, UV-Vis absorption spectroscopy as well as steady-state and time- and wavelength-resolved fluorescence spectroscopy to characterize the properties of the GdFP fluorophore with a focus on the pH dependence of the spectra.
To confirm the exchange of the two Trp residues in ECFP by 4-amino-Trp, mass spectrometric analysis is carried out. Figure 1 shows a representative deconvoluted ESI-MS spectrum of GdFP. While wild-type ECFP has a calculated protein mass of 28,283.9 Da after the chromophore maturation, the corresponding mass of GdFP is 28,313.9 Da. The deconvoluted ESI-MS spectrum of GdFP exhibits a main mass peak at 28,314.1 ± 0.1 Da, which deviates from the theoretical value by less than 10 ppm. Being within the typical accuracy range for this type of analysis25, this confirms the incorporation of the ncAA via SPI (experimental value for wild-type ECFP: 28,283.7 Da).
Figure 2 shows confocal fluorescence imaging microscopy (CFIM) images of bacterial cells expressing ECFP, EGFP, EYFP and GdFP upon resuspension of bacteria in PBS buffer. All images were acquired on a microscope equipped with a UV objective and laser excitation at about the same energy for each sample.
Figure 3A shows an overlay of CFIM images of E. coli bacteria expressing various FPs including GdFP, always monitored with very similar excitation energy (wavelengths as in Figure 2). Figure 3B shows the chromophore structures of the FP variants shown. Regarding the brightness of GdFP compared to ECFP (fluorescence quantum yield φ = 0.4), EGFP (φ = 0.6) and EYFP (φ = 0.6) it is important to note that for GdFP, a broader acquisition range of the fluorescence light (30 nm) was used in contrast to 20 nm used for all other species, in order to adjust the intensity of the images to similar values. With a slightly lower extinction coefficient and a reduced quantum yield as a consequence of unique photophysical properties, the brightness of GdFP is lower compared to the other FPs shown.
The absorption spectrum of ECFP (Figure 3C) has two characteristic maxima at 434 nm and 452 nm. In contrast, GdFP is characterized by one broad red-shifted absorption band with the maximum at 466 nm. The absorption of EGFP is further red-shifted to 488 nm. However, due to the much larger Stokes shift of GdFP (108 nm) compared to ECFP (41 nm) and EGFP (20 nm), the emission spectrum of GdFP is the most red-shifted of all three GFP derivatives investigated here (Figure 3D). While the fluorescence emission of ECFP shows two characteristic maxima at 475 nm and 505 nm, EGFP has one broad main emission band peaking at 508 nm (λmax) with a slight shoulder at 540 nm. The fluorescence of GdFP appears at about 565 nm (λmax.) (Figure 3D). Its emission spectrum contains a small contribution of wild-type ECFP which is also visible as a small shoulder at 475 nm. This small ECFP fraction is synthesized before induction during the SPI procedure, as described33.
Figure 3E shows the pH-dependent changes in the absorption spectrum of GdFP. For a pH change from 8 to 5, the emission maximum shifts slightly to the red and a slight broadening of the absorption band is observed. However, the reduction of the absorption amplitude is only about 10 % between pH 8 and pH 5, indicating that the ground state properties of the GdFP chromophore are very weakly modified by pH.
The time resolved fluorescence emission monitored by single photon counting is shown in Figure 4. The decay curves monitored in the spectral channels centered at 550 nm and 600 nm (Figure 4A) exhibit a slightly faster fluorescence decay at 600 nm compared to the decay at 550 nm. The results of a global fit of the fluorescence decay curves with two exponential components results in two spectrally distinguishable fluorescence decay components with time constants of 1.0 ns and 3.3 ns (Figure 4C and D).
The fluorescence emission of GdFP strongly depends on pH, as it is typical for many fluorescent protein variants of the GFP family. Figure 4B compares the fluorescence emission of GdFP between pH 5 and pH 8, which clearly shows a decrease in the fluorescence intensity at lower pH, while the spectral characteristics stay constant.
The decay-associated spectra (DAS)39 of GdFP (Figure 4C and D) are characterized by two distinct emission bands. The contribution of the slow 3.3 ns component is more pronounced in the short wavelength range around 550 nm (60 %) with minor contribution of the faster component (40 %). At 600 nm, both components have about the same amplitude. Upon a shift from pH 7 (Figure 4C) to pH 6 (Figure 4D), the spectral characteristics of the DAS hardly change and the time constants from the global fitting routine are also the same (the accuracy of the DAS time constants is about ± 0.15 ns). However, the difference in the absolute amplitudes of the two DAS components is clearly apparent, which fully accounts for the reduced fluorescence emission amplitude upon the same pH shift in Figure 4B.
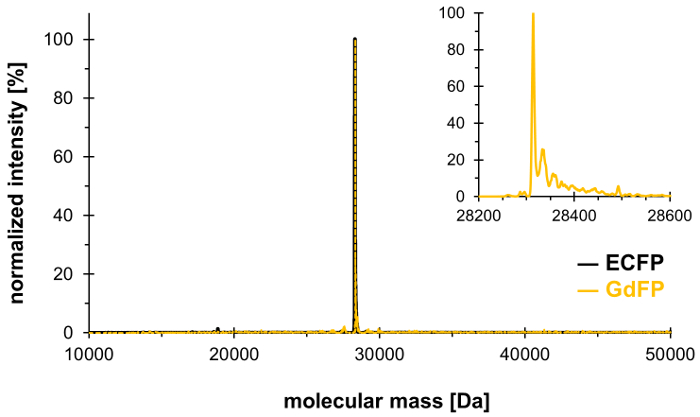
Figure 1: Representative deconvoluted ESI-MS spectrum of GdFP. The ESI-MS spectrum of GdFP (gold color, magnified plot shown as inset) shows a main peak at 28314.1 Da (calculated value 28313.9 Da). The spectrum for wild-type ECFP is shown in black. Please click here to view a larger version of this figure.

Figure 2: Confocal fluorescence microscopy images from bacterial populations expressing various FPs. The following wavelength settings were used for image acquisition: ECFP (λex = 457 nm, detection: 461-480 nm), EGFP (λex = 488 nm, detection: 495-515 nm), GDFP (λex = 476 nm, detection: 560-590 nm), EYFP (λex = 514 nm, detection: 520-530 nm). Please click here to view a larger version of this figure.

Figure 3: Spectral properties of GdFP. (A) CFIM image of a mixture of bacterial cells expressing ECFP, EGFP and GdFP after the resuspension of bacteria in PBS buffer. (B) Chromophore structures of GdFP (with 4-amino-Trp in place of residue 66), the parental ECFP (with Trp at position 66) and EFGP (with Tyr at position 66). (C) Comparison of the normalized absorption spectra of GdFP, ECFP and EGFP, whereas in (D), the normalized fluorescence emission spectrum of ECFP (excitation at 430 nm) is compared to the fluorescence emission spectra of EGFP and GdFP (both excited at 450 nm). (E) pH-dependence of the absorption spectra (normalized absorption at 280 nm). Please click here to view a larger version of this figure.

Figure 4: Time-resolved fluorescence of GdFP. (A) Fluorescence decay of GdFP monitored by time- and wavelength-resolved single photon counting in the spectral channels centered at 550 nm and 600 nm (± 12.5 nm) after excitation with 470 nm laser pulses. The instrumental response function (IRF) provides information about the time resolution of the used setup. (B) Variation of the emission spectrum of GdFP dependent on pH (excitation at 460 nm). (C, D) Decay-associated spectra (DAS) of GdFP at pH 7 (C) and pH 6 (D) determined after deconvolution of time- and wavelength-resolved fluorescence decays and global fitting of the decays in all channels by a global set of two exponential functions with linked time constants. Please click here to view a larger version of this figure.

Figure 5: Structures of the intramolecular charge transfer of ECFP (black) and GdFP (gold) chromophores. The increase in size of the chromophore system by the good electron donor of an amino group as part of the ncAA enables the formation of more mesomeric structures to achieve resonance stabilization of the excited state. The connection points to the FP scaffold are shown as semicircles. Please click here to view a larger version of this figure.
| Stock solution | concentration, solvent | Note | |
| 20% D-glucose | 200 g/L D-glucose in ddH2O | sterilize by filtration through a 0.45 µm pore size syringe filter | |
| indole | 50 mM in isopropanol | ||
| 4-amino-indole | 50 mM in 20 % ethanol (20 mL ethanol in a final volume of 100 mL filled up with ddH2O) | ||
| IPTG | 1 M in ddH2O | ||
| L-tryptophan | 15 mM dissolved in ddH2O using 1 M HCl (add HCl dropwise under stirring until powder is dissoved) | ||
| lysozyme | 50 mg/mL in ddH2O | ||
| DNase I | 1 mg/mL in ddH2O | ||
| RNase A | 1 mg/mL in ddH2O | ||
| Amp100 | 100 mg/mL ampicillin in ddH2O | ||
| sodium-dodecylsulfate (SDS) | 200 g/L in ddH2O | ||
| ammonium sulfate ((NH4)2SO4) | 1 M in ddH2O | sterilize by autoclaving | |
| potassium dihydrogen phosphate (KH2PO4) | 1 M in ddH2O | sterilize by autoclaving | |
| di-potassium hydrogen phosphate (K2HPO4) | 1 M in ddH2O | sterilize by autoclaving | |
| magnesium sulfate (MgSO4) | 1 M in ddH2O | sterilize by autoclaving | |
| D-glucose | 1 M in ddH2O | sterilize by filtration through a 0.45 µm pore size syringe filter | |
| sodium chloride (NaCl) | 5 M in ddH2O | sterilize by autoclaving | |
| calcium chloride (CaCl2) | 1 g/L | sterilize by filtration through a 0.45 µm pore size syringe filter | |
| iron(II) chloride (FeCl2) | 1 g/L | sterilize by filtration through a 0.45 µm pore size syringe filter | |
| thiamine | 10 g/L | sterilize by filtration through a 0.45 µm pore size syringe filter | |
| biotin | 10 g/L | sterilize by filtration through a 0.45 µm pore size syringe filter | |
| trace elements mix | copper sulfate (CuSO4), zinc chloride (ZnCl2), manganese chloride (MnCl2), ammonium molybdate ((NH4)2MoO4); each 1 mg/L in ddH2O | sterilize by filtration through a 0.45 µm pore size syringe filter | |
| 19 amino acids mix | 1.) Dissolve 0.5 g L-phenylalanine and 0.5 g L-tyrosine in 100 ml ddH2O with dropwise addition of 1 M HCl under stirring until powder is dissolved. | ||
| 2.) Weigh out 0.5 g of each of the remaining L-amino acids (except L-tryptophan). Mix with 22 mL fo 1 M KH2PO4 and 48 mL of 1 M K2HPO4. Add ddH2O to about 800 mL. Stir until the solution becomes clear. | |||
| 3.) Add the dissolved L-phenylalanine and L-tyrosine from step 1.) and adjust the volume to 1 L with ddH2O. | |||
| 4.) Sterilize the amino acid mixture by vacuum filtration with a bottle top filter unit. | |||
| Buffers and Media | Composition/Preparation | ||
| SDS loading dye buffer, 5x concentrated | 0.25 M Tris pH 6.8, 50 % v/v glycerol, 0.25 % w/v bromphenol blue, 0.5 M didhiothreitol (DTT; alternatively 5 % β-mercaptoethanol), 10 % w/v sodium-dodecylsulfate (SDS) | ||
| binding buffer | 50 mM sodium dihydrogenphosphate (NaH2PO4), 500 mM NaCl, 10 mM imidazole, pH 8 | ||
| elution buffer | 50 mM sodium dihydrogenphosphate (NaH2PO4), 500 mM NaCl, 250 mM imidazole, pH 8 | ||
| dialysis buffer | 50 mM sodium dihydrogenphosphate (NaH2PO4), 150 mM NaCl, 100 mL/L glycerol, pH 8 | ||
| MS buffer | 10 mM Tris-HCl, pH 8 | ||
| new minimal medium containing 19 L-amino acids except L-tryptophan (NMM19) | Mix all stock solutions to obtain the following final concentrations: 7.5 mM (NH4)2SO4, 1.7 mM NaCl, 22 mM KH2PO4, 50 mM K2HPO4, 1 mM MgSO4, 20 mM D-glucose, 50 mg/L of 19 amino acids mix, 1 µg/L CaCl2, 1 µg/L FeCl2, 10 µg/L thiamine, 10 mg/L biotin, 0.01 mg/L trace elements mix | ||
| LB medium | Composition: 10 g/L tryptone, 5 g/L yeast extract, 10 g/L NaCl, pH 7.0 in ddH2O | ||
| Preparation: | |||
| 1.) Weigh out 50 g tryptone, 25 g yeast extract, 5 g NaCl into a 1 L glass bottle. | |||
| 2.) Add ddH2O up to ~800 mL and dissolve components under stirring. | |||
| 3.) Measure pH and adjust to pH 7 by dropwise addition of 1 M HCl or 1 M NaOH, if necessary. Add ddH2O up to 1 L. | |||
| 4.) Sterilize by autoclaving, check for volume loss afterwards and add sterile ddH2O to compensate if necessary. Store at 4 °C until use. | |||
| LB agar plates | Composition: 10 g/L tryptone, 5 g/L yeast extract, 10 g/L NaCl, 15 g/L agar-agar, pH 7.0 in ddH2O | ||
| Preparation: | |||
| 1.) Weigh out 50 g tryptone, 25 g yeast extract, 5 g NaCl, 7.5 g agar-agar into a 1 L glass bottle. | |||
| 2.) Add ddH2O up to 500 mL and dissolve components under stirring. | |||
| 3.) Measure pH and adjust to pH 7 by dropwise addition of 1 M HCl or 1 M NaOH, if necessary. Add ddH2O up to 1 L. | |||
| 4.) Sterilize by autoclaving, check for volume loss afterwards and add sterile ddH2O to compensate, if necessary. (Note: LB agar can be stored at 4 °C until use for preparation of LB agar plates. Carefully melt solidified agar using a microwave) | |||
| 5.) When the solution is still warm (30-40 °C), add ampicillin to a final concentration of 100 µg/mL | |||
| 6.) Pour about 15 mL of the liquid from step 5.) into a sterile 10 cm Petri dish under sterile conditions. When the agar is solidified, plates can be stored for 1 week at 4 °C until use. | |||
| phosphate-buffered saline (PBS) | Composition: 137 mM NaCl, 2.7 mM KCl, 10 mM Na2HPO4, 1.8 mM KH2PO4, 1 mM CaCl2, 0.5 mM MgCl2, pH 7. Sterilize by autoclaving or filtration. | ||
Table 1: Stock solution and buffer.
Discussion
To achieve very high ncAA incorporation efficiencies, the auxotrophy-based SPI method relies on the use of metabolically engineered host cells, which are not able to synthesize the corresponding natural counterpart of the ncAA. For E. coli, such strains are readily available. Even the simultaneous incorporation of multiple ncAAs into the same protein is feasible using multiauxotrophic strains. The residue-specific mode of replacement and the chemical repertoire being restricted to similar chemical analogs can be seen as drawbacks. Nevertheless, a large number of protein variants can be produced as the natural bacterial translation apparatus tolerates numerous amino acid analogs. For example, more than 50 ncAAs could be incorporated into proteins using in vitro translation, accounting for about 73% of all codons of the genetic code to be available for reassignment40. Furthermore, SPI can also allow efficient multisite labelling of the target protein41. In principle, the SPI methodology is not restricted to E. coli, but can work in any other host and for each of the canonical 20 amino acids, provided that auxotrophic strains and defined cultivation media are available. For example, two methionine analogs, azidohomoalanine (Aha) and homopropargylglycine (Hpg), are commercially available and used for labeling proteins and proteomes in diverse organisms. In addition, Aha can be produced intracellularly and subsequently incorporated into protein42. This ncAA is especially suitable for bioorthogonal conjugations such as click chemistry as developed by Tirrel and coworkers: For example, in plant tissue of Arabidopsis thaliana, in Bombyx mori larvae43, Drosophila cells44, larval zebrafish45 as well as mammalian cells including neurons46, proteins can be labelled with Aha47,48. Similarly, Trp analogs were successfully incorporated into antimicrobial peptides in Trp-auxotrophic Lactococcus lactis strains49. SPI is also useful for the field of Xenobiology50,51, which explores alternatives to the basic chemical make-up of life. For example, based on previous works on E. coli52 and B. subtilis53, an E. coli strain was developed recently by an evolutionary strategy with selective pressure to utilize thienopyrrole instead of indole, resulting in proteome-wide substitution of tryptophan by thienopyrrole-alanine in the genetic code54. Generally, the canonical amino acid Trp, which is encoded by a single triplet (UGG), presents a promising target for protein engineering due to the rich facets of indole chemistry, which offers numerous chemical variations. Recently, and as an alternative to SPI-based incorporation, a novel SCS platform capable to incorporate Trp analogs site-specifically in both bacterial and eukaryotic hosts has been reported55. This further broadens the toolbox of in vivo ncAA-based protein engineering, including the alteration of spectral properties.
Besides the use of auxotrophic expression hosts, the SPI protocol requires strict fermentation conditions, both in terms of target expression timing and the composition of the medium in order to reach high ncAA incorporation efficiency and target protein yield56. Cultivation is conducted using chemically defined minimal media, which essentially contain besides major salts the sources for nitrogen (ammonium salt) and carbon (D-glucose), vitamins and trace elements. Although not strictly required in the absence of further auxotrophies, the remaining amino acids (20-n, if n amino acids are to be replaced) are commonly added to promote the bacterial growth57. During an initial growth phase before induction of target protein expression, the n canonical amino acids to be replaced are added in limiting concentrations. Cellular growth proceeds until the targeted essential amino acids are depleted, as experimentally indicated by a stationary OD600. Subsequently, the culture medium is replaced by fresh medium that lacks the depleted amino acid and contains the ncAA in abundant concentrations. For the ribosomal incorporation of tryptophan analogs as shown in this protocol, an indole analog is fed, which becomes intracellularly converted to the corresponding tryptophan derivative by tryptophan synthase58. Next, target protein expression is induced. At this stage, the cells are close to the end of logarithmic growth, as a balance between total cell number and fitness. As the presence and incorporation of the canonical amino would lead to wild-type protein production, it is critical to ensure that the essential amino acid is fully depleted prior to induction. Likewise, it is mandatory to examine the efficiency of ncAA incorporation into the target protein, commonly by mass spectrometry. In case of substantial presence of the canonical amino acid, the cultivation conditions need to be adjusted, e.g., by altering the concentration of the essential amino acid(s) for the initial growth phase or the duration of the latter. In case of low aaRS activity towards the ncAA, the overexpression of the endogenous enzyme or co-expression of a different aaRS, which is more active towards the ncAA, can be conducted59.
The canonical amino acid Trp is endowed with three remarkable features: (i) its natural abundance in proteins is low; (ii) its biophysical and chemical properties are unique (e.g., it is usually the dominant origin of the intrinsic fluorescence of proteins and peptides), and (iii) it contributes to a variety of biochemical interactions and functions including π-stacking, H-bonding and cation-π interactions. All these features are radically changed upon Trp → 4-amino-Trp substitution in GdFP. Beyond doubt, the design of a "gold" class of avGFPs is a remarkable example for engineering tailor-made autofluorescent proteins. With distinct spectral properties, FPs can be tuned towards certain spectral windows via mutagenesis and ncAA incorporation. In case of GdFP, this is accomplished by a simple chemical exchange H → NH2 in the frame of the indole ring contained in the ECFP chromophore triad. Figure 5 displays the effects of ncAA incorporation within the chromophore. The introduction of the electron-donating group originating from 4-amino-indole (intracellularly converted to 4-amino-Trp) enables a variety of mesomeric structures that can explain a stabilized excited state. Spectroscopically, its enlarged Stokes shift and red-shifted fluorescence emission result from these distinct properties of the extended conjugated system. As reported earlier, the enhanced intramolecular charge transfer within the GdFP chromophore is inherently sensitive to pH (Figure 4B) and accompanied by a larger change in dipole moment between the S0 ground and S1 excited state relative to ECFP33. As alternative electron-donating groups, tryptophan analogs bearing an indole ring substituted with hydroxy groups could be used, as reported in a comparative study with the model protein barstar41.
The absorption and fluorescence spectra of GdFP are broadened compared to ECFP and EGFP (Figure 3C and D). Homogeneous broadening of the absorption and fluorescence bands is generally caused by vibrational modes in the chromophore and, additionally, by coupling of the chromophore to further vibrational modes present in the protein60. The coupling to the local protein environment is supported by charges localized on the chromophore. As the structural inhomogeneity of the protein leads to local variations of the vibronic spectrum, such coupling between the vibronic spectra of the chromophore and the rest of the protein are supported by charge delocalization and mesomeric states as indicated in Figure 5. This coupling also supports the large Stokes shift and necessarily reduces the fluorescence quantum yield. In comparison to other red-shifted FPs, GdFP even exhibits improved protein stability and a low tendency for aggregation33,61,62. It not only differs in color from other FP variants but also exhibits a substantially increased thermostability and enhanced cooperative folding33. Its fluorescence intensity is at least 90% preserved upon heating to 60 °C, while ECFP fluorescence is reduced to about 30%. In proteins, aromatic amino acids often contribute to networks of interacting side chains, which commonly have a stabilizing effect on the protein's tertiary structure. avGFP harbors such a side chain network, which consists of the chromophore itself, as well as Phe-165, His-148, and Tyr-145. These side chains are not only quite rigid in the GdFP structure33, but importantly, they form hydrophobic contacts with the chromophore. The most prominent novel feature identified in GdFP is that the aminated chromophore is more proximal to Phe-165. This interaction is a feature not observed in other known avGFPs. As the two residues are 3.2-4.5 Å apart, amino-aromatic interactions might be also present. Together with the amination-induced resonance stabilization of the chromophore, these most likely stabilize this hydrophobic network of amino acids in a cooperative fashion. A more effective intramolecular charge transfer might be supported by these interactions in the excited state in comparison to the ground state of the chromophore, and it at least partly accounts for the 108 nm Stokes shift33,62.
In rational design of fluorophore properties, an increase in the size of the delocalized π-system is predicted to result in a red-shifted excitation wavelength. This rule of thumb is obeyed by the series of amino acids in position 66 leading to neutral chromophores: Phe (λmax = 355 nm) < His (λma x= 386 nm) < Tyr (λmax = 395 nm) < Trp (λmax = 436 nm)63. In nature, this extension of the chromophore's conjugated system of π-bonds has been achieved by different strategies. For DsRed from Discosoma striata, it is extended by the integration of an additional amino acid, thus shifting λmax to 573 nm64. The chromophore of asFP595 (λmax = 595 nm) from Anemonia sulcata was extended by an imino group, enlarging its π-system65. Since the chromophore of GdFP and other avFPs is of the same size, a different principle must entail an emission wavelength in the range of the expanded DsRed and asFP595 chromophores. The profound Stokes shift of 108 nm is attributed to the distinct structure of the GdFP chromophore, which reveals a new photophysical principle in the design of autofluorescent proteins. Preliminary calculations (as reported in 62) have shown that the dipole moment of the excited-state chromophore of GdFP is substantially larger than in the ground state, in contrast to the respective values of ECFP. Whereas the dipole moment of GdFP increases from ~3 D (Debye) in the S0 state to ~15 D in S1, the change for the ECFP chromophore was rather moderate (from ~4 D to ~6 D). Thus, the unique golden fluorescence of GdFP is caused by substantial intramolecular charge transfer within the chromophore, which increases the variety of possible mesomeric structures (see Figure 5) that allow for resonance stabilization. This reduces the energy level from which emission occurs. As a consequence of the profound change in the dipole moment upon excitation, the intramolecular charge separation is the principal reason for the changes in the electrostatic potential of the chromophore environment. The surrounding protein matrix, in turn, adjusts to the changes in the charge distribution after chromophore excitation. The subsequent structural relaxation lowers the energy level of the excited chromophore, which shifts the fluorescence spectrum to the red due to its charge transfer character. For the same reason, as a consequence of the large Stokes shift and enhanced rates of radiationless processes, the fluorescence quantum yield of GdFP is reduced compared to ECFP33.
The high quantum yield and small Stokes shift of ECFP and EGFP are usually ascribed to a rigid protein environment of the chromophore, which reduces the degrees of freedom and, consequently, internal conversion to favor the radiative relaxation of the excited state66. Consequently, the molecular design of more rigidly embedded chromophores with reduced coupling to the remaining protein matrix might serve as a guide to produce farther red-shifted GFP derivatives with high fluorescence quantum yield. Therefore, for further engineering approaches to produce red-shifted autofluorescent proteins, enlargement of the π-electron system and a rigid chromophore structure with weak coupling to the protein environment is highly desirable. Such modifications could also be introduced either directly into GFP-based chromophores or by placement of desired ncAAs in the chromophore vicinity.
Disclosures
The authors declare that they have no competing financial interests.
Acknowledgments
This work was supported by the German Research Foundation (Cluster of Excellence "Unifying Concepts in Catalysis) to T.F. and N.B. and by the Federal Ministry of Education and Science (BMBF Program "HSP 2020", TU-WIMIplus Project SynTUBio) to F.-J.S.
Materials
| Name | Company | Catalog Number | Comments |
| Chemicals | |||
| 4-aminoindole | Sigma-Aldrich | 525022 | |
| acetonitrile | VWR | HiPerSolv CHROMANORM ULTRA for LC-MS, 83642 | LC-MS grade required |
| agar-agar | Carl Roth | 5210 | |
| ammonium molybdate ((NH4)2MoO4) | Sigma-Aldrich | 277908 | |
| ammonium sulfate ((NH4)2SO4) | Sigma-Aldrich | A4418 | |
| ampicillin sodium salt | Carl Roth | K029 | |
| biotin | Sigma-Aldrich | B4501 | |
| bromophenol blue | Sigma-Aldrich | B0126 | |
| calcium chloride (CaCl2) | Sigma-Aldrich | C5670 | |
| colloidal silica | Sigma-Aldrich | Ludox HS-40, 420816 | |
| Coomassie Brillant Blue R 250 | Carl Roth | 3862 | |
| copper sulfate (CuSO4) | Carl Roth | CP86.1 | |
| D-glucose | Carl Roth | 6780 | |
| di-sodium hydrogen phosphate (Na2HPO4) | Carl Roth | X987 | |
| di-potassium hydrogen phosphate (K2HPO4) | Carl Roth | P749.1 | |
| 1,4-dithiothreitol (DTT) | Carl Roth | 6908 | |
| DNase I | Sigma-Aldrich | D5025 | |
| ethanol | Carl Roth | 9065.1 | |
| formic acid | VWR | HiPerSolv CHROMANORM for LC-MS, 84865 | LC-MS grade required |
| glycerol | Carl Roth | 3783 | |
| imidazole | Carl Roth | X998 | |
| indole | Sigma-Aldrich | I3408 | |
| iron(II) chloride (FeCl2) | Sigma-Aldrich | 380024 | |
| isopropanol | Carl Roth | AE73.1 | |
| isopropyl β-D-1-thiogalactopyranoside (IPTG) | Sigma-Aldrich | I6758 | |
| lysozyme | Sigma-Aldrich | L6876 | |
| magnesium chloride (MgCl2) | Carl Roth | KK36.1 | |
| magnesium sulfate (MgSO4) | Carl Roth | 8283.2 | |
| manganese chloride (MnCl2) | Sigma-Aldrich | 63535 | |
| β-mercaptoethanol | Carl Roth | 4227.3 | |
| potassium chloride (KCl) | Carl Roth | 6781.3 | |
| potassium dihydrogen phosphate (KH2PO4) | Sigma-Aldrich | P5655 | |
| RNase A | Carl Roth | 7156 | |
| sodium chloride (NaCl) | Carl Roth | P029 | |
| sodium dihydrogen phosphate (NaH2PO4) | Carl Roth | T879 | |
| sodium dodecyl sulphate (NaC12H25SO4) | Carl Roth | 0183 | |
| thiamine | Sigma-Aldrich | T4625 | |
| Tris(hydroxymethyl)-aminomethane (Tris) | Carl Roth | 5429 | |
| Tris hydrochloride (Tris-HCl) | Sigma-Aldrich | 857645 | |
| tryptone | Carl Roth | 8952 | |
| yeast extract | Carl Roth | 2363 | |
| zinc chloride (ZnCl2) | Sigma-Aldrich | 229997 | |
| Name | Company | Catalog Number | Comments |
| amino acids | |||
| L-alanine | Sigma-Aldrich | A7627 | |
| L-arginine | Sigma-Aldrich | A5006 | |
| L-asparagine | Sigma-Aldrich | A8381 | |
| L-aspartic acid | Sigma-Aldrich | A0884 | |
| L-cysteine | Sigma-Aldrich | C7352 | |
| L-glutamic acid | Sigma-Aldrich | G2128 | |
| L-glutamine | Sigma-Aldrich | G3126 | |
| L-glycine | Sigma-Aldrich | G7126 | |
| L-histidine | Sigma-Aldrich | H8000 | |
| L-isoleucine | Sigma-Aldrich | I2752 | |
| L-leucine | Sigma-Aldrich | L8000 | |
| L-lysine | Sigma-Aldrich | L5501 | |
| L-methionine | Sigma-Aldrich | M9625 | |
| L-proline | Sigma-Aldrich | P0380 | |
| L-phenylalanine | Sigma-Aldrich | P2126 | |
| L-serine | Sigma-Aldrich | S4500 | |
| L-threonine | Sigma-Aldrich | T8625 | |
| L-tryptophan | Sigma-Aldrich | T0254 | |
| L-tyrosine | Sigma-Aldrich | T3754 | |
| L-valine | Sigma-Aldrich | V0500 | |
| Name | Company | Catalog Number | Comments |
| Lab materials | |||
| 0.45 µm syringe filter with PVDF membrane | Carl Roth | CCY1.1 | |
| 1.5 mL microcentrifuge tubes | Eppendorf | 30120086 | |
| conical polystyrene (Falcon) tubes, 50 mL | Fisher Scientific | 14-432-22 | |
| Luer-Lock syringe 5 mL | Carl Roth | EP96.1 | |
| dialysis membrane, Molecular Weight Cut-Off (MWCO) 5,000 | Spectrum Medical Industries | Spectra/Por MWCO 5000 dialysis membrane, 133198 | |
| Immobilized Metal ion Affinity Chromatography (IMAC) column 1 mL, Ni-NTA | Macherey Nagel | Protino series, 745410.5 | |
| petri dishes (polystyrene, sterile) | Carl Roth | TA19 | |
| pQE-80L plasmid vector | Qiagen | no longer available | replaced by N-terminus pQE Vector set Cat No./ID: 32915 |
| protein extraction reagent BugBuster | EMB Millipore | 70921-4 | |
| round-bottom polystyrene tubes, 14 mL | Fisher Scientific | Corning Falcon, 14-959-1B | |
| Trp-auxotrophic E. coli strain | ATCC | ATCC 49980 | Bridges BA et al., Chem Biol Interact., 1972, 5(2):77-84; see main text for alternatives |
| Name | Company | Catalog Number | Comments |
| Mass Spectrometry equipment | |||
| mass spectrometer for LC-ESI-TOF-MS | Agilent | Agilent 6530 Accurate-Mass QTOF | coupled with Infinity LC system |
| mass spectrometry data analysis software | Agilent | MassHunter Qualitative Analysis software v. B.06.00 | |
| High-Performance Liquid Chromatography (HPLC) column for LC-ESI-TOF-MS | Sigma-Aldrich | Supelco Discovery BIO Wide Pore C5 HPLC column, 3 µm particle size, 10 cm x 2.1 mm | |
| HPLC autosampler vials 1.5 mL | Sigma-Aldrich | Supelco 854165 | with conical 0.1 mL glass inserts, screw caps and septa |
| Name | Company | Catalog Number | Comments |
| General equipment | |||
| benchtop centrifuge for 1.5 mL Eppendorf tubes | Eppendorf | 5427 R | |
| cooling centrifuge for 50 mL Falcon tubes | Eppendorf | 5810 R | |
| high pressure microfluidizer for bacterial cell disruption | Microfluidics | LM series with “Z” type chamber | |
| peristaltic pump for LC | GE Healthcare | P-1 | |
| Fast Protein Liquid Chromatography (FPLC) system | GE Healthcare | ÄKTA pure 25 L | |
| orbital shaker for bacterial cultivation | Infors HT | Minitron | |
| UV/Vis spectrophotometer | Biochrom | ULTROSPEC 2100 | |
| ultrasonic homogenizer for bacterial cell disruption | Omnilab | Bandelin SONOPULS HD 3200, 5650182 | with MS72 sonifier tip |
| Name | Company | Catalog Number | Comments |
| Fluorescence spectroscopy equipment | |||
| ps-pulsed laser 470 nm | Picoquant GmbH | PDL-470 | |
| time- and wavelength-correlated single photon counting (TWSPC) acquisition software | Picoquant GmbH | SymPhoTime 64 | |
| time- and wavelength-correlated single photon counting (TWSPC) detector | Picoquant GmbH | PML-16C | 16 spectral channels, to be selected by grating settings |
| single photon counting software | Picoquant GmbH | SPCM 9.75 | |
| global fitting software | Picoquant GmbH | SPC2Glo(R) | |
| fluorescence decay data analysis software | Picoquant GmbH | FluoFit program | |
| data analysis software | OriginLab Inc. | Origin 9.2 | |
| neutral density filter set | Schott | NG1 to NG11 | (400 - 650 nm, transmission 50 %, 20%, 10 %, 5 %) |
| 488 nm long-pass emission filter | AHF Analysentechnik | AHF-488 | |
| quartz cuvette | Thorlabs GmbH | CV10Q1400 | 1 cm pathlength |
References
- Shimomura, O., Johnson, F. H., Saiga, Y. Extraction, Purification and Properties of Aequorin, a Bioluminescent Protein from the Luminous Hydromedusan, Aequorea. J Cell Compar Physl. 59 (3), 223-239 (1962).
- Chalfie, M., Tu, Y., Euskirchen, G., Ward, W. W., Prasher, D. C. Green fluorescent protein as a marker for gene expression. Science. 263 (5148), 802-805 (1994).
- Andresen, M., et al. Structure and mechanism of the reversible photoswitch of a fluorescent protein. P Natl Acad Sci USA. 102 (37), 13070-13074 (2005).
- Andresen, M., et al. Structural basis for reversible photoswitching in Dronpa. P Natl Acad Sci USA. 104 (32), 13005-13009 (2007).
- Brakemann, T., et al. A reversibly photoswitchable GFP-like protein with fluorescence excitation decoupled from switching. Nat Biotechnol. 29 (10), 942-947 (2011).
- Kremers, G. -J., Gilbert, S. G., Cranfill, P. J., Davidson, M. W., Piston, D. W. Fluorescent proteins at a glance. J Cell Sci. 124 (Pt 2), 157-160 (2011).
- Shimomura, O. Structure of the chromophore of aequorea 0. shimomura green fluorescent protein. FEBS Lett. 104 (2), 220-222 (1979).
- Shaner, N. C., Campbell, R. E., Steinbach, P. A., Giepmans, B. N. G., Palmer, A. E., Tsien, R. Y. Improved monomeric red, orange and yellow fluorescent proteins derived from Discosoma sp. red fluorescent protein. Nat Biotechnol. 22 (12), 1567-1572 (2004).
- Shcherbo, D., et al. Bright far-red fluorescent protein for whole-body imaging. Nat Methods. 4 (9), 741-746 (2007).
- Shcherbakova, D. M., Subach, O. M., Verkhusha, V. V. Red fluorescent proteins: advanced imaging applications and future design. Angew Chem Int Edit. 51 (43), 10724-10738 (2012).
- Stepanenko, O. V., Verkhusha, V. V., Kuznetsova, I. M., Uversky, V. N., Turoverov, K. K. Fluorescent proteins as biomarkers and biosensors: throwing color lights on molecular and cellular processes. Curr Protein Pept Sc. 9 (4), 338-369 (2008).
- Wang, L., Xie, J., Deniz, A. A., Schultz, P. G. Unnatural amino acid mutagenesis of green fluorescent protein. J Org Chem. 68 (1), 174-176 (2003).
- Budisa, N., Steipe, B., Demange, P., Eckerskorn, C., Kellermann, J., Huber, R. High-level biosynthetic substitution of methionine in proteins by its analogs 2-aminohexanoic acid, selenomethionine, telluromethionine and ethionine in Escherichia coli. Eur J Biochem. 230 (2), 788-796 (1995).
- Sharma, N., Furter, R., Kast, P., Tirrell, D. A. Efficient introduction of aryl bromide functionality into proteins in vivo. FEBS Lett. 467 (1), 37-40 (2000).
- Liu, C. C., Schultz, P. G. Adding new chemistries to the genetic code. Annu Rev Biochem. 79, 413-444 (2010).
- Twine, S. M., Murphy, L., Phillips, R. S., Callis, P., Cash, M. T., Szabo, A. G. The Photophysical Properties of 6-Azaindole. J Phys Chem B. 107 (2), 637-645 (2003).
- Lepthien, S., Hoesl, M. G., Merkel, L., Budisa, N. Azatryptophans endow proteins with intrinsic blue fluorescence. P Natl Acad Sci USA. 105 (42), 16095-16100 (2008).
- Budisa, N., et al. Probing the role of tryptophans in Aequorea victoria green fluorescent proteins with an expanded genetic code. Biol Chem. 385 (2), 191-202 (2004).
- Ross, J. B., et al. Spectral enhancement of proteins: biological incorporation and fluorescence characterization of 5-hydroxytryptophan in bacteriophage lambda cI repressor. P Natl Acad Sci USA. 89 (24), 12023-12027 (1992).
- Soumillion, P., Jespers, L., Vervoort, J., Fastrez, J. Biosynthetic incorporation of 7-azatryptophan into the phage lambda lysozyme: Estimation of tryptophan accessibility, effect on enzymatic activity and protein stability. Protein Eng Des Sel. 8 (5), 451-456 (1995).
- Heim, R., Tsien, R. Y. Engineering green fluorescent protein for improved brightness, longer wavelengths and fluorescence resonance energy transfer. Curr Biol. 6 (2), 178-182 (1996).
- Bridges, B. A., Mottershead, R. P., Rothwell, M. A., Green, M. H. L. Repair-deficient bacterial strains suitable for mutagenicity screening: tests with the fungicide captain. Chem Biol Interact. 5 (2), 77-84 (1972).
- JoVE Science Education Database. Basic Methods in Cellular and Molecular Biology. Bacterial Transformation: The Heat Shock Method. J Vis Exp. , (2017).
- JoVE Science Education Database. Basic Methods in Cellular and Molecular Biology. Bacterial Transformation: Electroporation. J Vis Exp. , (2017).
- Grigorenko, B. L., Krylov, A. I., Nemukhin, A. V. Molecular modeling clarifies the mechanism of chromophore maturation in the green fluorescent protein. J Am Chem Soc. , (2017).
- JoVE Science Education Database. General Laboratory Techniques. Introduction to the Spectrophotometer. J Vis Exp. , (2017).
- Goedhart, J., et al. Structure-guided evolution of cyan fluorescent proteins towards a quantum yield of 93%. Nat Commun. 3, 751 (2012).
- Neidhardt, F. C., Bloch, P. L., Smith, D. F. Culture medium for enterobacteria. J Bacteriol. 119 (3), 736-747 (1974).
- Hörnsten, E. G. On culturing Escherichia coli on a mineral salts medium during anaerobic conditions. Bioprocess Eng. 12 (3), 157-162 (1995).
- Davis, B. D. The Isolation of Biochemically Deficient Mutants of Bacteria by Means of Penicillin. P Natl Acad Sci USA. 35 (1), 1-10 (1949).
- Sambrook, J., Russell, D. W. Molecular Cloning: A Laboratory Manual. , Cold Spring Harbor Laboratory Press. Cold Spring Harbor, NY, USA. (2001).
- Wang, Y. -S., et al. The de novo engineering of pyrrolysyl-tRNA synthetase for genetic incorporation of L-phenylalanine and its derivatives. Mol Biosyst. 7 (3), 714-717 (2011).
- Bae, J. H., et al. Expansion of the genetic code enables design of a novel "gold" class of green fluorescent proteins. J Mol Biol. 328 (5), 1071-1081 (2003).
- JoVE Science Education Database. Dialysis: Diffusion Based Separation. J Vis Exp. , Cambridge, MA. (2017).
- JoVE Science Education Database. Basic Methods in Cellular and Molecular Biology. Separating Protein with SDS-PAGE. J Vis Exp. , (2017).
- Petrásek, Z., et al. Excitation energy transfer from phycobiliprotein to chlorophyll d in intact cells of Acaryochloris marina studied by time- and wavelength-resolved fluorescence spectroscopy. Photoch Photobio Sci. 4 (12), 1016-1022 (2005).
- Kolber, Z. S., Barkley, M. D. Comparison of approaches to the instrumental response function in fluorescence decay measurements. Anal Biochem. 152 (1), 6-21 (1986).
- Pelet, S., Previte, M. J. R., Laiho, L. H., So, P. T. C. A fast global fitting algorithm for fluorescence lifetime imaging microscopy based on image segmentation. Biophys J. 87 (4), 2807-2817 (2004).
- Loefroth, J. E. Time-resolved emission spectra, decay-associated spectra, and species-associated spectra. J Phys Chem. 90 (6), 1160-1168 (1986).
- Hartman, M. C. T., Josephson, K., Lin, C. -W., Szostak, J. W. An expanded set of amino acid analogs for the ribosomal translation of unnatural peptides. PLoS One. 2 (10), e972 (2007).
- Budisa, N., et al. Global replacement of tryptophan with aminotryptophans generates non-invasive protein-based optical pH sensors. Angew Chem Int Edit. 41 (21), 4066-4069 (2002).
- Ma, Y., Biava, H., Contestabile, R., Budisa, N., di Salvo, M. L. Coupling bioorthogonal chemistries with artificial metabolism: intracellular biosynthesis of azidohomoalanine and its incorporation into recombinant proteins. Molecules. 19 (1), 1004-1022 (2014).
- Teramoto, H., Kojima, K. Incorporation of Methionine Analogues Into Bombyx mori Silk Fibroin for Click Modifications. Macromol Biosci. 15 (5), 719-727 (2015).
- Deal, R. B., Henikoff, J. G., Henikoff, S. Genome-wide kinetics of nucleosome turnover determined by metabolic labeling of histones. Science. 328 (5982), 1161-1164 (2010).
- Hinz, F. I., Dieterich, D. C., Tirrell, D. A., Schuman, E. M. Non-canonical amino acid labeling in vivo to visualize and affinity purify newly synthesized proteins in larval zebrafish. ACS Chem Neurosci. 3 (1), 40-49 (2012).
- Dieterich, D. C., et al. In situ visualization and dynamics of newly synthesized proteins in rat hippocampal neurons. Nat Neurosci. 13 (7), 897-905 (2010).
- Dieterich, D. C., Link, A. J., Graumann, J., Tirrell, D. A., Schuman, E. M. Selective identification of newly synthesized proteins in mammalian cells using bioorthogonal noncanonical amino acid tagging (BONCAT). P Natl Acad Sci USA. 103 (25), 9482-9487 (2006).
- Glenn, W. S., et al. Bioorthogonal Noncanonical Amino Acid Tagging (BONCAT) Enables Time-Resolved Analysis of Protein Synthesis in Native Plant Tissue. Plant Physiol. 173 (3), 1543-1553 (2017).
- Zhou, L., et al. Incorporation of tryptophan analogues into the lantibiotic nisin. Amino Acids. 48 (5), 1309-1318 (2016).
- Acevedo-Rocha, C. G., Budisa, N. Xenomicrobiology: a roadmap for genetic code engineering. Microb Biotechnol. 9 (5), 666-676 (2016).
- Agostini, F., Völler, J. -S., Koksch, B., Acevedo-Rocha, C. G., Kubyshkin, V., Budisa, N. Biocatalysis with Unnatural Amino Acids: Enzymology Meets Xenobiology. Angew Chem Int Edit. 56 (33), 9680-9703 (2017).
- Bacher, J. M., Ellington, A. D. Selection and characterization of Escherichia coli variants capable of growth on an otherwise toxic tryptophan analogue. J Bacteriol. 183 (18), 5414-5425 (2001).
- Wong, J. T. Membership mutation of the genetic code: loss of fitness by tryptophan. Pc Natl Acad Sci USA. 80 (20), 6303-6306 (1983).
- Hoesl, M. G., et al. Chemical Evolution of a Bacterial Proteome. Angew Chem Int Edit. 54 (34), 10030-10034 (2015).
- Italia, J. S., et al. An orthogonalized platform for genetic code expansion in both bacteria and eukaryotes. Nat Chem Biol. 13 (4), 446-450 (2017).
- Völler, J. -S., Thi To, T. M., Biava, H., Koksch, B., Budisa, N. Global substitution of hemeproteins with noncanonical amino acids in Escherichia coli with intact cofactor maturation machinery. Enzyme Microb Tech. 106, 55-59 (2017).
- Budisa, N., Steipe, B., Demange, P., Eckerskorn, C., Kellermann, J., Huber, R. High-level biosynthetic substitution of methionine in proteins by its analogs 2-aminohexanoic acid, selenomethionine, telluromethionine and ethionine in Escherichia coli. Eur J Biochem. 230 (2), 788-796 (1995).
- Völler, J. -S., Budisa, N. Coupling genetic code expansion and metabolic engineering for synthetic cells. Curr Opin Biotech. 48, 1-7 (2017).
- Johnson, J. A., Lu, Y. Y., Van Deventer, J. A., Tirrell, D. A. Residue-specific incorporation of non-canonical amino acids into proteins: recent developments and applications. Curr Opin Chem Biol. 14 (6), 774-780 (2010).
- Somsen, O. J., van Grondelle, R., van Amerongen, H. Spectral broadening of interacting pigments: polarized absorption by photosynthetic proteins. Biophys J. 71 (4), 1934-1951 (1996).
- Kurschus, F. C., Pal, P. P., Bäumler, P., Jenne, D. E., Wiltschi, B., Budisa, N. Gold fluorescent annexin A5 as a novel apoptosis detection tool. Cytom Part A. 75 (7), 626-633 (2009).
- Lepthien, S., Wiltschi, B., Bolic, B., Budisa, N. In vivo engineering of proteins with nitrogen-containing tryptophan analogs. Appl Microbiol Biot. 73 (4), 740-754 (2006).
- Wachter, R. M., Elsliger, M. -A., Kallio, K., Hanson, G. T., Remington, S. J. Structural basis of spectral shifts in the yellow-emission variants of green fluorescent protein. Structure. 6 (10), 1267-1277 (1998).
- Verkhusha, V. V., Lukyanov, K. A. The molecular properties and applications of Anthozoa fluorescent proteins and chromoproteins. Nat Biotechnol. 22 (3), 289-296 (2004).
- Martynov, V. I., Savitsky, A. P., Martynova, N. Y., Savitsky, P. A., Lukyanov, K. A., Lukyanov, S. A. Alternative cyclization in GFP-like proteins family. The formation and structure of the chromophore of a purple chromoprotein from Anemonia sulcata. J Biol Chem. 276 (24), 21012-21016 (2001).
- Piatkevich, K. D., Malashkevich, V. N., Morozova, K. S., Nemkovich, N. A., Almo, S. C., Verkhusha, V. V. Extended Stokes shift in fluorescent proteins: chromophore-protein interactions in a near-infrared TagRFP675 variant. Sci Rep. 3 (1), 1847 (2013).
