This article describes a novel method to generate tumor antigen-specific induced pluripotent stem cell-derived thymic emigrants (iTE) by a three-dimensional (3D) thymic culture system. iTE are a homogenous subset of T cells closely related to naïve T cells with the capacity for proliferation, memory formation, and tumor suppression.
Method Article
A Three-dimensional Thymic Culture System to Generate Murine Induced Pluripotent Stem Cell-derived Tumor Antigen-specific Thymic Emigrants
* These authors contributed equally
In This Article
Summary
Abstract
The inheritance of pre-rearranged T cell receptors (TCRs) and their epigenetic rejuvenation make induced pluripotent stem cell (iPSC)-derived T cells a promising source for adoptive T cell therapy (ACT). However, classical in vitro methods for producing regenerated T cells from iPSC result in either innate-like or terminally differentiated T cells, which are phenotypically and functionally distinct from naïve T cells. Recently, a novel three-dimensional (3D) thymic culture system was developed to generate a homogenous subset of CD8αβ+ antigen-specific T cells with a naïve T cell-like functional phenotype, including the capacity for proliferation, memory formation, and tumor suppression in vivo. This protocol avoids aberrant developmental fates, allowing for the generation of clinically relevant iPSC-derived T cells, designated as iPSC-derived thymic emigrants (iTE), while also providing a potent tool to elucidate the subsequent functions necessary for T cell maturation after thymic selection.
Introduction
Adoptive T cell therapy (ACT) can be an effective treatment for some patients with advanced cancer. Unfortunately, many patients do not experience tumor regression, and transferred cells fail to persist after infusion. This may be due to the quality of the infused T cells. An ACT mouse model showed that compared to naïve or less differentiated central memory T cells, terminally differentiated effector cells are less potent due to poor in vivo persistence1, an observation also supported by clinical data2,3.
In an effort to improve the efficacy of current ACT, T cell-derived induced pluripotent stem cells (T-iPSC) have been studied extensively4,5. When T cells are reprogrammed into T-iPSC and re-differentiated into T cells, the rearranged configuration of TCR genes is inherited by T-iPSC, and subsequently the re-differentiated T cells. Therefore, the capacity of T-iPSC to undergo unlimited in vitro expansion permits the efficient reproduction of immature T cells carrying the neoantigen-specific T cell receptors (TCR) when such cells are engineered from tumor antigen-specific T cells6,7. However, the precise method for differentiation of T-iPSC into mature T cells, which would allow the production of cancer antigen-specific T cells with a less differentiated phenotype and better anti-tumor potency, remains to be elucidated.
T-iPSC differentiation employing the co-culture of OP9 murine stromal cells over-expressing human Notch ligand DLL1 is a well-established method to produce T cells in vitro6,7. In mice and humans, this co-culture system can consistently differentiate iPSC, thereby recapitulating developmental events from the blastocyst stage until the immature T cell lineage stage6,7. Despite these biotechnological advances, the physiological differentiation after the CD4+CD8+ double positive (DP) stage is still difficult to achieve. One of the reasons is that in vivo CD4+CD8- and CD4-CD8+ single positive (SP) T cells are generated in the thymus, an organ responsible for the maturation and selection of T cells that have foreign antigen-specificity but not auto-reactivity8. These selective processes are defined as positive and negative selection, respectively. However, most of the molecular mechanisms necessary to mature T cells in the thymus are still not fully understood, making it difficult to reconstruct this process in vitro. In an attempt to overcome this physiological hurdle, several groups have stimulated the TCR complex using anti-CD3 antibodies or agonist peptides. These in vitro techniques generate cell products which express key T cell markers, like CD3, CD8αβ, TCRαβ, and CD62L, while still retaining tumor antigen-specificity. Unfortunately, T cells generated by these extrathymic methods constitute a broad heterogenous population of cells characterized by incomplete positive selection, innate-like features, TCR non-specific killing, inability for memory formation, and non-persistent anti-tumor effects in vivo8,9,10,11. These abnormalities have raised concerns that such cells might trigger a variety of side effects, including lymphoma and both skin and bone abnormalities, if used for therapeutic applications12,13,14.
To recreate the physiological signals missing in current in vitro differentiation systems, tumor antigen-specific T-iPSC were differentiated using a harvested thymus. The classical fetal thymus organ culture (FTOC) system, which was designed to study the intra-thymic development of T cells, was improved by using a 3D culture system which successfully produced T cells that completed thymic education. These post-thymic T cells, which were designated as iPSC-derived thymic emigrants (iTE), exhibited naïve-like properties15. iTE showed proliferation, memory formation, and adequate anti-tumor effects in a mouse model against established B16 melanoma tumors. This article describes in detail the protocol of this novel FTOC system using a 3D culture system (Figure 1).
Protocol
All the animal experiments were approved by the Institutional Animal Care and Use Committees of the National Cancer Institute (NCI) and performed in accordance with NIH guidelines.
1. Preparation of OP9/DLL1 Cells for Co-culture with iPSC
- Culture OP9/DLL1 cells in OP9 media (α-minimum essential medium [α-MEM] + 20% non-heat inactivated fetal bovine serum [FBS] + 1x penicillin-streptomycin + ascorbic acid [50 ng/mL] and mono-thioglycerol [100 nM]) at 37 °C. When OP9/DLL1 cells reach 80–95% confluency, wash once with 1x magnesium, calcium, and phenol red free phosphate buffered saline (hereafter referred to as PBS).
- Add 4 mL of 0.05% trypsin and incubate for 5 min at 37 °C. Then add 4 mL of OP9 media, dissociate the cell layer by pipetting to make a single cell suspension.
- Transfer the cell suspension into a 50 mL conical tube through a 100 µm cell strainer. Centrifuge at 300 x g for 5 min at 4 °C, aspirate the supernatant, and resuspend in 12 mL of OP9 media.
- Plate 2 mL of OP9/DLL1 cell suspension onto a new 10 cm cell-culture Petri dish and add additional 8 mL of OP9 media. Repeat passage every 2–3 days.
NOTE: The quality of the FBS and culture conditions are critical to maintain the expansion of OP9/DLL1 cells without losing their ability to support iPSC differentiation. Therefore, it is recommended to pre-evaluate the lot of FBS and passage consistently at 80% confluency to prevent cell differentiation and senescence. It is also important to make enough frozen stock of OP9/DLL1 cells and thaw a new stock every 4–6 weeks.
2. In Vitro Differentiation of iPSC into Immature T Cells
- On day 0, begin iPSC co-culture on OP9/DLL1 confluent dishes.
- Harvest iPSC as a single cell suspension by trypsinization (5 min in 0.05% trypsin at 37 °C), collect the cells, and centrifuge at 300 x g for 5 min at 4 °C.
- Aspirate the supernatant and resuspend cells at 1.0 x 10⁵ iPSC per 10 mL of OP9 media. Plate 1.0 x 10⁵ iPSC onto a confluent OP9/DLL1 10 cm dish.
NOTE: OP9/DLL1 10 cm dishes are used for iPSC differentiation when they reach 90–100% confluency. Differences in confluency can affect the efficiency of iPSC differentiation.
- On day 3, aspirate old media and replace with 10 mL of fresh OP9 media.
- On day 6, passage cells.
- Wash each 10 cm confluent OP9 dish with 10 mL of PBS. Add 3 mL of 0.05% trypsin per dish and incubate for 3–5 min at room temperature (RT).
- Add 4 mL of OP9 media and collect cells by gentle pipetting. Pass cells through a 100 µm cell strainer and centrifuge at 300 x g for 5 min at 4 °C. Discard supernatant.
- Resuspend cells in 10 mL of differentiation media (OP9 media with 5 ng/mL mouse Flt3 ligand [FLT3L] and 5 ng/mL mouse IL-7) and plate cell suspension onto a new 10 cm OP9/DLL1 confluent dish.
- On day 9, aspirate old media and replace with 10 mL of fresh differentiation media.
- On day 11 when cardiomyocytes are observed in iPSC colonies, mechanically detach non-adherent cells by pipetting and filter through a 100 µm cell strainer. Spin at 300 x g for 5 min at 4 °C.
- Aspirate the supernatant and resuspend in 24 mL of differentiation media. Plate iPSC into a confluent OP9/DLL1 6-well plate (4 mL/well).
- On day 15, collect all non-adherent cells and filter through a 40 µm cell strainer.
- Spin at 300 x g for 5 min at 4 °C.
- Continue passaging non-adherent cells every 3–4 days by repeating step 2.5.1.
3. 3D Thymic Organ Culture to Generate iTE
- Harvest mouse fetal thymic lobes and deploy of endogenous lymphocytes by deoxyguanosine (dGUO) treatment as previously described16.
- On day 7 of dGUO treatment, take four new 10 cm dishes and fill each with 20 mL of complete media (Rosswell Park Memorial Institute Media 1640 [RPMI 1640] + 10% FBS + 1x L-alanyl-L-glutamine + 1x sodium pyruvate + 1x minimum essential medium with non-essential amino acids (MEM-NEAA) + 1x penicillin-streptomycin + [1:1000] 2-mercapto ethanol).
- Transfer all nitrocellulose membranes with thymic lobes into one 10 cm dish. Detach the individual lobes from the membrane with forceps, allowing them to be submerged in media. Discard the membranes. Incubate for 1 h at RT.
- Transfer the thymic lobes to a new 10 cm dish with complete media and incubate for 1 h at RT. Repeat this step 2 more times.
- Using forceps, fix the thymic lobes to the dish (one at a time), and with the other hand make a 100–200 µm deep incision in the center and extending half the diameter of the lobe to facilitate T cell progenitor migration into the lobe.
- Transfer the thymic lobes to a new 10 cm dish filled with complete differentiation media (complete media + 5 ng/mL mouse IL-7 + 5 ng/mL mouse FLT3L + 5 ng/mL SCF).
- Optionally, if using 3D culture plates with lower and upper level grids, fill both grids with sterile PBS to prevent the evaporation and drying of the hanging drops.
- Transfer 30 µL of complete media containing one dGuo-treated thymic lobe from step 3.6 into each well of 3D culture plate.
- Collect non-adherent T lineage cells (iPSC-derived immature T cells) from OP9/DLL1 co-culture (days 16-21) (step 2.6.2) and resuspend at 2–5 x 10³ T lineage cells per 20 µL media.
- Add 20 µL of T lineage cell suspension to each thymic lobe in the 3D culture plate. Incubate overnight at 37 °C with 5% CO2.
- Set the P200 pipet to 30 µL and aspirate the media after pipetting several times from each well to remove all the cells surrounding the thymic lobes. Discard media and add 30 µL of complete media. Repeat this procedure 5–7 times to remove any extra immature T cells which does not migrate into the lobes. Change 25–30 µL of media daily thereafter.
- Confirm the formation of a halo of iPSC-derived thymic emigrants (iTE) around the lobes beginning on day 4–5 by light microscopy.
- Collect iTE daily by pipetting media without lobe disruption. Change media every day and continue collection up to approximately 12 days.
- Harvested iTE are ready to use for molecular analyses (Figure 2, Figure 3, Figure 4, and Figure 5) or in vivo transplantation experiments.
4. Preparation of Antigen Presenting Cells (APC)
- Sacrifice a C57BL/6 mouse by cervical dislocation and place onto a lab soaker mat as described above.
- Remove the spleen and place it onto a 100 µm cell strainer. Compress the spleen onto the strainer using a 12 mL syringe plunger to make a single cell suspension.
- Transfer the cell suspension through a sterile 40 µm cell strainer. Centrifuge the suspension at 300 x g for 5 min at 4 °C to pellet the cells.
- Aspirate the supernatant and resuspend the cell pellet in 2 mL of ammonium-chloride-potassium (ACK) lysis buffer to exclude red blood cells (RBC). Incubate for 5 min at RT.
- Quench the ACK lysis buffer by adding 10 mL of PBS. Pellet the cells by centrifugation at 300 x g for 5 min at 4 °C.
- Aspirate the supernatant and resuspend the cell pellet in 10 mL of complete media and transfer to a 10 cm sterile Petri dish.
- Irradiate splenocytes with 3500 rad using an irradiation device (γ-radiation) to prevent cell proliferation.
- Immediately return the irradiated cells to a 37 °C incubator and culture overnight.
- Use irradiated cells as APC or freeze in cell banker.
5. Pulsing APC with Antigen
- Count live irradiated APC using a Neubauer hemocytometer and trypan blue dye. Incubate APC with peptides (hgp100) or nucleoprotein for 30 min at 37 °C.
- Wash APC twice with 10 mL of PBS to remove any extra peptide.
- Count iTE and mix with APC in a 1:1 ratio in complete media with 100 IU IL-2 and 5 ng/mL IL-7. Aliquot 100 µL of the mixture of cells (total concentration: 1 x 10⁶ cells/mL) into each well of an ultra-low attachment U bottom 96 well plate and culture for 48 h at 37 °C.
- After 48 h, transfer cells to a new plate using a multichannel pipette and passage every 2–3 days thereafter.
- On day 3, analyze the cytokine secretion profile by staining the cells with intracellular antibody and analyze by flow cytometry (Figure 3).
- Add 0.67 µL/mL of protein transport inhibitor (e.g., GolgiStop) and incubate at 37 °C for 6 h to enhance the intracellular accumulation of cytokines. Wash with 10 mL of PBS.
- Resuspend cells in 3 mL of cold (4 °C) PBS and slowly add 1 mL of cold 4% paraformaldehyde (PFA) solution.
- After 10 min, spin down cells at 300 x g for 5 min at 4 °C, discard supernatant and wash with 10 mL of PBS.
- Resuspend cells in 1 mL PBS + 1% FBS + 0.1% nonionic surfactant, and place in 4 °C for 10–15 min.
- Add antibodies, protect samples from light and place in 4 °C for 30 min.
- Spin down cells at 300 x g for 5 min at 4 °C, discard supernatant, and wash with 10 mL of PBS.
- Spin down cells at 300 x g for 5 min at 4 °C and resuspend cells in 1 mL of PBS. Cells are ready to be analyzed in a flow cytometer.
Results
Co-cultured fetal thymuses were sectioned to analyze whether iPSC-derived T lineage cells can migrate into the thymic lobes. Unseeded control lobes had a tissue architecture characterized by an astrocyte-like thymic epithelial web17, deployed of endogenous CD3+ cells. On the other hand, thymic lobes seeded with iPSC-derived immature T cells were repopulated with CD3+ mononuclear cells, indicating migration of iPSC-derived immature T cells into the lobes (Figure 2A).
T cells that migrated into and matured within the thymic microenvironment subsequently egressed as iTE. To test their phenotypic characterization, flow cytometric analysis of C57BL6 thymocytes, Pmel iPSC-derived immature T cells (extrathymic), and cells that egressed from thymic lobes (iTE) was performed. Extrathymic T cells on OP9/DLL1 showed CD4+CD8+ (DP) T cells and CD8αSP T cells without expression of the positive selection marker MHC-I, whereas iTE had a clear population of CD8αSP MHC-I+ T cell phenotype, indicating their successful passage through positive selection prior to egressing from the thymic lobes. iTE consistently express MHC-I and CD62L, which are markers associated with high proliferative competency, cytokine production, peripheral survival, and lymphoid homing18,19,20. This phenotype is consistent with M2 SP thymocytes that are the most mature population of single positive T cells in the thymus20, which suggests that iTE have transitioned through a normal thymic developmental program (Figure 3). To monitor the efficiency of iTE generation, cells that had egressed from individual thymic lobes were isolated. On day 7, thymic lobes generated an average of 1 x 10³ live CD8SP CD45.1+ CD3+ iTE per day (Figure 3B). A similar rate of iTE production is observed from day 6 to day 12 of 3D thymic co-culture.
Antigen-dependent activation and secretion of cytokines were analyzed to observe the functional properties of thymically educated iPSC-derived immature T cells. In the presence of an irrelevant peptide (nucleoprotein), Pmel-iTE did not release significant amounts of TNF-α, IL-2, or IFN-γ. When stimulated with the cognate peptide for Pmel T cells (hgp100), Pmel-iTE released robust amounts of TNF-α and IL-2, while also producing low amounts of IFN-γ (Figure 4), indicating that thymically educated iTE can recognize their cognate peptide and secrete effector cytokines with a profile resembling that of natural recent thymic emigrants (RTE).
To examine the transcriptional differences between iPSC-derived T lineage cells differentiated on OP9/DLL1 with or without thymic education (i.e., iTE versus extrathymic T cells), RNA-seq analysis was performed on these two populations and compared to that of DP T lineage cells differentiated using OP9/DLL1 (DP) and primary naïve CD8+ Pmel T cells. The expression of 102 genes which play crucial roles in T cell ontogeny, thymocyte activation, and memory formation were analyzed15,20,21,22. A principal component analysis of those four studied populations demonstrated that extrathymically generated DP and CD8SP T cells clustered together, while iTE clustered closer to naïve T cells (Figure 5). Collectively, these data demonstrate that iTE have a phenotype closer to naïve T cells than do T lineage cells generated by extrathymic methods.
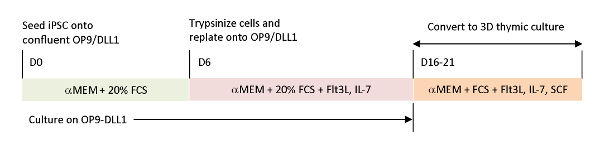
Figure 1: Schematic overview of the differentiation of iPSC to iTE using OP9/DLL1 and 3D thymic culture. The protocol involves three separate differentiation steps; (Left) from iPSC cells to hematopoietic lineage cells on OP9/DLL1 (day 0 to 6), (Middle) from hematopoietic lineage cells to immature T cells on OP9/DLL1 with cytokines (day 6 to 16–21), and (Right) from immature T cells (day 16–21) to iTE using a 3D thymic culture system. Please click here to view a larger version of this figure.
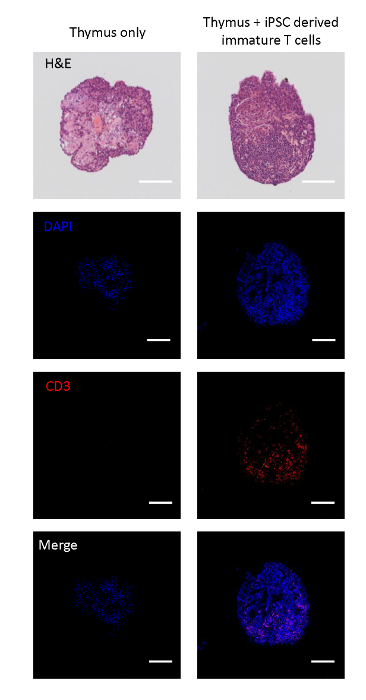
Figure 2: Immuno-histochemistry of thymic lobes seeded with iPSC-derived immature T cells. Top: H&E staining of a thymic lobe with and without seeding of iPSC-derived immature T cells. From second top to bottom: confocal images of the sectioned lobes stained with DAPI (nucleus), CD3 (T cell), and merge. Scale bars = 100 µm. Please click here to view a larger version of this figure.
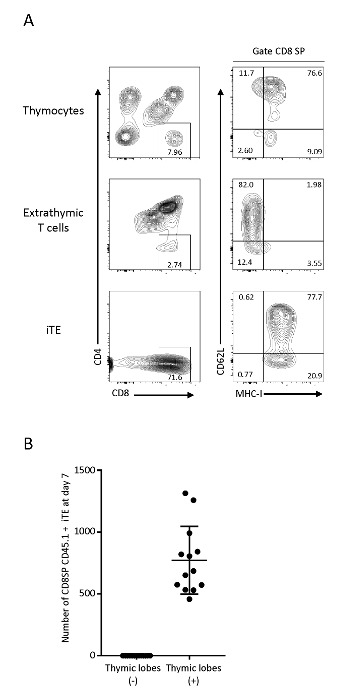
Figure 3: iTE show a post-thymic T cell phenotype. (A) FACS analyses of thymocytes, extrathymic T cells (OP9/DLL1 co-culture system) and Pmel-iTE. Live cells were gated on congenic CD45+. CD8 SP populations were further analyzed for CD62L and MHC-I expression. (B) Average number of CD8SP CD45.1 iTE produced overnight per lobe 7 days after pre-seeding. Data were collected from 12 independent experiments. Please click here to view a larger version of this figure.
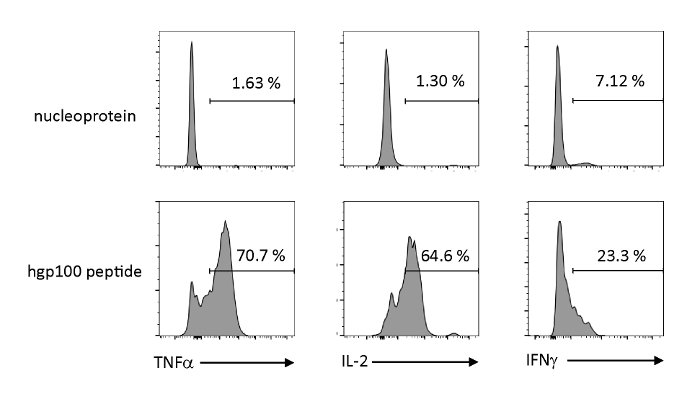
Figure 4: iTE produce various cytokines by antigen-specific stimulation. FACS analyses of intra-cellular production of cytokines by iTE. iTE were co-cultured with APCs pre-loaded with irrelevant (nucleoprotein) or cognate (hgp100) peptide for three days. The numbers shown in upper right quadrants indicate the percentages of iTE producing cytokine. Please click here to view a larger version of this figure.
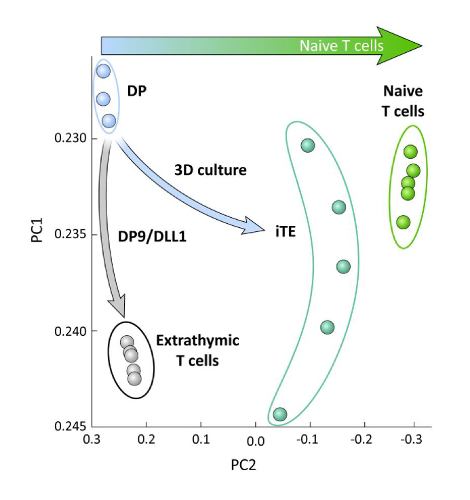
Figure 5: Whole-transcriptome analysis reveals a shift in iTE gene expression toward a naïve CD8+ T cell program. Principle component analysis (PCA) of RNA-seq data from DP, extrathymic CD8 SP, iTE, and naïve T cells. (Analysis of 102 genes related to thymic differentiation using public database GSE105110)15. Please click here to view a larger version of this figure.
Discussion
Using T-iPSC to regenerate tumor antigen-specific T cells may overcome many of the current obstacles of ACT by generating young cells with improved persistence. Although several methods using the OP9/DLL1 co-culture system have been reported to generate CD8 SP cells6,7,10,13 that express CD8 molecules and tumor antigen-specific TCRs, global gene expression patterns and functional analysis show that these extrathymically regenerated CD8 SP cells are different from naïve T cells (Figure 4). Here, we describe a 3D thymic culture system that can generate iPSC-derived thymic emigrants (iTE) with high fidelity and homogeneity from murine T-iPSC. iTE resemble naïve T cells in global gene expression pattern and in functionality, such as memory formation and in vivo anti-tumor effect against established tumor15.
The classical FTOC system is a way to recapitulate thymic selection in vitro. It has been used for studying intra-thymic development of thymocytes23, and there are a few reports of FTOC being used to generate RTE24. However, the FTOC system has several limitations. To deal with the lack of oxygen in an artificial organ culture, several groups have used either a semi-dry membrane based culture23, or high oxygen submersion culture systems25. However, no current methods can constantly generate a homogenous population of post-thymic T cells. To overcome the limitations of the classical FTOC system, we designed a 3D thymic culture system that provides technical improvements over conventional methods15. For example, using our 3D thymic culture method, maximal oxygen exchange and the absence of surface-lobe mechanical stress keep the thymic lobes in a more physiological environment. Additionally, long term culture permits mature T cells to egress naturally from the thymic lobes. Finally, real time observation and micro-manipulation enable media exchange and a constant collection of iTE without physically disturbing the thymic lobes. Thus, the 3D thymic culture method provides significant technical improvements as well as an avenue to study thymically selected naïve T-cells that was not previously available.
There are several key points for the successful generation of iTE using this 3D thymic culture system. The quality of the FBS and culture conditions is critical to maintain the expansion of OP9/DLL1 cells without losing their ability to support iPSC differentiation. Therefore, we recommend pre-evaluation of the FBS lot as well as consistently passaging at 80% confluency to prevent cell differentiation and senescence. Additionally, a confluent OP9/DLL1 culture is required for in vitro differentiation of iPSC into immature T cells, as differences in confluency can affect their efficiency. Finally, the embryonic age of thymic lobes is crucial for the generation of iTE. We recommend using E14.5 - 15.5 thymic lobes.
As with any new protocol, this method has limitations and is subject to improvement. The culture technique presented here generates approximately 1000 iTE per thymic lobe per day for a period of two weeks. Increased iTE generation may be possible with further modifications, including optimization of oxygen concentration, media volume, and type of 3D culture plate. Addition or removal of cytokines, as well as changes in cytokine concentration, may also contribute to improved iTE yield.
Given that the 3D thymic culture system presented here can generate thymic emigrants in a completely ex vivo system, this technique can be applied to a variety of immunological and adoptive cell transfer research projects including, but not limited to T cell differentiation, post-thymic T cell maturation, and generation of antigen-specific T cells from hematopoietic progenitor or stem cells. Although this method is not directly applicable to human samples, iTE and the 3D thymic culture system hold great potential for elucidating the molecular mechanisms of positive and negative selection and may facilitate the creation of a culture system that enables the generation of clinically relevant tumor antigen-specific naïve-like T cells for ACT.
Disclosures
Authors Raul Vizcardo, Nicholas D. Klemen, and Nicholas P. Restifo are inventors on pending international patent application PCT/US2017/65986, filed December 13, 2017, entitled "Methods of Preparing an Isolated or Purified Population of Thymic Emigrant Cells and Methods of Treatment Using the Same."
Acknowledgements
We thank Hiroshi Kawamoto and Kyoko Masuda for kindly providing the OP9/DLL1 cell line. We thank Alan B. Hoofring and Erina Z. He for graphical assistance. This research was supported by the Intramural Research Program of the US National Cancer Institute (ZIA BC010763) and the Cancer Moonshot program for the Center for Cell-based Therapy at the NCI, NIH. The work was also supported by the Milstein Family Foundation.
Materials
| Name | Company | Catalog Number | Comments |
|---|---|---|---|
| Chemicals, Peptides and Recombinant Proteins | |||
| 2-deoxyguanosine | Sigma-Aldrich | 312693-72-4 | |
| 2-Mercaptoethanol (1,000x) | Thermo Fisher Scientific | 21985-023 | |
| ACK Lysing Buffer | Gibco | A1049201 | |
| Ascorbic acid | Sigma-Aldrich | A8960 | |
| Blasticidin | Thermo Fisher Scientific | R21001 | |
| FBS | Gemini | 100-500 | |
| Flt-3 ligand | R&D Systems | 427-FL | |
| GlutaMAX (100x) | Thermo Fisher Scientific | 35050-061 | |
| hgp100 | Genscript | 282077-1, KVPRNQDWL | |
| Interleukin-2 | R&D Systems | 402-ML | |
| Interleukin-7 | R&D Systems | 407-ML | |
| MEM Non-Essential Amino Acids Solution | Gibco | 11140050 | |
| MEM powder | Gibco | 61100061 | |
| Monothioglycerol | Sigma-Aldrich | M-6145 | |
| Nucleoprotein | Global Peptides | ASNENMETM | |
| Penicillin/streptomycin | Thermo Fisher Scientific | 15140-122 | |
| Phosphate buffered saline pH 7.4 (1x) | Thermo Fisher Scientific | 10010-023 | |
| Puromycin | Thermo Fisher Scientific | A1113803 | |
| RPMI 1640 | Gibco | 11875093 | |
| Sodium Pyruvate | Thermo Fisher Scientific | 11360-070 | |
| Stem Cell Factor (SCF) | R&D Systems | 455-MC | |
| Stemfactor LIF, Mouse Recombinant | STEMGENT | 03-0011-100 | |
| Trypsin-EDTA (0.05%), phenol red | Thermo Fisher Scientific | 25300-062 | |
| Cell Culture Vessels and others | |||
| 10 cm dish | Corning, Inc. | 353003 | |
| 12 mL Syringe | Covidien Monoject | 22-652-090 | |
| 6 well plate | Corning/Coster | 3516 | |
| Cell strainer 100 μm | Fisher Scientific | 22-363-549 | |
| Cell strainer 40 μm | Fisher Scientific | 22-363-547 | |
| Forceps | DUMONT | 0108-5PO | |
| Lab soaker mat | Versi-Dry | Cat. EF2175CX 74018-00 | |
| Membrane filters ( 0.8 μm, 47diam) | Whatman | WHA7408004 ALDRICH | |
| Perfecta3D Hanging Drop Plate | Sigma-Aldrich | HDP1096 | |
| U Bottom 96 well plate | Corning/Coster | 3799 | |
| Experimental Cell lines | |||
| CD3-iPSC | Vizcardo et al., Cell Report 2018 | N/A | |
| MEF-iPSC | Vizcardo et al., Cell Report 2018 | N/A | |
| Mouse Embryonic Fibroblasts (MEF) | ATCC | SCRC-1040; RRID:MGI:5007926 | |
| OP9/N-DLL1 | Riken Bioresource center | Cat# RCB2927; RRID:CVCL_B220 | |
| Pmel-iPSC | Vizcardo et al., Cell Report 2018 | N/A | |
| Experimental mouse models | |||
| B6.SJL-PtprcaPepcb/BoyCrCrl | Charles River | Strain Code 564; RRID:IMSR_CRL:564 | |
| C57BL/6N | NCI/Charles River | N/A | |
| Pmel-1 mice | Overwijk et al. | J Exp Med 198(4):569-80 | |
| Antibodies | |||
| Anti-aTCR | Biolegend | 109202; RRID:AB_313425 | |
| Anti-CD3 | abcam | ab11089; RRID:AB_369097 | |
| Anti-CD4 | BD Biosciences | 553730; RRID:AB_395014 | |
| Anti-CD44 | BD Biosciences | 559250; RRID:AB_398661 | |
| Anti-CD45.1 | BD Biosciences | 553775; RRID:AB_395043 | |
| Anti-CD45.2 | BD Biosciences | 553772; RRID:AB_395041 | |
| Anti-CD62L | BD Biosciences | 560516; RRID:AB_1645257 | |
| Anti-CD69 | BD Biosciences | 552879; RRID:AB_394508 | |
| Anti-CD8a | BD Biosciences | 557959; RRID:AB_396959 | |
| Anti-CD8b | BD Biosciences | 550798; RRID:AB_393887 | |
| Anti-H-2Kb | BD Biosciences | 553570; RRID:AB_394928 | |
| Anti-IFN-g | BD Biosciences | 557998; RRID:AB_396979 | |
| Anti-IL-2 | BD Biosciences | 554428; RRID:AB_395386 | |
| Anti-TCRb | Thermo Fisher Scientific | 35-5961-81; RRID:AB_469741 | |
| Anti-TCRVb13 | BD Biosciences | 553204; RRID:AB_394706 | |
| Anti-TNFa | BD Biosciences | 557644; RRID:AB_396761 |
References
- Gattinoni, L., et al. Wnt signaling arrests effector T cell differentiation and generates CD8+ memory stem cells. Nature Medicine. 15 (7), 808-813 (2009).
- Rosenberg, S. A., et al. Durable complete responses in heavily pretreated patients with metastatic melanoma using T-cell transfer immunotherapy. Clinical Cancer Research. 17 (13), 4550-4557 (2011).
- Singh, N., Perazzelli, J., Grupp, S. A., Barrett, D. M. Early memory phenotypes drive T cell proliferation in patients with pediatric malignancies. Science Translational Medicine. 8 (320), 320-323 (2016).
- Crompton, J. G., Clever, D., Vizcardo, R., Rao, M., Restifo, N. P. Reprogramming antitumor immunity. Trends of Immunology. 35 (4), 178-185 (2014).
- Takahashi, K., Yamanaka, S. Induction of pluripotent stem cells from mouse embryonic and adult fibroblast cultures by defined factors. Cell. 126 (4), 663-676 (2006).
- Vizcardo, R., et al. Regeneration of human tumor antigen-specific T cells from iPSCs derived from mature CD8(+) T cells. Cell Stem Cell. 12 (1), 31-36 (2013).
- Nishimura, T., et al. Generation of rejuvenated antigen-specific T cells by reprogramming to pluripotency and redifferentiation. Cell Stem Cell. 12 (1), 114-126 (2013).
- Takada, K., Kondo, K., Takahama, Y. Generation of Peptides That Promote Positive Selection in the Thymus. Journal of Immunology. 198 (6), 2215-2222 (2017).
- Yamagata, T., Mathis, D., Benoist, C. Self-reactivity in thymic double-positive cells commits cells to a CD8 alpha alpha lineage with characteristics of innate immune cells. Nature Immunology. 5 (6), 597-605 (2004).
- Themeli, M., et al. Generation of tumor-targeted human T lymphocytes from induced pluripotent stem cells for cancer therapy. Nature Biotechnology. 31 (10), 928-933 (2013).
- Serwold, T., Hochedlinger, K., Inlay, M. A., Jaenisch, R., Weissman, I. L. Early TCR expression and aberrant T cell development in mice with endogenous prerearranged T cell receptor genes. Journal of Immunology. 179 (2), 928-938 (2007).
- Lei, F., et al. In vivo programming of tumor antigen-specific T lymphocytes from pluripotent stem cells to promote cancer immunosurveillance. Cancer Research. 71 (14), 4742-4747 (2011).
- Maeda, T., et al. Regeneration of CD8alphabeta T Cells from T-cell-Derived iPSC Imparts Potent Tumor Antigen-Specific Cytotoxicity. Cancer Research. 76 (23), 6839-6850 (2016).
- Serwold, T., et al. T-cell receptor-driven lymphomagenesis in mice derived from a reprogrammed T cell. Proceedings of the National Academy of Sciences of the United States of America. 107 (44), 18939-18943 (2010).
- Vizcardo, R., et al. Generation of Tumor Antigen-Specific iPSC-Derived Thymic Emigrants Using a 3D Thymic Culture System. Cell Reports. 22 (12), 3175-3190 (2018).
- Jenkinson, W., Jenkinson, E., Anderson, G. Preparation of 2-dGuo-treated thymus organ cultures. Journal of Visualized Experiments. (18), (2008).
- Hamazaki, Y., Sekai, M., Minato, N. Medullary thymic epithelial stem cells: role in thymic epithelial cell maintenance and thymic involution. Immunological Reviews. 271 (1), 38-55 (2016).
- Vivier, E., et al. Innate or adaptive immunity? The example of natural killer cells. Science. 331 (6013), 44-49 (2011).
- Rosen, S. D. Ligands for L-selectin: homing, inflammation, and beyond. Annual Review of Immunology. 22, 129-156 (2004).
- Hogquist, K. A., Xing, Y., Hsu, F. C., Shapiro, V. S. T Cell Adolescence: Maturation Events Beyond Positive Selection. Journal of Immunology. 195 (4), 1351-1357 (2015).
- Best, J. A., et al. Transcriptional insights into the CD8(+) T cell response to infection and memory T cell formation. Nature Immunology. 14 (4), 404-412 (2013).
- Schmitz, I., Clayton, L. K., Reinherz, E. L. Gene expression analysis of thymocyte selection in vivo. International Immunology. 15 (10), 1237-1248 (2003).
- Nitta, T., Ohigashi, I., Takahama, Y. The development of T lymphocytes in fetal thymus organ culture. Methods in Molecular Biology. 946, 85-102 (2013).
- Ueno, T., et al. Role for CCR7 ligands in the emigration of newly generated T lymphocytes from the neonatal thymus. Immunity. 16 (2), 205-218 (2002).
- Watanabe, Y., Katsura, Y. Development of T cell receptor alpha beta-bearing T cells in the submersion organ culture of murine fetal thymus at high oxygen concentration. European Journal of Immunology. 23 (1), 200-205 (1993).
Reprints and Permissions
