The zebrafish is a model system that has many valuable features including optical clarity, rapid external development, and, of particular importance to the field of hearing and balance, externally located sensory hair cells. This article outlines how transgenic zebrafish can be used to assay both hair-cell mechanosensation and presynaptic function in toto.
Method Article
In Vivo Calcium Imaging of Lateral-line Hair Cells in Larval Zebrafish
In This Article
Summary
Abstract
Sensory hair cells are mechanoreceptors found in the inner ear that are required for hearing and balance. Hair cells are activated in response to sensory stimuli that mechanically deflect apical protrusions called hair bundles. Deflection opens mechanotransduction (MET) channels in hair bundles, leading to an influx of cations, including calcium. This cation influx depolarizes the cell and opens voltage-gated calcium channels located basally at the hair-cell presynapse. In mammals, hair cells are encased in bone, and it is challenging to functionally assess these activities in vivo. In contrast, larval zebrafish are transparent and possess an externally located lateral-line organ that contains hair cells. These hair cells are functionally and structurally similar to mammalian hair cells and can be functionally assessed in vivo. This article outlines a technique that utilizes a genetically encoded calcium indicator (GECI), GCaMP6s, to measure stimulus-evoked calcium signals in zebrafish lateral-line hair cells. GCaMP6s can be used, along with confocal imaging, to measure in vivo calcium signals at the apex and base of lateral-line hair cells. These signals provide a real-time, quantifiable readout of both mechanosensation- and presynapse-dependent calcium activities within these hair cells. These calcium signals also provide important functional information regarding how hair cells detect and transmit sensory stimuli. Overall, this technique generates useful data about relative changes in calcium activity in vivo. It is less well-suited for quantification of the absolute magnitude of calcium changes. This in vivo technique is sensitive to motion artifacts. A reasonable amount of practice and skill are required for proper positioning, immobilization, and stimulation of larvae. Ultimately, when properly executed, the protocol outlined in this article provides a powerful way to collect valuable information about the activity of hair-cells in their natural, fully integrated states within a live animal.
Introduction
Functional calcium imaging is a powerful tool that can be used to monitor the activity of many cells simultaneously1. In particular, calcium imaging using genetically encoded calcium indicators (GECIs) has been shown to be advantageous because GECIs can be expressed in specific cell types and localized subcellularly2. In neuroscience research, these features have made calcium imaging using GECIs a powerful method to both define activity patterns within neuronal networks and measure calcium influx at individual synapses3,4. Taking advantage of these features, a recent study used confocal microscopy and GECIs to monitor subcellular activity within collections of sensory hair cells5.
Hair cells are the mechanoreceptors that detect sound and vestibular stimuli in the inner ear and local water movement in the lateral-line system in aquatic vetebrates6,7. Hair cells are often the target of damage or genetic mutations that result in the most common form of hearing loss in humans known as sensorineural hearing loss8,9. Therefore, it is critical to understand how these cells function in order to understand how to treat and prevent hearing loss. To properly function, hair cells utilize two specialized structures called mechanosensory-hair bundles and synaptic ribbons to detect and transmit stimuli, respectively. Hair bundles are located at the apex of hair cells and are made up primarily of fine, hair-like protrusions known as stereocilia (Figure 1A). In vestibular and lateral-line hair cells, each hair bundle also has a single long kinocilium (the cell's only true cilium), which can extend far above the stereocilia (Figure 1A). Mechanosensory stimuli deflect hair bundles, and deflection puts tension on linkages called "tip-links" that interconnect stereocilia10. This tension opens mechanotransduction (MET) channels located in the stereocilia, resulting in an apical influx of cations, including calcium11,12. This apical activity ultimately depolarizes the hair cell and opens voltage-gated calcium channels (Cav1.3) at the base of the cell. Cav1.3 channels are found adjacent to synaptic ribbons, a presynaptic structure that tethers vesicles at active zones. Basal calcium influx through Cav1.3 channels is required for vesicle fusion, neurotransmission, and activation of afferent neurons13,14.
For many years, electrophysiological techniques such as whole-cell patch clamping have been used to probe the functional properties of hair cells in many species, including zebrafish15,16,17,18,19,20. These electrophysiological recordings have been particularly valuable in the hearing and balance fields because they can be used to obtain extremely sensitive measurements from individual sensory cells, whose purpose is to encode extremely fast stimuli over a wide range of frequencies and intensities21,22. Unfortunately, whole-cell recordings cannot measure the activity of populations of hair cells. To study the activity of populations of cells in the zebrafish lateral-line, microphonic potentials and afferent action potentials have been used to measure the summed mechanosensitive and postsynaptic response properties of individual neuromasts23,24. Unfortunately, neither whole-cell recordings nor local field potential measurements have the spatial resolution to pinpoint where activity is occurring within individual cells or measure the activity of each cell within a population. More recently, calcium dyes and GECIs have been employed to bypass these challenges25,26.
In zebrafish, GECIs have proven to be a powerful approach to examining hair-cell function due to the relative ease of creating transgenic zebrafish and the optical clarity of larvae27. In zebrafish larvae, hair cells are present in the inner ear as well as the lateral-line system. The lateral line is made up of rosette-like clusters of hair cells called neuromasts that are used to detect local changes in water movement (Figure 1). The lateral line is particularly useful because it is located externally along the surface of the fish. This access has made it possible to stimulate hair cells and measure calcium signals optically in intact larvae. Overall, the ease of transgenesis, transparency of the larvae, and the unparalleled access of lateral-line hair cells have made zebrafish an invaluable model to study the activity of hair cells in vivo. This is a significant advantage compared to mammalian systems in which hair cells are surrounded by bony structures of the inner ear. This lack of access has made it very difficult to acquire functional in vivo measurements of mammalian hair cells.
The protocol outlined here describes how to monitor MET channel- and presynapse-dependent changes in calcium within individual hair cells and among cells within neuromasts in larval zebrafish. This protocol utilizes an established transgenic zebrafish line that expresses a membrane-localized GCaMP6s under the control of the hair-cell specific myosin6b promoter28. This membrane localization positions GCaMP6s to detect calcium influx through ion channels located in the plasma membrane that are critical for hair-cell function. For example, membrane-localized GCaMP6s can detect calcium influx through MET channels in apical hair bundles and through CaV1.3 channels near synaptic ribbons at the base of the cell. This contrasts with using GECIs localized in the cytosol, as cytosolic GECIs detect calcium signals that are a combination of MET and CaV1.3 channel activity as well as calcium contributions from other sources (e.g., store release). This protocol outlines how to immobilize and paralyze GCaMP6s transgenic larvae prior to imaging. It then describes how to prepare and use a fluid-jet to deflect the hair bundles to stimulate lateral-line hair cells in a controlled and reproducible manner. Representative data that can be achieved using this protocol are presented. Examples of data that represent movement artifacts are also presented. Control experiments that are used to verify results and exclude artifacts are described. Lastly, a method to visualize spatial calcium signals in the Fiji software is described. This Fiji analysis is adapted from previously established visualization methods developed using MATLAB5. Overall, this protocol outlines a powerful preparation technique that uses GECIs in larval zebrafish to measure and visualize hair-cell calcium dynamics in vivo.
Protocol
All animal work was approved by the Animal Use Committee at the National Institutes of Health under animal study protocol #1362-13.
NOTE: This protocol takes approximately 0.5 to 1 h to complete with no interruptions if the solutions and equipment are prepared and set up in advance. This protocol is optimized for Tg(myo6b:GCaMP6s-caax)5,29 zebrafish larvae at 3–7 days post-fertilization (dpf). This transgenic line expresses a membrane-localized GCaMP6s (zebrafish codon-optimized) specifically in all zebrafish hair cells. Prior to imaging, larvae are raised in the embryo buffer (E3) under standard conditions. Refer to the Table of Materials for catalog numbers of all equipment and drugs required to execute this protocol.
1. Preparation of Solutions
- Prepare 1 mL of α-bungarotoxin (125 µM), which is used to paralyze zebrafish larvae during functional imaging.
- Add 968.6 µL of ultrapure sterile water and 33.4 µL of phenol red to 1 mg of α-bungarotoxin (entire bottle). Make 100 µL aliquots and store them at -20 °C.
CAUTION: Wear gloves and make preparations in the hood when handling α-bungarotoxin powder. Gloves are also recommended when handling the α-bungarotoxin solution.
- Add 968.6 µL of ultrapure sterile water and 33.4 µL of phenol red to 1 mg of α-bungarotoxin (entire bottle). Make 100 µL aliquots and store them at -20 °C.
- Prepare 1 L of 60x embryo buffer (E3).
- Add 17.2 g of NaCl and 0.76 g of KCl powder to 954.4 mL of ultrapure water.
- Add 19.8 mL of 1 M CaCl2, 19.8 mL of 1 M MgSO4, and 6 mL of 1 M HEPES buffer to the solution. Store the 60x E3 stock solution at 4 °C for up to 6 months.
- Prepare 10 L of 1x E3 (5 mM NaCl; 0.17 mM KCl; 0.33 mM CaCl2; 0.33 mM MgSO4, pH 7.2), which is a solution that larvae are propagated in prior to functional imaging.
- Add 167 mL of 60x E3 stock solution to 10 L of ultrapure water to make a 1x E3 solution. Store the 1x E3 solution at room temperature (RT) for up to 6 months.
- Prepare neuronal buffer (NB) (140 mM NaCl; 2 mM KCl; 2 mM CaCl2; 1 mM MgCl2; 10 mM HEPES buffer, pH 7.3), which is used to immerse larvae during functional imaging.
NOTE: 1x E3 can also be used for functional imaging, but responses are more robust and reliable in NB.- Combine 28 mL of 5 M NaCl, 2 mL of 1 M KCl, 2 mL of 1 M CaCl2, 1 mL of 1 M MgCl2, and 10 mL of 1 M HEPES buffer with 957 mL of ultrapure water. Bring the pH to 7.3 with 1 M NaOH.
- Filter sterilize. Store at 4 °C for up to 1 month.
NOTE: Bring to RT before using solution.
- Prepare MS-222 stock (tricaine, 0.4%), which is used to anesthetize larvae.
- Dissolve 400 mg of ethyl 3-aminobenzoate methanesulfonate salt and 800 mg of Na2HPO4 in 100 mL of distilled water. Adjust the pH to 7. Store at 4 °C.
- Use 0.04% MS-222 to anesthetize larvae during immobilization and α-bungarotoxin injection.
2. Preparation of Imaging Chamber and Pins
- Prepare the imaging chamber (Figure 2A). Apply a thin layer of high vacuum silicone grease to the bottom of the perfusion chamber along the edges of the square to which the coverslip will adhere. Do not leave gaps in the grease. Firmly press down around the edges of the coverslip to seal it to the imaging chamber. Wipe away excess grease.
NOTE: A 5 mL syringe with a 200 µL micropipette tip is recommended for grease application. - Prepare the silicone encapsulant to fill the chamber. Mix a 10:1 ratio (by weight) of base to curing agent. Mix thoroughly but gently, using a micropipette tip to create minimal bubbles.
- Pour the silicone encapsulant onto the affixed coverslip so that it is level with the surface of the chamber. Approximately 3 g of encapsulant will fill the chamber.
- Carefully tap the chamber against a flat surface while keeping it horizontal, or use a micropipette tip (under a stereomicroscope) to remove or pull bubbles to the edge of the chamber.
- Place the chamber in a laboratory oven overnight at 60–70 °C. Place the chamber inside of a ventilated box to ensure that hot air is not directly blowing on the encapsulant to avoid creating ripples.
- Use fine forceps and tungsten wire to fashion the pins used to immobilize larvae through the head and tail (Figure 2B1) on the hardened encapsulant.
- To make head pins, hold a piece of 0.035 mm tungsten wire in one hand under a stereomicroscope. Using fine forceps in the other hand, bend the wire 1 mm up from the end at 90°. Exchange the forceps for fine scissors and cut 1 mm after the bend to create the pin.
- Repeat step 2.3.1 using a 0.025 mm wire to make tail pins, but leave 0.5 mm of wire on either side of the bend. Use forceps to insert the pins into the hardened encapsulant on the chamber (for storage).
3. Preparation of Needles for Paralysis and Stimulation
- Prepare heart injection needles using glass capillaries with a filament. Pull needles to an inner tip diameter of 1–3 µm (Figure 2C).
- Prepare fluid-jet needles using glass capillaries without a filament. Pull needles with a thin, long tip that can be broken to the correct tip diameter.
- Break off the thin, long tip of the fluid-jet needle by rubbing it perpendicularly against another fluid-jet needle or a ceramic tile just above where the needle tip can be bent to create an inner tip diameter of 30–50 µm [Figure 2C (middle image) and Figure 3A2]. Ensure that the break is even across the tip (Figure 2C, middle image) and not jagged or too large (Figure 2C, right image) to guarantee even and accurate fluid flow during hair-cell stimulation.
NOTE: A needle polisher can be used to fix jagged breaks.
- Break off the thin, long tip of the fluid-jet needle by rubbing it perpendicularly against another fluid-jet needle or a ceramic tile just above where the needle tip can be bent to create an inner tip diameter of 30–50 µm [Figure 2C (middle image) and Figure 3A2]. Ensure that the break is even across the tip (Figure 2C, middle image) and not jagged or too large (Figure 2C, right image) to guarantee even and accurate fluid flow during hair-cell stimulation.
4. Pinning and Immobilizing Larva to Imaging Chamber
- Bathe a Tg(myo6b:GCaMP6s-caax) larva in approximately 1 mL of E3 buffer containing 0.04% MS-222 for 1–2 min on the silicone encapsulant surface of the imaging chamber until the larva becomes immobile or unresponsive to touch.
- Under a stereomicroscope, position the larva at the center of the perfusion chamber so it lies flat on its side against the silicone encapsulant.
NOTE: For consistency, always mount larvae on the same side (e.g., right side down, left side up) (Figure 2B1).
- Under a stereomicroscope, position the larva at the center of the perfusion chamber so it lies flat on its side against the silicone encapsulant.
- Using fine forceps, bring a 0.035 mm head pin down perpendicular to the larva and chamber. Insert the head pin between the eye and otic vesicle and down into the encapsulant (Figures 2B1 and 2B2). Use a second set of forceps to stabilize the larva along its dorsal or ventral side while pinning. Ensure that the horizontal part of the pin contacts the larva and does not press all the way into the encapsulant. Angle the pin ventrally (Figure 2B1) or pointing slightly toward the anterior of the fish to avoid interfering with subsequent heart injection and hair-cell imaging.
- Using the forceps, insert a 0.025 mm tail pin into the notochord as close as possible to the end of the tail (Figure 2B1).
NOTE: Be careful to avoid stretching the larva. Pin the larva flat. Eyes should be superimposed (Figure 2B1). This is very important for ease of heart injection (Figure 2B2-B2', step 5), facilitating a desirable imaging plane (Figure 1B1-B2'', steps 8 and 9), and quantifying the intensity of the fluid-jet stimulus (Figure 3A3, step 7).
- Using the forceps, insert a 0.025 mm tail pin into the notochord as close as possible to the end of the tail (Figure 2B1).
5. Injection of α-Bungarotoxin into the Heart Cavity to Paralyze Larva
NOTE: Wear gloves when handling α-bungarotoxin.
- Centrifuge the α-bungarotoxin aliquot briefly prior to use to prevent clogging of the heart injection needle.
- Backfill 3 µL of α-bungarotoxin solution into a heart injection needle using a gel loading pipette tip. Load the solution evenly to the tip with no bubbles.
- Insert the heart injection needle into a pipette holder attached to a manual micromanipulator. Under a stereomicroscope, position the needle so it is aligned perpendicular to the A-P axis of the pinned and anesthetized larvae, pointing down at an angle of ~30°.
- Connect the pipette holder to the pressure injector. Apply the following suggested settings: Pinjection = 100 hPa, tinjection = 0.5 s, and Pcompensation = 5 hPa. Inject a bolus into the solution to test whether the needle tip is patent.
- Look for a small puff of the red solution (from phenol red) to leave the tip of the needle. If no red color is seen, very gently scrape the needle tip against the edge of a pin and try again until the needle is patent. Alternatively, pull a needle with a larger tip opening.
- Advance the needle toward the heart until it touches the skin outside of the heart (Figure 2B2). Press the needle into the larva and look for indentation of the pigment cell on the skin in front of the heart to ensure that needle is positioned in the correct plane relative to the larva (Figure 2B2').
- Advance the needle further until it pierces the skin and enters the heart cavity. Pull the needle back slightly. Inject a bolus of α-bungarotoxin into the heart cavity. Look for inflation of the heart cavity or for red dye entering the cavity.
- Gently rinse the larva 3 times with 1 mL of NB to remove residual MS-222. Never remove all of the fluid. Maintain larva in approximately 1 mL of NB on the perfusion chamber.
NOTE: Ensure that larval heart beat and blood flow remain robust after pinning and heart injection and throughout the entire imaging experiment.
6. Preparation of Microscope and Fluid-jet Setup
- Assemble an upright confocal microscope using the components described in the Table of Materials: a confocal microscope with a 488 nm laser and appropriate filters, microscope software to control and coordinate imaging and stimulation, 10x air objective, 60x water objective, piezo-Z objective scanner (for z-stacks), high-speed camera, circular chamber adaptor, motorized stage, and stage insert adaptor. Refer to Zhang et al.29 for additional options and guidance on microscope setups.
- Assemble the fluid jet made up of 3 main components: a vacuum and pressure pump, high-speed pressure clamp, and head stage (also described in the Table of Materials). Use the high-speed pressure clamp to control the timing and duration of pressure or vacuum discharge out of the heads stage and into the fluid-jet pipette.
- Connect the output of the head stage to the fluid-jet pipette holder via thick-walled silicone tubing.
7. Alignment of Larva and Fluid-jet
NOTE: There are 3 planes of interest within each neuromast: (1) the tips of the hair bundles (Figure 3A3: the kinocilia, used to measure stimulus intensity); (2) the hair-bundle MET plane (Figure 1B1-B1': the base of the apical hair bundles where MET-channel-dependent calcium signals are detected); and (3) the synaptic plane (Figure 1B2-B2': where presynaptic calcium signals are detected at the base of the hair cell). These planes are outlined in Figure 1A.
- Backfill 10 µL of NB into a properly broken fluid-jet needle (from step 3.2) using a gel loading tip. Load the solution evenly to the tip with no bubbles. Insert the needle into the pipette holder attached to the motorized micromanipulator.
- Place the perfusion chamber into a circular chamber adapter on the microscope stage.
NOTE: For consistency, always position the larva in the same orientation (e.g., the chamber containing the larva with its posterior toward fluid jet and ventral side facing toward the experimenter).- Move the motorized stage so that the larva is in the center of the field of view. Turn the circular chamber adaptor so that the A-P axis of the larva is roughly aligned with the trajectory of the fluid-jet needle.
- Using transmitted light and differential interference contrast (DIC), bring the larva into focus and center it under the 10x objective. Raise the 10x objective.
- Using the motorized micromanipulator, bring the fluid-jet needle down into the center of the field of view so it is illuminated by the transmitted light and barely touching the NB solution.
- Lower the 10x objective. Focus on the larva to confirm its location. Focus up to find the fluid-jet needle. Move the fluid-jet needle with the micromanipulator in the x- and y-axes until it is in a position parallel to the dorsal side of the fish.
- Focus back on the larva. Bring the needle down in the z-axis. Position the needle along the dorsal side of the fish and ~1 mm away from the body (Figure 3A1).
- Carefully move the circular chamber adaptor (if necessary) to ensure that the fluid-jet needle is aligned along the A-P midline of the larva (Figure 3A1).
- Move the motorized stage to place the neuromast of interest in the center of the field of view. Keep the fluid-jet needle tip along the dorsal side of the fish. Do not touch the tip of the fluid-jet needle to the larva or the chamber surface.
- Switch to the 60x water objective. Ensure that the objective is immersed in the NB solution. Use the fine focus to locate a neuromast using transmitted light and DIC optics.
NOTE: This setup is designed to stimulate neuromasts along the primary posterior lateral line. Hair cells within these neuromasts respond to either anterior or posterior directed fluid flow. See Chou et al.31 for an accurate map of neuromast fluid sensitivity within the lateral-line system.- Position the fluid-jet needle with the micromanipulator so that it is 100 µm from the outer edge of the neuromast (Figure 3A2).
NOTE: Choose neuromasts that offer clear top-down views (Figures 1B1'-B2' and Figure 3A3) rather than side-angled views (Figure 1C1-C2). A clear top-down view allows for simultaneous imaging of all apical hair bundles in a single optical plane or imaging of synaptic areas in fewer optical planes (Figure 3A3). - Focus up to the tips of the apical hair-bundles (kinocilia) (Figure 1A, Figures 3A2 and 3A3). The bottom of the fluid-jet needle should be in focus in this plane.
- Position the fluid-jet needle with the micromanipulator so that it is 100 µm from the outer edge of the neuromast (Figure 3A2).
- Set the high-speed pressure clamp from the manual to external mode to receive input from the imaging software.
- Zero the high-speed pressure clamp by pressing the "zero" button. Use the set-point knob to set the resting pressure slightly positive (~2 mmHg). Confirm the resting output of the high-speed pressure clamp using a PSI manometer attached to the head stage output.
NOTE: Set a slightly positive pressure at rest to avoid the gradual uptake of fluid into the fluid-jet needle over time. If fluid enters the tubing connected to the fluid-jet and reaches the head stage, it can damage the equipment. - Determine the pressure needed to stimulate the hair bundles. Use a 0.125 and 0.25 V input (6.25 and 12.5 mmHg) for 200–500 ms to apply a test stimulus (Figure 3A3-A3'').
NOTE: The high-speed pressure clamp converts a voltage input (from software or other devices that connect to the BNC port on the high-speed pressure clamp command port) into pressure that is discharged from the head stage, and ultimately, the fluid-jet needle (1.0 V = 50 mmHg, while -1.0 V = -50 mmHg). In this configuration (see step 7.2) positive pressure (push) deflects hair bundles towards the anterior, and negative pressure (pull) deflects hair bundles towards the posterior. - Using transmitted light and DIC optics along with a scale bar, measure the distance of deflection by the 6.25 and 12.5 mmHg stimuli of the tips of the hair bundles, the kinocilia (Figure 1A and Figures 3A3-3''). Choose a pressure that moves the bundles (as 1 cohesive unit) a distance of approximately 5 µm (Figure 3A3''). Ensure that the tips of the kinocilia remain in focus the entire time.
- Move the fluid-jet ± 25 µm along the A-P axis of the larva to find a distance and pressure that deflects the tips of kinocilia 5 µm.
NOTE: Using GCaMP6s in larvae 3–7 dpf, a 5 µm deflection should achieve near saturating GCaMP6s calcium signals and should not damage apical hair-bundle structures (Figure 3A3''). Smaller displacement distances can be used to deliver non-saturating stimuli (Figure 3A3'). Displacement distances >10 µm are hard to estimate ( Figure 3A3''') and can be damaging over time. Signal saturation is dependent on age of the neuromast (and kinocilial height) as well as the indicator used. Check the patency of the fluid-jet needle in each direction (pressure/push and vacuum/pull) periodically during imaging. Fluid-jet needles clog easily and lose vacuum patency, but they maintain residual pressure patency. Use DIC optics and a short test stimulus in each direction to check for fluid-jet patency. - Focus the sample into the plane of interest (e.g., the base of the apical hair bundles or the base of the hair cell in the synaptic plane; Figure 1B1-B2').
- Zero the high-speed pressure clamp by pressing the "zero" button. Use the set-point knob to set the resting pressure slightly positive (~2 mmHg). Confirm the resting output of the high-speed pressure clamp using a PSI manometer attached to the head stage output.
8. Imaging Acquisition Procedure Option 1: Single-plane Acquisition
NOTE: All imaging outlined in this protocol is performed at RT.
- Set imaging software to acquire a streaming or continuous 80-frame acquisition with a capture every 100 ms to achieve a frame rate of 10 Hz.
- Set gain, aperture, and laser power to optimize signal detection, but avoid saturation, photobleaching, and noise. Example settings for an Opterra/SFC are as follows: 488 nm laser power: 50 (hair-bundle MET plane), 75 (synaptic plane); 35 µm slit; gain = 2.7; EM gain = 3900.
NOTE: Apply 2 X binning if signals are too weak or noisy or have excessive photobleaching. 2 X binning will enhance signal detection at the cost of spatial resolution. - Select a stimulus to deliver during the 80-frame (8 s) acquisition after frame 30, at 3 s.
NOTE: Some example stimuli are as follows: 200 ms (+ or - 0.25 V) up to 2 s (+ or - 0.25 V) step in the anterior or posterior direction to identify the directional sensitivity of each hair cell; 2 s, 5 Hz square wave (0.25 V for 200 ms, -0.25 V for 200 ms, repeated 5 times) to stimulate all hair cells simultaneously. A positive pressure (anterior stimulus) will activate half of the hair cells. A negative pressure (posterior stimulus) will activate the other half of the hair cells. Be sure the stimulus software or device returns the pressure clamp back to 0 V after the stimulus is finished. - Measure mechanosensitive calcium responses. Focus on the base of the apical hair bundles (Figures 1A and 1B1-B1') and start image acquisition.
NOTE: If the neuromast is viewed clearly from the top down (Figure 1B1-B1'), all apical hair bundles can be imaged simultaneously in a single plane. - Measure presynaptic calcium responses. Focus to the base of the hair cells (Figures 1A and 1B2-B2') and start image acquisition.
NOTE: If the neuromast is viewed clearly from the top down (Figure 1B2-B2'), the presynaptic imaging planes of all hair cells can be acquired in 2–3 planes set 2 µm apart. Tg[myo6b:ribeye-mcherry] transgenic fish can be used to identify and locate presynaptic ribbons and sites of calcium entry29.
9. Imaging Acquisition Procedure Option 2: Multi-plane Acquisition
- Tune the piezo-Z attached to the 60x objective for fast acquisitions (12–18 ms). Ensure that max-speed settings are selected.
- Create a Z-stack acquisition using a piezo-Z. Acquire the hair-bundle MET activity in 5 planes with step size of 0.5 µm. Acquire the presynaptic signals in 5 planes with step size of 1 µm.
- Set the frame rate to 10 Hz. Each frame will be captured every 20 ms and each Z-stack every 100 ms.
- Set up the acquisition for 400 frames or 80 Z-stacks at 10 Hz for an 8 s streaming acquisition.
- Set laser power, aperture, and gain to optimize signal detection, but avoid saturation, photobleaching, and noise. Example settings for an Opterra/SFC system are as follows: 488 nm laser power: 75 (hair-bundle MET plane), 125 (synaptic plane); 35 µm slit; gain = 2.7; EM gain = 3900.
NOTE: Apply 2 X binning if signals are too weak,noisy, or have excessive photobleaching. 2 X binning will enhance signal detection at the cost of spatial resolution. - Select a stimulus to deliver during the acquisition starting at frame 150, after 3 s.
- Continue the protocol as described above for single plane acquisition, but center the Z-stack in the apical or basal planes (steps 8.4 and 8.5).
10. Control: Pharmacological Block of All Evoked Calcium Signals
NOTE: BAPTA (1,2-bis(o-aminophenoxy)ethane-N,N,N′,N′-tetraacetic acid) treatment is a critical control when first establishing this protocol.
- After completing steps 8 or 9, replace the NB with 1 mL of NB containing 5 mM BAPTA to cleave the tip links required to gate apical MET channels located in hair bundles.
- Incubate for 10–20 min at RT.
- Wash off BAPTA 3 times with 1 mL of NB.
- Repeat step 8 or 9. After BAPTA treatment, there should be no change in GCaMP6s fluorescence in response to fluid-jet stimulation in either the apical hair bundles or synaptic plane. If changes in GCaMP6s fluorescence persist, these are not true calcium signals and may be motion artifacts.
11. Control: Pharmacological Block of Presynaptic Calcium Signals (Optional)
- After completing steps 8 or 9, replace the NB with NB containing 10 µM isradipine with 0.1% dimethyl sulfoxide (DMSO) to block the L-type calcium channels at the hair-cell presynapse.
- Incubate for 10 min at RT.
- Without performing a wash, repeat step 8 or 9. After treatment, there should still be GCaMP6s fluorescence changes in response to fluid-jet stimulation in apical hair-bundles but not the synaptic plane. If changes in GCaMP6s fluorescence persist in the synaptic plane, these are not true calcium signals and may be motion artifacts.
12. Image Processing and Graphical Representation of Data
NOTE: Use Fiji (steps 12.1–12.1.5) and a graphing program (steps 12.2–12.2.3) for step 12. StackReg, TurboReg (step 12.1.3), Time Series Analyzer V3 (steps 12.1.4–12.1.6), and Fiji plugins are also required (see Table of Materials).
- Open an image sequence in Fiji, either a single-plane time series (80-frame single plane) or Z-stack time series (400-frame multi plane). Click on "File," select "Import" from the drop-down menu, and click on "Image Sequence."
- For a Z-stack times series, Z-project each time point (5 planes per timepoint) to create an 80-frame image sequence. Click on "Image," select "Stacks" from the drop-down menu, select "Tools" from the drop-down menu, and click on "Grouped Z-project." Select "Average Intensity" as the Projection method, and enter "5" for "Group size".
NOTE: Each plane within the Z-stack can be analyzed separately for additional spatial information. - Remove the first 1 s (10 frames) from the 8 s (80 frames) of image acquisition. Click on "Image," select "Stacks" from the drop-down menu, select "Tools" from the drop-down menu, and click on "Make Substack." Enter "11-80" for "Slices".
NOTE: This substack will be referred to as stk1. - Register the image sequence (stk1) using the StackReg plugin32. Click on "Plugins," select "StackReg", and select "Translation" as the method of registration for the 70-frame time series.
NOTE: This registered substack will be referred to as stk2. - Use the Times Series Analyzer V3 plugin to extract the GCaMP6 intensity (F) measurements. Place a region of interest (ROI) on apical hair bundles or presynaptic sites in stk2. Refer to the ImageJ website (see Table of Materials for the link) for instructions on how to use Time Series Analyzer V3.
NOTE: Use a circular 1–2 µm ROI for apical hair bundles and a circular 3–5 µm ROI for the synaptic plane (Figures 4A1 and 4A2). - Select the measurement parameters. Click on "Analyze," select "Set Measurement," and ensure that only "Mean gray value" is selected.
- In the ROI manager, select all ROIs and use the multi-measure function to generate (F) intensity values for each ROI in the time series. Within ROI Manager, click "More >> ," and select "Multi Measure" from the drop-down menu.
- For a Z-stack times series, Z-project each time point (5 planes per timepoint) to create an 80-frame image sequence. Click on "Image," select "Stacks" from the drop-down menu, select "Tools" from the drop-down menu, and click on "Grouped Z-project." Select "Average Intensity" as the Projection method, and enter "5" for "Group size".
- Plot (F) values. Paste the values (F) from the "Multi Measure" Results into a graphing program to create an X-Y graph (Figures 4A1' and 4A2').
NOTE: Create (X) values manually or use the time stamp from the metadata.- Quantify the baseline (Fo) for each ROI by averaging the (F) values in the graphing program from the pre-stimulus frames 1–20.
- For each ROI, subtract the (Fo) from the (F) values at each timepoint to create ΔF (F-Fo) values. Replot, if desired.
- Calculate and plot ΔF/Fo. For each ROI, divide the ΔF measurement by (Fo) and replot (Figures 4A1'' and 4A2'').
13. Image Processing and Heat Map Representation of Spatio-temporal Calcium Signals
NOTE: Previous work to create spatial heat map representation of calcium signals in zebrafish lateral-line hair cells have used custom software written in in Matlab5,28. This analysis has been adapted for the open source analysis software Fiji33. Use Fiji for all steps outlined below. StackReg and TurboReg Fiji plugins are also required (see Table of Materials).
- Perform steps 12.1–12.1.3 for each Z-stack or single plane time series to create the registered substack referred to as stk2.
- Use stk2 to create a baseline image. Click on "Image," select "Stacks" from the drop-down menu, and select "Z Project". Select "Average Intensity" for "Projection type", and enter "1" for "Start slice" and "20" for "Stop slice".
NOTE: This Z-projection will be referred to as baselineIMG.- Temporally bin the 70-frame (F) image sequence (stk2) into 14 0.5-s bins. Click on "Image," select "Stacks" from the drop-down menu, select "Tools" from the drop-down menu, and click on "Grouped Z Project". Select "Average Intensity" as the "Projection method," and enter 5 for "Group size."
NOTE: This grouped Z-projection will be referred to as stk2bin and F in Figure 5. - Subtract the pixel value of baseline (baselineIMG) from the binned (F) image sequence (stk2bin) to create a ΔF image sequence. Click on "Process" and select "Image Calculator" from the drop-down menu. Select stk2bin as "Image1" and baselineIMG as"Image2." Select "Subtract" for "Operation."
NOTE: This baseline-subtracted Z-projection is referred to as stk2binBL and F-BL = ΔF in Figure 5.
- Temporally bin the 70-frame (F) image sequence (stk2) into 14 0.5-s bins. Click on "Image," select "Stacks" from the drop-down menu, select "Tools" from the drop-down menu, and click on "Grouped Z Project". Select "Average Intensity" as the "Projection method," and enter 5 for "Group size."
- Choose a lookup table (LUT) of choice to display ΔF image sequence (stk2binBL). Click on "Image," select "Lookup Tables" from the drop-down menu, and click on a LUT of choice.
NOTE: "Red Hot" is the LUT used in Figure 5. This baseline-subtracted Z-projection with LUT is referred to as stk2binBL-LUT and ΔF LUT in Figure 5.- Set the minimum (min) and maximum (max) brightness values for stk2binBL-LUT. Click on "Image," select "Adjust," and click on "Brightness/Contrast". Set the min value to remove background noise from stk2binBL-LUT. Set the max values to retain signals of interest but avoid signal saturation [e.g., 200 to 1600 (12-bit image intensity range = 0 to 4095)].
NOTE: Use the same min and max values when making visual comparisons or representations. A ΔF calibration LUT bar can be generated in Fiji for each LUT image sequence (e.g., stk2binBL-LUT). Click on "Analyze," select "Tools," and click on "Calibration Bar". Unclick "Overlay" to generate a separate, individual image with the LUT calibration bar for reference. - Convert both the ΔF (stk2binBL-LUT)with the desired LUTand the temporally binned (F) image (stk2bin) sequences to RGB. Click on "Image," select "Type," and click on "RGB Color."
NOTE: The RGB-converted Z-projections will be referred to as stk2binBL-LUT-RGB and stk2bin-RGB, respectively.
- Set the minimum (min) and maximum (max) brightness values for stk2binBL-LUT. Click on "Image," select "Adjust," and click on "Brightness/Contrast". Set the min value to remove background noise from stk2binBL-LUT. Set the max values to retain signals of interest but avoid signal saturation [e.g., 200 to 1600 (12-bit image intensity range = 0 to 4095)].
- Overlay the ΔF LUT images (stk2binBL-LUT-RGB) onto binned (F) images (stk2bin-RGB). Click on "Process" and then "Image Calculator". Select stk2bin-RGB as Image1 and stk2binBL-LUT-RGB as Image2. Select "Transparent-zero" for "Operation".
NOTE: If there is too much noise or background in the ΔF LUT overlay, repeat step 13.3 to increase the min value. If there is saturation, repeat step 13.3 and increase the max value.
14. Image Processing and Spatio-temporal Heat Map Representation Using a Fiji Macro
NOTE: The following section refers to a Fiji macro called LUToverlay based on step 13 that will automatically create spatial heat map representation of GCaMP6s signals. This analysis requires the open source analysis software Fiji33 and the StackReg and TurboReg Fiji plugins (see Table of Materials).
- Download the Fiji LUT overlay macro (LUToverlay.ijm) accompanying this protocol (see Supplemental Coding File).
- Open either a multi-plane time series or single-plane time series (see step 12.1).
- Click on "Plugins," select "Macros," click on "Run," and select the LUToverlay macro. A dialog box will appear with the text, "Tell me about your image acquisition".
NOTE: For the dialog box, the numbers present are suggested values and can be changed according to the setup used by the experimenter. The values listed in the box and below are set for a multi-plane time series with 400 images and 5 planes per timepoint (step 9). - After "Number of planes per timepoint", enter the number of planes per timepoint (e.g., for step 12.1.1 using a multi-plane 400 time series with 5 planes per timepoint, enter "5"). For a single plane acquisition (e.g., step 8) enter "1".
NOTE: In the remaining dialog boxes, for a multi-plane time series, "Timepoints" refers to the number images in the projected Z-stack (e.g., for step 12.1.1 this is 80 timepoints).- Use the "Define the range to analyze" option to remove the first 1 s of the image sequence (e.g., for step 12.1.2 select "11-80" to remove the first 10 frames and first 1 s).
- After "Define timepoints in baseline", enter the number of images to be used to create the baseline image [e.g., for step 13.2., enter "20" to use the pre-stimulus images (11-30)].
- After "Timepoints per temporal bin" enter the number of images to bin for the overlay. (e.g., for step 13.2.2. select "5" to create 14 0.5-s bins).
- After "Min intensity" and "Max intensity" enter the minimum and maximum brightness values that will remove background noise (minimum) and retain signals of interest while avoiding saturation (maximum).
- After "Choose a lookup table", select the LUT desired for the overlay. Click "OK".
NOTE: The macro will finish analyzing the images according to the instructions presented in step 13. The images generated by the macro will also be named according to the instructions in step 13.
- Close all analysis windows before processing a new image sequence.
Results
After myo6b:GCaMP6s-caax transgenic fish are properly immobilized and the fluid-jet stimulus is delivered to lateral-line hair cells, robust calcium signals can be visualized and measured (Figures 4 and 5, taken at 2 X binning). During fluid-jet stimulation, calcium signals can either be measured in the apical hair bundles, where MET channels open in response to stimuli, or at the base of hair cells, where presynaptic Cav1.3 calcium channels trigger neurotransmission. A representative example of calcium responses in these regions with an individual neuromast are shown in Figure 4A1-A2''. In this example, a 2-s 5 Hz fluid-jet stimulus was delivered to activate all hair cells within the representative neuromast. During the stimulus, robust calcium signals can be detected in hair bundles (Figure 4A1-A1'', responses from 8 hair bundles are shown). In this system, nearly all mature hair cells display this apical influx of calcium5. In contrast, within the same neuromast, there are detectable calcium signals in the basal, synaptic plane in only a subset (~30%) of hair cells (Figure 4A2-A2'', 4 cells with presynaptic responses are shown)5. The 4 green ROIs show cells with no significant presynaptic calcium signals (Figure 4A2-A2'') despite robust apical calcium signals (Figure 4A1-A1''). In this representative example (Figure 4A1-A2''), colored ROIs match up hair bundles in the apical MET plane (Figure 4A1) with their cell bodies in the basal synaptic plane (Figure 4A2). This example highlights how both MET dependent- and presynaptic-calcium signals can be measured within individual hair cells and among populations of hair cells.
The calcium signals in both the hair bundles and at the presynapse can be plotted graphically as either raw (F) GCaMP6s intensity or ΔF/Fo GCaMP6s intensity (see step 12, Figures 4A1'-A1'' and 4A2'-A2''). The (F) GaMP6s graphs highlight that the baseline fluorescence intensity for each cell can differ (Figures 4A1' and 4A2'). In the ΔF/Fo GCaMP6s graphs, each cell is normalized to its baseline value and the relative intensity change from baseline is plotted (Figures 4A1'' and 4A2''). In both the (F) and ΔF/Fo GCaMP6s plots, the calcium signals in both the apical hair bundle and basal presynaptic plane initiate with the onset of the stimulus (gray box) and decline exponentially after the stimulus ends. During the stimulus, calcium signals in hair bundles rise rapidly and saturate if the strength of the deflection does not change (Figure 4A1-A1''). In contrast, within the subset of hair cells with detectable calcium signals in the synaptic plane, the calcium signals increase more gradually and are less prone to saturation (Figure 4A2-A2''). In hair cells without presynaptic calcium signals (green ROIs), the calcium signals remain near baseline.
In addition to these graphical representations (Figure 4), calcium signals can be visualized spatially within the entire neuromast during the time course of the recording. An example of a spatiotemporal representation is shown in Figure 5 for presynaptic GCaMP6s signals in the basal plane of a neuromast. In Figure 5, the main steps to process an image sequence for spatial visualization are outlined as described in step 13. First, the raw (F) GCaMP6s images are temporally binned [Figure 5: row 1 (5 of the 14 bins are shown); step 13.2.1]. Then, the baseline image, calculated from pre-stimulus frames (step 13.2), is subtracted from the (F) GCaMP6s fluorescence signals to obtain ΔF images (Figure 5: row 2; step 13.2.2). Next, the ΔF grayscale images are converted to a color LUT (Figure 5: row 3, Red Hot LUT; step 13.3). Finally, the ΔF images with the LUT conversion are overlaid onto the temporally binned (F) images (Figure 5, first row) to reveal the spatiotemporal signals within the neuromast during stimulation (Figure 5: row 4; step 13.4). The heat maps of ΔF GCaMP6s signals provide both valuable spatial and temporal information that is not easy to parse out from single ROIs and the graphs used in Figure 4. Heat maps can help visualize critical spatiotemporal information, including subcellular information regarding the onset and duration of calcium signals within each hair cell as well as the timing and intensity differences among hair cells within the entire neuromast.
It is important to verify that the graphs and spatial heat maps represent true calcium signals and are not artifacts due to motion. In this protocol, motion artifacts can be the result of excessive drift or movement of the larva or motion due to fluid-jet stimulation. All of these artifacts are challenging to completely eliminate in this in vivo preparation. While registration of image sequences (step 12.1.3) can correct for the majority of movement in x- and y-axes, image sequences with excessive movement in the z-axis must be identified and removed from analyses. Motion artifacts are easiest to identify by graphing the calcium signals. Examples of GCaMP6s intensity changes that are artifacts and are not true GCaMP6s signals can be observed at the apex (Figure 4B1'-B1'') and base (Figure 4C1'-C1'') of hair cells.
In the apical hair bundles, motion artifacts are common when the fluid-jet stimulus is too strong (Figure 3A3'''). During these excessively strong stimuli, the apical hair-bundle plane can move out of focus during fluid-jet stimulation then return to the original focal plane after the stimulus terminates (Figure 4B1'-B''). This makes it difficult to accurately measure apical MET-dependent calcium signals. An example of hair-bundle motion artifacts can be seen in Figure 4B1'-B1''. Here, the graphs show a decrease in GCaMP6s signals during the stimulus (gray box) when the hair bundles are out-of-focus. After the stimulus ends, the GCaMP6s signals rapidly increase as the hair bundles return to their original position and come back into focus. This contrasts with the example in Figure 4A1'-A1'' in which the apical calcium signals increase at the onset of the stimulus and decrease when the stimulus ends.
While movement due to excessive fluid-jet stimuli can also move the synaptic plane out of focus, this type of motion artifact is less common in this plane. Instead, changes in focus in the Z-axis due to movement or drift of the larva are the most common causes of motion artifacts. Larval motion or drift can affect GCaMP6s measurements at both the apex and base of hair cells. An example of larval motion that increases GCaMP6s in the basal, synaptic plane during the stimulus is shown in Figure 4C'-C''. Motion artifacts (Figure 4C1'-C1'') can be distinguished from true presynaptic signals (Figure 4A2'-A2'') by examining the time course of the GCaMP6s signals. Rather than increasing and decreasing exponentially with the stimulus (Figure 4A2'-A2''), the motion-induced increases in GCaMP6s signal have a square shape and rise and fall abruptly with the onset and offset of the stimulus, respectively (Figure 4C1'-C1'').
In addition to careful examination of the time course of GCaMP6s signals, control experiments using pharmacology can be used to differentiate true GCaMP6s signals from motion artifacts. For example, BAPTA (step 10) can be applied to cleave the tip-links that are required for MET-channel function in hair bundles. BAPTA should eliminate both fluid-jet-evoked apical MET-channel-dependent calcium influx as well as the subsequent basal, presynaptic calcium influx through Cav1.3 channels. In the representative example of true stimulus-evoked calcium signals (Figure 4A1-A2'') during fluid-jet stimulation, all changes in GCaMP6s fluorescence in both the apical and basal planes would be eliminated after BAPTA treatment. In contrast, changes in GCaMP6s fluorescence due to motion such as those shown in Figures 4B1'-B1'' and 4C1'-C1'' would not be eliminated by BAPTA treatment.
In addition to using BAPTA to eliminate all stimulus-evoked GCaMP6s signals, isradipine can be applied (step 11) to specifically block Cav1.3-dependent calcium influx in the basal synaptic plane while leaving apical MET-channel-dependent calcium influx intact5. After application of isradipine, in an individual neuromast with no motion artifacts, changes in GCaMP6s fluorescence in apical hair bundles (Figure 4A1'-A1'') during fluid-jet stimulation would be unaltered, while all synaptic GCaMP6s fluorescence changes at the base would be eliminated (Figure 4A2'-A2''). Any change in GCaMP6s signal in the synaptic plane after isradipine application (e.g.,Figure 4C1-C1'') would most likely correspond to motion artifacts.
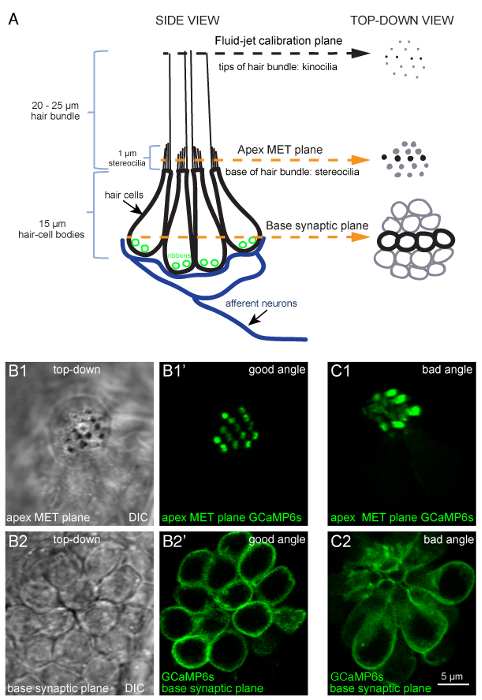
Figure 1: Overview of a lateral-line neuromast and functional imaging planes. (A) The diagram to the left depicts a side-view of a neuromast with four hair-cell bodies (black) contacting postsynaptic afferent neurons (blue). Ribbons (green) tether vesicles at presynaptic active sites within each cell. Apical to each cell body is a bundle of stereocilia (1 µm) that contain MET channels. Each hair bundle has one kinocilium that transfers the mechanical force of water motion to the base of the hair bundle. The diagram on the right depicts the same model in a top-down view. In this top-down view, black is used to indicate the four cells depicted in the diagram on the left, and gray is used to indicate other cells in the neuromast. Within this model and these 2 views, three important planes are highlighted: (1) the tips of the hair bundles (kinocilia) used to quantify the magnitude of hair-bundle deflection, (2) the apical MET plane at the base of the hair bundles where calcium enters the cell during stimulation, and (3) the synaptic plane at the base of the cell where calcium enters near synaptic ribbons. (B1-B1') DIC and GCaMP6s top-down images of MET plane at the base of the hair bundles, where mechanosensation-dependent calcium signals can be recorded. (B2-B2') DIC and GCaMP6s top-down images from the same neuromast as B1-B1', but at the base of the neuromast in the synaptic plane, where presynaptic calcium signals can be detected. (C1-C2) Images of a neuromast expressing GCaMP6s where the larvae is improperly mounted. In this example, the apical MET plane (C1) and synaptic plane (C2) at the base of the cell are positioned at a suboptimal angle. This position does not allow for all hair bundles to be imaged in a single plane, and many more imaging planes are needed to capture activity at all synapses within this neuromast compared to B1-B2'. Images are of larvae at 5 dpf. The scale bar in C2 corresponds to all images in B1-C2. Please click here to view a larger version of this figure.
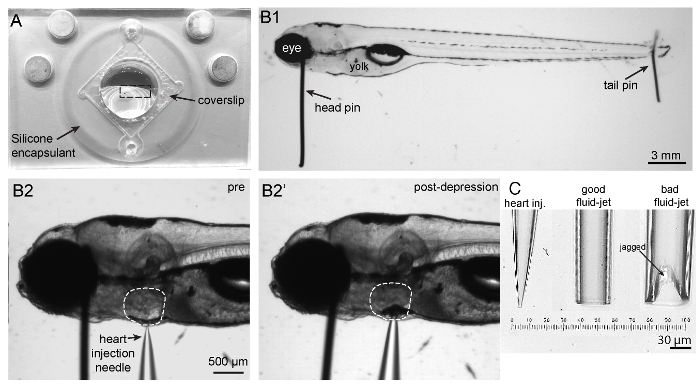
Figure 2: Imaging chamber, zebrafish mounting and heart injection procedures, and needles. (A) Shown is an imaging chamber with a larva (outlined by a dashed rectangle) pinned to the center atop the silicone encapsulant. (B1) Shown is a 5 dpf larva immobilized by two pins. A large head pin is placed perpendicular to the body just posterior to the eye. The two eyes are completely superimposed so the bottom eye is entirely obscured by the upper eye. A small tail pin intersects the notochord in the tail. The larva is flat and not twisted. (B2) To paralyze larva, a heart injection needle is oriented perpendicular to the body and brought adjacent to the heart. The heart injection needle should contact the pigment cell in front of the heart. (B2') Depression of the needle into the skin causes indentation of the pigment cell in front of the heart. (C) Needles in order from left to right: example of a heart injection needle with an opening of approximately 3 µm; example of a good fluid-jet needle with an opening of approximately 50 µm; example of a poorly broken fluid-jet needle that is large and jagged and will likely produce excessive and irregular stimuli. Please click here to view a larger version of this figure.
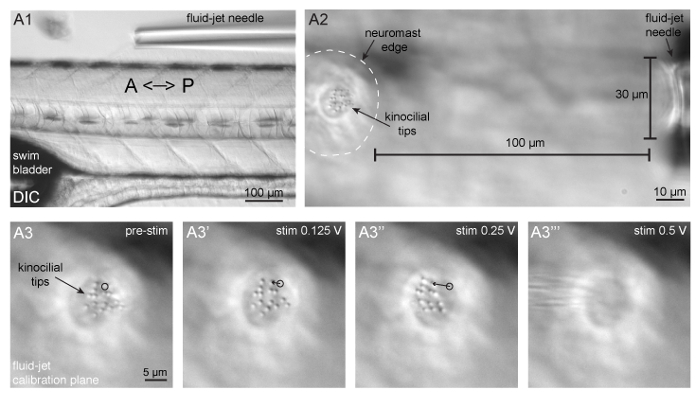
Figure 3: Fluid-jet alignment, positioning, and stimulus calibration. (A1) Shown is a larva oriented with the head facing to the left and tail to the right, and a fluid-jet needle oriented parallel to the A-P axis of the zebrafish body. This fluid-jet needle is aligned to stimulate the neuromasts that respond to anterior (push/pressure) and posterior (pull/vacuum) directed fluid-flow. (A2) Shown is a neuromast (outlined by dashed white line) and tips of apical hair bundles (kinocilia) on the left side the panel and the fluid-jet needle on the right side of the panel. The fluid-jet is positioned approximately 100 µm from the edge of the neuromast. (A3-A3''') The tips of apical hair bundles (kinocilia) are deflected different distances by varying fluid-jet stimulus pressures. The trajectory of a single kinocilial tip is shown for 1.5 µm (A3') and 5 µm (A3'') deflection distances. The black circle indicates the resting position of the kinocilium. It is important that kinocilia are not deflected too far, otherwise the stimulus intensity cannot be reliably quantified and can become damaging (A3'''). Please click here to view a larger version of this figure.
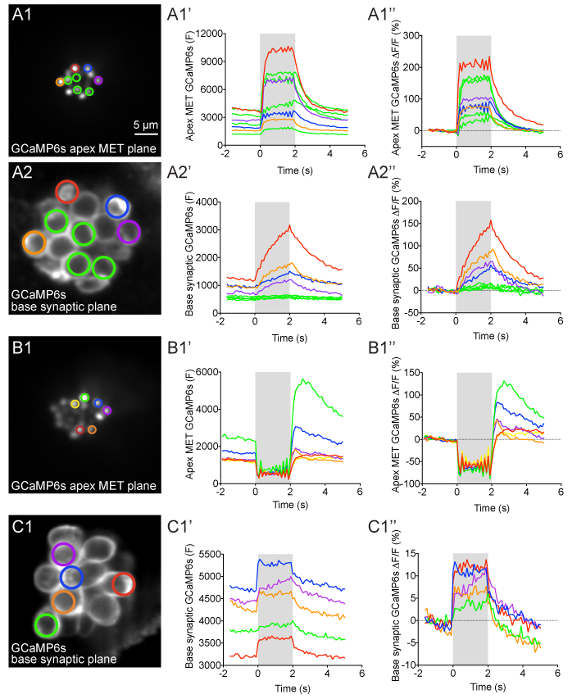
Figure 4: Apical MET and basal presynaptic GCaMP6s signals during fluid-jet stimulation in lateral-line hair cells. (A1-A2'') GCaMP6s intensity changes during fluid-jet stimulation within a representative neuromast. The images on the left show the apical MET plane (A1) and basal synaptic plane (A2) within the same neuromast. The ROIs color coded in A1 and A2 were used to plot the time course of (F) and ΔF/F GCaMP6s intensity graphs to the right of each image. (B1-B1'') Example of an apical MET image sequence with excess movement during fluid-jet stimulation. The image on the left (B1) shows the ROIs used to plot the (F) and ΔF/F GCaMP6s intensity graphs to the right. (C1-C1'') Example of an image sequence in the basal synaptic plane that shows movement artifacts and GCaMP6s signal changes that are not true calcium signals. The image on the left (C1) shows the ROIs used to plot the (F) and ΔF/F GCaMP6s intensity graphs to the right. The gray box in each graph represents the duration of the fluid-jet stimulus during each image sequence. A 2-s 5 Hz fluid-jet stimulus was used for the example in A1-A2'' and B1-B1''. In C1-C1'', a 2 s anterior step stimulus was used. The Y axis for (F) GCaMP6s graphs depicts arbitrary units (A.U.) obtained from Fiji image intensity measurements. All examples are from larvae at 4-5 dpf. Scale bar = 5 µm for all images. Please click here to view a larger version of this figure.
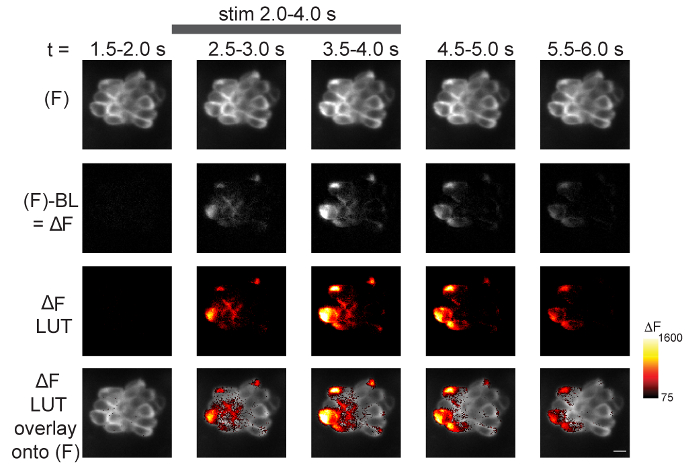
Figure 5: Spatiotemporal visualization of presynaptic GCaMP6s signals during fluid-jet stimulation. The steps to visualize the spatiotemporal changes in GCaMP6s intensity within a neuromast during stimulus are outlined. Time is represented from left to right according to the time stamp at the top of the images. The top row shows 5 of the 14 temporal bins from a 70-frame GCaMP6s (F) image sequence (step 13.2.1). In the second row, the baseline (step 13.2) has been removed from each (F) GCaMP6s binned image to create ΔF images (step 13.2.2). In the third row, ΔF images have been converted from grayscale (second row) to Red Hot LUT (step 13.3). The min and max of these LUT images are set according to the Red Hot LUT heat map of relative ΔF intensity (A.U.) on the right (step 13.3.1). In the bottom row, the third row has been overlaid onto the (F) images in the top row (step 13.4). The gray bar at the top of the figure indicates the timing of the 2-s 5 Hz fluid-jet stimulus. The example is from a 5 dpf larvae. A legend of the Red Hot LUT heat map of relative ΔF intensity (A.U.) is shown to the right. Scale bar = 5 µm for all images. Please click here to view a larger version of this figure.
Supplemental Coding File. Please click here to download this file.
Discussion
In vivo imaging in intact animals is inherently challenging. Several steps in this method are critical to obtaining reliable in vivo calcium measurements from lateral-line hair cells. For example, it is very important that the larva is pinned and paralyzed properly before imaging to minimize movement during imaging. Excess movement during imaging can lead to changes in GCaMP6s fluorescence that are not true signals and do not correspond to changes in calcium levels (e.g., Figures 4B1'-B1'' and 4C1'-C1''). Tail pins can be placed more anteriorly to help minimize movement, though this may render more posterior neuromasts inaccessible. Furthermore, after heart injection, head pins can be rotated so that the horizontal portion of the pin lies across the yolk. In addition to altering the position of pins, it is also possible to use a brain-slice harp instead of pins to immobilize larvae34. When placed over the larvae properly, a harp is an additional, potentially less invasive method of immobilizing larvae. While significant movement can result from inadequate pinning, failure to properly perform the heart injection to deliver α-bungarotoxin and paralyze larvae can result in incomplete paralysis, movement, and ultimately motion artifacts. Although commonly used anesthetics have been shown to affect the excitability of zebrafish hair cells, recent work has shown that the anesthetic benzocaine does not interfere with many aspects of hair-cell activity. Similarly, the more commonly used anesthetic MS-222 only interferes with certain aspects of hair-cell activity15. Therefore, due to the challenging nature of α-bungarotoxin injection, benzocaine or MS-222 application may prove to be a useful alternative method of paralysis to prevent movement in the larva during functional calcium imaging.
In addition to the technical challenges involved in this protocol, even a perfectly mounted sample is useless if the larva and hair cells are not healthy prior to and during each imaging experiment. To ensure that larvae and hair cells are healthy, it is important that larvae are maintained in E3 buffer that is free of debris such as chorions (egg shells), waste, and microorganisms. Although the superficial location of lateral-line hair cells is advantageous for imaging, this location makes them more vulnerable to cellular damage when the E3 buffer is fouled. A clean, aqueous environment is particularly important for young larvae (2-4 dpf) or mutants that cannot maintain an upright swimming position and primarily lie on the bottom of the Petri dish. In these situations, lateral-line hair cells and the protective cupula surrounding the hair bundles can easily become compromised. Even when starting with healthy larvae and hair cells, throughout the course of each experiment, it is critical to ensure that the larva has a heartbeat and rapid blood flow. If blood flow slows or stops, the health of the hair cells can become compromised. In compromised preparations involving unhealthy larvae or loss of blood flow, dying hair cells can be identified several ways: first, by the appearance of karyopyknosis or nuclear condensation, which manifests as a bubble within the cell under DIC optics; second, by cell shrinkage and the presence of rapidly moving particles within the cytoplasm; and third, when kinocilia tips splay out in different directions35. When hair bundles are disrupted, the splayed kinocilia do not move cohesively together during stimulation.
This preparation has several minor limitations, one being that the preparation only remains robust for 1-3 hours after it is established. Modifications such as using smaller pins or a brain-slice harp to immobilize larvae and adding a perfusion system may extend the lifetime of this in vivo preparation. Another limitation is that photobleaching and phototoxicity can occur after repeated imaging trials. One exciting way to overcome this challenge is to adapt this protocol for light-sheet microscopy. Light-sheet microscopy is a powerful way to reduce out of focus light, leading to less photobleaching and phototoxicity36. Together, gentler immobilization and less photo-exposure may help prolong each imaging session. Longer imaging sessions can be used to examine the full duration of functional changes accompanying development and the processes underlying hair-cell clearance and regeneration after injury. It is important to point out that, in addition to light-sheet microscopy, this protocol can be adapted to other types confocal systems (point-scanning, 2-photon, and spinning disk) as well as relatively simple widefield systems28,34. Overall, its versatility makes this protocol a valuable tool that can be adapted and used with multiple imaging systems.
While this protocol can be adapted and used with many imaging systems, parts of this protocol can also be adapted and used (1) with other indicators besides GCaMP6s and (2) to image activity in other sensory cells and neurons within larval zebrafish. For example, in a previous study, we used this protocol to image activity using multiple genetically encoded indicators within lateral-line hair cells to detect cytosolic calcium (RGECO1), vesicle fusion (SypHy), membrane voltage (Bongwoori), and membrane calcium (jRCaMP1a-caax and GCaMP6s-caax), and within lateral-line afferent processes to detect membrane calcium (GCaMP6s-caax)5. Based on our experience using these indicators, the transgenic line Tg(myo6b:GCaMP6s-caax) described in this protocol offers an excellent start for imaging activity in lateral-line neuromasts. Of all the indicators listed above, we have found that GCaMP6s is the most sensitive and photostable. In addition to these features, we highlight the Tg(myo6b:GCaMP6s-caax) transgenic line because it can be used to make two distinct measurements: hair-cell mechanosensation and presynaptic calcium within a single transgenic line.
The technique outlined in this article demonstrates how calcium imaging in the zebrafish lateral line can be a powerful method to study how hair cells function in their native environment. This approach is complementary to studies of mammals in which hair-cell function is currently being studied in ex vivo explants. In addition, the zebrafish model can continue to be used as a platform to test the efficacy of genetically encoded indicators that can then be applied to examine activity in mammalian hair cells.
Disclosures
The authors have nothing to disclose.
Acknowledgements
This work was supported by NIH/NIDCD intramural research funds 1ZIADC000085-01 (K.S.K.). We would like to acknowledge Candy Wong for her assistance in writing the Fiji macro. We would also like to thank Doris Wu and Candy Wong for their helpful suggestions with the protocol.
Materials
| Name | Company | Catalog Number | Comments |
|---|---|---|---|
| Section 1 | |||
| α-Bungarotoxin | R&D Systems | 2133 | For paralyzing larvae prior to imaging |
| Phenol red Solution 0.5% | Sigma-Aldrich | P0290 | For visualization of α-bungarotoxin solution during heart injection |
| Ethyl 3-aminobenzoate methanesulfonate (MESAB, MS-222, tricaine) | Sigma-Aldrich | A5040 | For anesthetizing larvae |
| Section 2 | |||
| Imaging chamber | Siskiyou | PC-R | Platform to mount larvae for imaging |
| No. 1.5 Coverslips square, 22*22 mm | VWR | 48366-227 | To seal imaging chamber |
| High vacuum silicone grease | Fischer Scientific | 14-635-5D | For affixing of coverslip to imaging chamber |
| Silicone encapsulant clear 0.5 g kit | Ellsworth Adhesives | Dow Corning Sylgard, 184 SIL ELAST KIT 0.5KG | To fill imaging chamber to create a surface to pin fish |
| Oven | Techne | HB-1D | For drying silicone encapsulant |
| Stereomicroscope | Carl Zeiss Microscopy | Stemi 2000 with transmitted light illumination | For illuminating wire, forceps and scissors to make pins |
| Fine forceps | Fine Science Tools | Dumont #5 (0.05 x 0.02 mm) Item No. 11295-10 | For making pins |
| Fine scissors | Cole-Palmer | 5.5", EW-10818-00 | For cutting tunsgten wire to make pins |
| Tungsten wire, 0.035 mm | Goodfellow | W005131 | For head pins to immobilize larvae |
| Tungsten wire, 0.025 mm | ThermoFischer Scientific | AA10405-H4 | For tail pins to immobilize larvae |
| Section 3 | |||
| Micropipette guller | Sutter Instrument Company | P-97 | For pulling capillary glass for fluid-jet and heart injection needles |
| Borosilicate glass capillaries w/ filament | Sutter Instrument Company | BF 150-86-10 | Glass to be pulled into α-bungarotoxin injection needles for heart injection |
| Borosilicate glass capillaries w/o filament | Sutter Instrument Company | B 150-86-10 | Glass to be pulled into fluid-jet needles to stimulate hair cells |
| Pipette polisher | Narishige | MF-830 microforge | To polish fluid-jet pipette tips to smooth jagged breaks |
| Ceramic tile | Sutter Instrument Company | NC9569052 | For scoring and evening breaking fluid-jet needles |
| Sections 4 & 5 | |||
| Fine forceps | Fine Science Tools | Dumont #5 (0.05 x 0.02 mm) Item No. 11295-10 | For pinning larvae |
| Gel loading tips | Eppendorf | 5242956003 | For backfilling heart injection needles |
| Stereomicroscope | Carl Zeiss Microscopy | Stemi 2000 with transmitted light illumination | For illuminating larvae during pinning and heart injection |
| Glass capillary/needle holder | WPI | MPH315 | To hold fluid-jet needles |
| Manual micromanipulator | Narishige | M-152 | For holding and positioning of needle holder to inject α-bungarotoxin |
| Magnetic stand | Narishige | GJ-1 | For holding manual micromanipulator for α-bungarotoxin injection |
| Pressure injector | Eppendorf | Femtojet 4x | To deliver α-bungarotoxin |
| Sections 6, 7 & 8 | |||
| Confocal microscope | Bruker | Swept field/Opterra confocal microscope | Fixed, upright microscope with DIC optics and 488 nm laser with appropriate filters |
| Microscope software | Bruker | Prairieview 5.3 | To coordinate and control the microscope, lasers, stage, piezo-z, cameras and fluid jet |
| 10x air objective | Nikon | MRH00101 | Low magnification for positioning of larvae and fluid jet |
| 60x water objective | Nikon | MRF07620 | Water immerison objective with high NA (1.0) and adequate working distance (2.0 mm) |
| Piezo-Z objective scanner with controller/driver | Physik Intruments instruments/Bruker | 01144210/UM-Z-PZ | High-speed z-stack acquisition with 0.025um accuracy |
| EMCCD camera | QImaging | Rolera EM-C2 EMCCD camera | Camera with small pixel size that can acquire up to 100 frames per s |
| Circular chamber adapter | Siskiyou | PC-A | For holding and rotating imaging chamber on microscope stage |
| Motorized Z-deck stage | Prior Scientific | ZDN12MP | Microscope stage that can hold and move sample and micromanipulator with fluid-jet needle together |
| Z-deck stage insert adaptor | NIH Machine shop | custom | To fit the circular chamber adaptor onto the z-deck stage |
| Fluid-jet apparatus | ALA scientific instruments | HSPC-1 High-speed pressure Clamp with PV-PUMP | For controlling and delivering the fluid-jet stimulus |
| Masterflex Peroxide-cured silicone tubing (1 feet) | Cole-Palmer | Masterflex L/S 13, 96400-13 | For connecting the fluid-jet needle holder to pressure pump |
| Motorized micromanipulator | Sutter Instrument Company | MP-225 | For holding and positioning of needle holder for fluid jet |
| Micromanipulator controller | Sutter Instrument Company | MPC-200 | For controlling fluid-jet needle manipulator |
| Gel loading tips | Eppendorf | 5242956003 | For backfilling fluid-jet needles |
| Glass capillary/needle holder | WPI | MPH315 | To hold fluid-jet needles |
| PSI manometer | Sper Scientific | 840081 | For measuring pressure clamp output |
| Section 9 | |||
| BAPTA, Tetrapotassium Salt, cell impermeant | ThermoFischer Scientific | B1204 | To cleave tips links, uncouple MET channels and block all evoked GCaMP6s signals |
| Isradipine | Sigma-Aldrich | I6658 | To block signals dependent on the L-type calcium channels (CaV1.3) at the presynapse |
| DMSO | Sigma-Aldrich | D8418 | Solvent for pharmacological compounds |
| Section 10 | |||
| Prism7 | Graphpad | Prism7 | Software to plot GCaMP6 intensity changes |
| FIJI | Schindelin, et., al.34 | https://fiji.sc/ | Software to process images and create spatio-temporal signal maps |
| Turboreg Plugin | Thévenaz et., al.29 | http://bigwww.epfl.ch/thevenaz/turboreg/ | Plugin to register GCaMP6 image sequences in FIJI |
| StackReg Plugin | Thévenaz et., al.29 | http://bigwww.epfl.ch/thevenaz/stackreg/ | Plugin to register GCaMP6 image sequences in FIJI |
| Times Series Analyzer V3 Plugin | Balaji J 2007, Dept. of Neurobiology, UCLA | https://imagej.nih.gov/ij/plugins/time-series.html | Plugin to create multiple ROIs to measure GCaMP6 intensity changes |
References
- Russell, J. T. Imaging calcium signals in vivo: a powerful tool in physiology and pharmacology. British Journal of Pharmacology. 163 (8), 1605-1625 (2011).
- Pérez Koldenkova, V., Nagai, T. Genetically encoded Ca2+ indicators: Properties and evaluation. Biochimica et Biophysica Acta (BBA) - Molecular Cell Research. 1833 (7), 1787-1797 (2013).
- Lin, M. Z., Schnitzer, M. J. Genetically encoded indicators of neuronal activity. Nature Neuroscience. 19 (9), 1142-1153 (2016).
- Tian, L., Hires, S. A., Looger, L. L. Imaging Neuronal Activity with Genetically Encoded Calcium Indicators. Cold Spring Harbor Protocols. 2012 (6), (2012).
- Zhang, Q., et al. Synaptically silent sensory hair cells in zebrafish are recruited after damage. Nature Communications. 9 (1), 1388(2018).
- Harris, G. G., Frishkopf, L. S., Flock, A. Receptor potentials from hair cells of the lateral line. Science. 167 (3914), New York, N.Y. 76-79 (1970).
- Eatock, R. A. Vertebrate Hair Cells: Modern and Historic Perspectives. Vertebrate Hair Cells. , 1-19 (2006).
- Deafness and Hearing Loss, Key Facts. World Health Organization. , Available from: http://www.who.int/en/news-room/fact-sheets/detail/deafness-and-hearing-loss (2018).
- Tang, L. S., Montemayor, C., Pereira, F. A. Sensorineural hearing loss: potential therapies and gene targets for drug development. IUBMB Life. 58 (9), 525-530 (2006).
- Assad, J. A., Shepherd, G. M. G., Corey, D. P. Tip-link integrity and mechanical transduction in vertebrate hair cells. Neuron. 7 (6), 985-994 (1991).
- Lumpkin, E. A., Hudspeth, A. J. Detection of Ca2+ entry through mechanosensitive channels localizes the site of mechanoelectrical transduction in hair cells. Proceedings of the National Academy of Sciences. 92 (22), 10297-10301 (1995).
- Ricci, A. J., Wu, Y. -C., Fettiplace, R. The Endogenous Calcium Buffer and the Time Course of Transducer Adaptation in Auditory Hair Cells. Journal of Neuroscience. 18 (20), 8261-8277 (1998).
- Moser, T., Beutner, D. Kinetics of exocytosis and endocytosis at the cochlear inner hair cell afferent synapse of the mouse. Proceedings of the National Academy of Sciences of the United States of America. 97 (2), 883-888 (2000).
- Brandt, A., Khimich, D., Moser, T. Few CaV1.3 channels regulate the exocytosis of a synaptic vesicle at the hair cell ribbon synapse. The Journal of Neuroscience: The Official Journal of the Society for Neuroscience. 25 (50), 11577-11585 (2005).
- Olt, J., Allen, C. E., Marcotti, W. In vivo physiological recording from the lateral line of juvenile zebrafish. The Journal of Physiology. 594 (19), 5427-5438 (2016).
- Olt, J., Johnson, S. L., Marcotti, W. In vivo and in vitro biophysical properties of hair cells from the lateral line and inner ear of developing and adult zebrafish. The Journal of Physiology. 592 (10), 2041-2058 (2014).
- Griguer, C., Fuchs, P. A. Voltage-dependent potassium currents in cochlear hair cells of the embryonic chick. Journal of Neurophysiology. 75 (1), 508-513 (1996).
- Art, J. J., Fettiplace, R. Variation of membrane properties in hair cells isolated from the turtle cochlea. The Journal of Physiology. 385, 207-242 (1987).
- Goutman, J. D., Pyott, S. J. Whole-Cell Patch-Clamp Recording of Mouse and Rat Inner Hair Cells in the Intact Organ of Corti. Methods in Molecular Biology. 1427, Clifton, N.J. 471-485 (2016).
- Einarsson, R., et al. Patch Clamp Recordings in Inner Ear Hair Cells Isolated from Zebrafish. Journal of Visualized Experiments. (68), (2012).
- Fuchs, P. A. Time and intensity coding at the hair cell's ribbon synapse. The Journal of Physiology. 566, Pt 1 7-12 (2005).
- Moser, T., Brandt, A., Lysakowski, A. Hair cell ribbon synapses. Cell and Tissue Research. 326 (2), 347-359 (2006).
- Trapani, J. G., Nicolson, T. Chapter 8 - Physiological Recordings from Zebrafish Lateral-Line Hair Cells and Afferent Neurons. Methods in Cell Biology. 100, 219-231 (2010).
- Olt, J., Ordoobadi, A. J., Marcotti, W., Trapani, J. G. Physiological recordings from the zebrafish lateral line. Methods in Cell Biology. 133, 253-279 (2016).
- Stawicki, T. M., Esterberg, R., Hailey, D. W., Raible, D. W., Rubel, E. W. Using the zebrafish lateral line to uncover novel mechanisms of action and prevention in drug-induced hair cell death. Frontiers in Cellular Neuroscience. 9, (2015).
- Spinelli, K. J., Gillespie, P. G. Monitoring Intracellular Calcium Ion Dynamics in Hair Cell Populations with Fluo-4 AM. PLOS ONE. 7 (12), 51874(2012).
- Kwan, K. M., et al. The Tol2kit: a multisite gateway-based construction kit for Tol2 transposon transgenesis constructs. Developmental Dynamics: An Official Publication of the American Association of Anatomists. 236 (11), 3088-3099 (2007).
- Zhang, Q. X., He, X. J., Wong, H. C., Kindt, K. S. Chapter 10 - Functional calcium imaging in zebrafish lateral-line hair cells. Methods in Cell Biology. 133, 229-252 (2016).
- Sheets, L., et al. Enlargement of Ribbons in Zebrafish Hair Cells Increases Calcium Currents But Disrupts Afferent Spontaneous Activity and Timing of Stimulus Onset. The Journal of Neuroscience: The Official Journal of the Society for Neuroscience. 37 (26), 6299-6313 (2017).
- Zhang, Q. X., He, X. J., Wong, H. C., Kindt, K. S. Functional calcium imaging in zebrafish lateral-line hair cells. , Available from: http://www.sciencedirect.com/science/article/pii/S0091679X15002332 (2018).
- Chou, S. -W., et al. A molecular basis for water motion detection by the mechanosensory lateral line of zebrafish. Nature Communications. 8 (1), 2234(2017).
- Thevenaz, P., Ruttimann, U. E., Unser, M. A pyramid approach to subpixel registration based on intensity. IEEE Transactions on Image Processing. 7 (1), 27-41 (1998).
- Fiji is just ImageJ. , Available from: https://fiji.sc/ (2018).
- Esterberg, R., Hailey, D. W., Coffin, A. B., Raible, D. W., Rubel, E. W. Disruption of intracellular calcium regulation is integral to aminoglycoside-induced hair cell death. The Journal of Neuroscience: The Official Journal of the Society for Neuroscience. 33 (17), 7513-7525 (2013).
- Stengel, D., Zindler, F., Braunbeck, T. An optimized method to assess ototoxic effects in the lateral line of zebrafish (Danio rerio) embryos. Comparative Biochemistry and Physiology Part C: Toxicology & Pharmacology. 193, 18-29 (2017).
- Fadero, T. C., et al. LITE microscopy: Tilted light-sheet excitation of model organisms offers high resolution and low photobleaching. Journal of Cell Biology. , (2018).
Reprints and Permissions
