The transimmunization (TI) device or plate and related protocols have been developed to replicate the key features of extracorporeal photochemotherapy (ECP), in an experimental setting, allowing for production of physiologically activated, tunable dendritic cells (DCs) for cancer immunotherapy.
Method Article
Novel Protocol for Generating Physiologic Immunogenic Dendritic Cells
* These authors contributed equally
In This Article
Summary
Abstract
Extracorporeal photochemotherapy (ECP) is a widely used cancer immunotherapy for cutaneous T cell lymphoma (CTCL), operative in over 350 university centers worldwide. While ECP’s clinical efficacy and exemplary safety profile have driven its widespread use, elucidation of the underlying mechanisms has remained a challenge, partly owing to lack of a laboratory ECP model. To overcome this obstacle and create a simple, user-friendly platform for ECP research, we developed a scaled-down version of the clinical ECP leukocyte-processing device, suitable for work with both mouse models, and small human blood samples. This device is termed the Transimmunization (TI) chamber, or plate. In a series of landmark experiments, the miniaturized device was used to produce a cellular vaccine that regularly initiated therapeutic anti-cancer immunity in several syngeneic mouse tumor models. By removing individual factors from the experimental system and ascertaining their contribution to the in vivo anti-tumor response, we then elucidated key mechanistic drivers of ECP immunizing potential. Collectively, our results revealed that anti-tumor effects of ECP are initiated by dendritic cells (DC), physiologically generated through blood monocyte interaction with platelets in the TI plate, and loaded with antigens from tumor cells whose apoptotic cell death is finely titrated by exposure to the photoactivatable DNA cross-linking agent 8-methoxypsoralen and UVA light (8-MOPA). When returned to the mouse, this cellular vaccine leads to specific and transferable anti-tumor T cell immunity. We verified that the TI chamber is also suitable for human blood processing, producing human DCs fully comparable in activation state and profile to those derived from the clinical ECP chamber. The protocols presented here are intended for ECP studies in mouse and man, controlled generation of apoptotic tumor cells with 8-MOPA, and rapid production of physiologic human and mouse monocyte-derived DCs for a variety of applications.
Introduction
Extracorporeal photochemotherapy (ECP) is an established immunotherapy that is widely operative in university centers worldwide. Its use has been driven by unique selectivity, safety, and bi-directional efficacy of ECP therapy, traits that ECP shares with the physiologic immune system itself with which it appears to partner. ECP is selectively immunizing against the malignant cells in cutaneous T cell lymphoma (CTCL)1,2, and selectively tolerizing for targeted antigens in the transplant, autoimmunity, and graft-versus-host disease (GvHD) settings3,4. The immunogenicity of ECP is highlighted by its dependency on an intact CD8 T cell compartment in CTCL5, while specificity is reflected by ECP’s very favorable adverse reaction profile, with no off-target immune suppression in transplant or GvHD settings, and no increased opportunistic infection susceptibility in CTCL, where non-pathogenic T cell clones could potentially be lost along with the malignant T cells.
Given the clinical importance of ECP, the hope that better understanding of its mechanisms might expand ECP’s therapeutic reach to a wider spectrum of cancers and immunologic disorders has stimulated international interest. Two nationally sanctioned workshops, an National Institutes of Health (NIH) State-of-the-Science symposium6 and an American Society for Apheresis consensus conference7, were conducted and reported, with the aim of accelerating the identification of the principal cellular contributors to ECP’s anti-cancer and tolerogenic effects.
To date, despite numerous published reports attempting to address ECP’s mechanism, two primary obstacles have impeded scientific advances. Firstly, investigation of ECP mechanisms in the experimental laboratory setting has been limited by the lack of miniature ECP device that would fully reflects ECP’s cellular and in vivo effects, and be applicable to animal models. Secondly, in-depth laboratory analysis of ECP samples in the clinical setting has been restricted by the limited availability of ECP-processed patient immune cells, which require access to treatment centers, and are additionally subject to the timing of the patient’s infusions, and the ethical need for uncompromised sets of patient-reinfused leukocytes.
To resolve the obstacles impeding the progress of ECP research, we set out to develop a miniature ECP apparatus that would most closely mimic the key elements of the therapy. Standard ECP treatment involves the passage of a patient’s leukapheresis-enriched leukocytes through a 1 mm-thick, ultraviolet A light (UVA)-transparent, plastic plate6,8. In the plate, the leukocytes are exposed to 8-methoxypsoralen (8-MOP), a photo-activatable agent which upon UVA exposure is transiently converted to a reactive form (8-MOPA), capable of DNA cross-linking via its bivalent binding to pyrimidine bases on sister DNA strands9,10. Processed, 8-MOPA-treated leukocytes are collected and returned intravenously to the patient.
Since ECP itself is a bi-directional therapy, immunizing in cancer and tolerizing in transplant, autoimmunity and GvHD settings, for clarification we have named model ECP’s immunization mode “transimmunization”, and the tolerogenic mode “transtolerization”. We first focused on the transimmunization modality. Our recently reported miniaturized scalable mouse-to-man ECP device, the transimmunization (TI) chamber or plate, and the corresponding protocol, reproduce both the cellular and in vivo effects of the human ECP device in a cancer setting11.
In order to make the transimmunization in vivo model as clinically relevant as possible, we initiated the immunotherapy after subcutaneously injected syngeneic mouse tumors became palpable, thus testing the protocol’s efficacy in established cancer. Similarly to ECP in CTCL, the proof-of-principle transimmunization protocol in the YUMM1.7 model of melanoma uses peripheral blood mononuclear cells (PBMC) from tumor-bearing animals. The cells are passed through the TI plate under flow. While 8-MOPA treatment of cells in the miniature chamber is possible, it is preferable to conduct it separately, to ensure that only the desired cell type is exposed to 8-MOPA. Earlier studies indicate that ECP’s tolerogenic effect is mediated by 8-MOPA-injured antigen-presenting cells12, while the immunizing effect requires 8-MOPA injury of target tumor cells11. In the transimmunization protocol either the tumor cells, or the immune cells, can be selectively exposed to 8-MOPA as needed. Since maximizing the time of contact between 8-MOPA-injured tumor cells and ECP-induced dendritic cells (DC) has been shown to significantly enhance the immunotherapeutic capacity of clinical ECP13, we incorporated an overnight co-incubation step into our protocol. After overnight incubation, the treated cells are returned to the tumor-bearing animal.
This system reliably reduced tumor growth and initiated specific anti-tumor immunity in mice with established syngeneic tumors11, and allowed us to dissect the mechanism of ECP’s clinical anti-tumor efficacy. In several studies we have demonstrated that ECP immunity is initiated through ex vivo platelet activation in the TI plate14,15. Activated platelets subsequently signal the monocyte-to-dendritic cell maturation14, leading to production of physiologic DCs. The newly formed monocyte-derived DCs are able to cross-present internalized antigens from 8-MOPA-damaged tumor cells to activate antigen-specific T cell responses16. As suggested previously12,17, however, 8-MOPA-induced damage of the nascent DCs themselves can counter-act or even reverse the anti-tumor effect11, providing a mechanistic link to ECP tolerance.
The TI plate has also been used to produce physiologically activated DCs from human PBMC. Similarly to the mouse studies, human TI-derived DCs are dependent on plate-passage in the presence of platelets for their generation, appear phenotypically identical to these produced in the clinical ECP plate, and are capable of efficiently processing and cross-presenting human tumor antigens for activation of human T cells11,16.
In uncovering the mechanism of ECP immunotherapy, we have therefore uncovered a method for rapidly generating physiologic mouse and human dendritic cells of desired antigen specificity, that can be functionally modulated. The innovative TI device and protocol have substantial potential importance in the fields of ECP research and therapy and cancer immunotherapy more broadly, and in any other field with interest in physiologic, functional dendritic cells in either the immunizing or the tolerizing modality. We hope that this publication will provide the necessary tools to those with interest in such research areas.
Protocol
All mouse methods described here have been approved by the Institutional Animal Care and Use Committee (IACUC) of Yale University, in agreement with the National Institutes of Animal Healthcare Guidelines. All human studies were performed with blood donated by healthy volunteers, with written informed consent. Human blood studies were conducted in accordance with recognized ethical guidelines (e.g., Declaration of Helsinki, CIOMS, Belmont Report, U.S. Common Rule), and were approved by Yale Human Investigational Review Board under protocol number 0301023636.
NOTE: The following is the protocol describing transimmunization for anti-tumor therapy of mouse syngeneic tumors.
1. Syngeneic YUMM1.7 Tumor Implantation
- Follow established protocols to implant syngeneic tumors into the flanks of mice as appropriate to the tumor cell line of interest.
NOTE: The protocol below describes the YUMM1.7 C57BL/6 mouse melanoma tumor model. YUMM1.7 melanoma cells were kindly provided by Dr. Bosenberg, Yale18. - Thaw a frozen aliquot of cells and use cells after one cell passage. Culture freshly-thawed YUMM1.7 cells in Dulbecco’s modified Eagle’s nutrient mixture F-12 medium (DMEM/F12), supplemented with 10% heat-inactivated fetal bovine serum (FBS), 1% penicillin/streptomycin, and 1% non-essential amino acids, under standard tissue culture conditions (37 °C, 5% CO2).
- Collect YUMM1.7 cells at 60‒70% confluence by adding enough trypsin-EDTA to cover the bottom of the cell culture plate or flask (e.g., 4 mL for a T75 flask).
- Rest the cell culture vessels at room temperature for 3‒4 min, gently tapping on the bottom or sides of the vessel occasionally to help detach the cells.
- Add 1 mL of fetal bovine serum (FBS) per 4 mL of trypsin-ethylenediaminetetraacetic acid (EDTA) to stop the reaction once most of the cells are detached. Collect the cells by pipetting into a 15 mL conical tube. Rinse the flask with phosphate-buffered saline (PBS) and add the rinse to the same collection tube. Fill the tube to 15 mL with PBS.
- Take out a small aliquot and count the cells.
- Spin down for 10 min at 250 x g in a standard tissue culture centrifuge to collect the tumor cells.
- Resuspend YUMM1.7 cells in PBS at density of 1 x 10⁶ cells/mL.
- Inject 1 x 10⁵ YUMM1.7 tumor cells subcutaneously in 100 μL of PBS into the right flanks of recipient 4 to 6-week-old wild type male C57BL/6J mice, anesthetized according to institutional guidelines (e.g., 3‒5% isoflurane inhalant gas, anesthesia confirmed by lack of hind paw pinch reflex).
- Monitor tumor volume via bi-weekly measurements of perpendicular tumor diameters and height using a caliper. Calculate YUMM1.7 (tumor volume as tumor length x width x height)/2.
- Initiate transimmunization therapy when tumors become just palpable; for YUMM1.7 tumors, this is usually day 7‒10 post tumor implantation.
2. Collection of Peripheral Blood Mononuclear Cells for Transimmunization
- Collect 100‒150 μL of blood from each tumor-bearing mouse via cheek bleed.
- As blood is being collected, pool blood from each mouse treatment group (each 5 experimental mice + 5 control mice) in a single 15 mL tube containing 5,000 U/mL heparin. Use 10 μL of 10% heparin per 100 μL blood collected.
NOTE: Mix the tube frequently during collection to avoid blood coagulation. While control tumor-bearing mice can be bled at the same time as the experimental mice, to ensure equal conditions with the treatment group, the “control” blood can be either discarded, or combined with the blood of the treatment group to provide additional experimental PBMC for the treatment group, at the investigators’ discretion. - Set up one 15 mL tube with 4 mL of lymphocyte isolation medium (see the Table of Materials) per 5‒10 mice bled. Slowly layer blood (collected from tumor-bearing mice) on top of the medium. Spin the cells for 20 min at 1,000‒1,500 x g to separate the PBMC from red blood cells.
- At the end of centrifugation, collect the top plasma layer, leaving ~0.5 mL remaining above the buffy coat, and store at 4 °C for later use (step 7.1).
- Collect the buffy coat layer into a clean 15 mL tube, fill with PBS to 15 mL, and spin for 10 min at 250 x g in a standard tissue culture centrifuge to collect the PBMC.
- Carefully pipet off the supernatant, and resuspend the pellet by flicking the tube. Do not decant, as the pellet is soft and can be lost. Add 2 mL of ACK red blood cell lysis buffer (see the Table of Materials) to the tube to remove any remaining red blood cells from the PBMC. Incubate on ice for 10 min.
- Fill the tube with PBS to 15 mL, and spin down for 10 min at 250 x g in a standard tissue culture centrifuge to collect the PBMC.
- Carefully pipet off the supernatant, and resuspend the pellet by flicking. Do not decant, as the pellet is soft and can be lost.
NOTE: At this step, the purified PBMC can be modified as best suits the experiment. The various PBMC components (platelets, monocytes, other immune cell types) can be depleted or isolated from the PBMC as needed. Also, PBMC themselves can be exposed to 8-MOPA, either before or after section 4 (before or after plate passage—after section 2 or before section 5), by following the protocol steps 3.3‒3.8 and substituting PBMC for YUMM1.7 cells. This will truncate the immunogenic capacity of the treatment, and instead promote immune tolerance. - For each treatment group (each 5 experimental mice + 5 control mice), resuspend the PBMC pellet in 300 μL FBS.
3. 8-MOP/UVA Treatment of Tumor Cells
- Culture and collect YUMM1.7 tumor cells as described in steps 1.2–1.3 to prepare an 8-MOPA-exposed tumor cell antigen source.
- Prepare 2.5 x 10⁶ YUMM1.7 tumor cells per treatment group of 5 mice. For each treatment group, resuspend the tumor cell pellet in FBS at 2.5 x 10⁶ cells/300 μL (~8.33 x 10⁶ cells/mL).
- With tissue culture hood lights off, add 8-MOP (see the Table of Materials) to the YUMM1.7 tumor cell suspension for a final 8-MOP concentration of 100 ng/mL.
CAUTION: 8-MOP is a photoactivatable DNA-damaging agent and carcinogen. Use caution when handling and dispensing, avoid contact with exposed skin, and discard appropriately. - Mix the cells well, wrap the cell container in tin foil, and incubate for 20 min at 37 °C.
- Pre-coat a 12-well tissue culture plate by filling one well for every treatment group of 5 mice (2.5 x 10⁶ YUMM1.7 tumor cells) with 1 mL of FBS, and refrigerate filled plate for 20 min at 4 °C.
- Turn on the UVA light source to pre-warm it.
CAUTION: UVA light is a carcinogen. When working with UVA light sources work quickly and carefully, protect skin from exposure, and use face shields or goggles to protect face and eyes. - After 20 min, move the refrigerated 12-well plate (step 3.5) to the tissue culture hood, remove FBS from wells, and add 300 µL (2.5 x 10⁶ cells/well) MOP-exposed tumor cells (from step 3.4) per well.
- Expose the cell-containing plate to the pre-warmed UVA light source for total irradiation of 4 J/cm2.
NOTE: The 8-MOP concentration and UVA dose described here are calibrated for the YUMM1.7 tumor cell line. A titration of 8-MOP/UVA dose, sufficient to cause 100% tumor cell death within 1 week of exposure, should be performed for each experimental tumor cell line, in order to determine effective killing dose. This is critically important for mouse in vivo TI experiments, because cells are reinjected retro-orbitally (step 6.1) and thus any undamaged tumor cells may otherwise form eye tumors in the treated animal. As a guideline, 4‒8 J/cm2 of UVA, 100‒200 ng/mL 8-MOP, is the typical effective range for most tumor cell lines. - Collect 8-MOPA-treated tumor cells from each well, swirling the plate and pipetting carefully to ensure complete cell recovery.
4. TI plate Passage of Cells
- For each treatment group of 5 mice, combine in one 1.5 mL conical tube 300 μL of the appropriate PBMC (from step 2.11) and 300 μL of 8-MOPA-treated tumor cells (from step 3.9). Mix the cells.
- Use a 10 mL syringe to fill the “entrance” and “exit” sets of TI tubing (see the
Table of Materials) with FBS. Open the tubing clamps to fill the tubes, and close clamps once the tubes are filled before disconnecting the syringe, to retain FBS inside the tubing. - Use a P1000 pipette to add the PBMC and tumor cell mix (from step 4.1) to the TI plate (see the Table of Materials). Hold the plate at a 45° angle, place the pipette tip securely into the TI plate intake, and fill the plate slowly, avoiding bubbles.
- Remove the pipette tip from the intake before releasing the pipette plunger. The plate holds 450 μL; return the remaining cells to the 1.5 mL conical tube.
- Incubate the FBS-filled tubing, the cell-filled TI plate, and the 1.5 mL conical tube containing the remaining cells in the tissue culture incubator at 37 °C for 1 h. After incubation, empty the TI tubing by gravity, releasing the clamps.
- Use a P1000 pipette to remove cells from the TI plate by inserting the pipette tip with the plunger depressed into the plate port. Hold the plate at a 45° angle and fill the P1000 pipette tip. Place cells back into their original 1.5 mL conical tube.
- To run the TI plate, connect the exit tube to the plate and secure the TI plate into the plate running system.
- Using a 1 mL syringe, draw up the 600 μL of PBMC and tumor cell mix from the 1.5 mL conical tube, get rid of any bubbles in the syringe, attach the syringe to the entrance tube with the clamp open and slowly fill until fluid reaches the end of the tubing.
- Attach the free end of the entrance tube to the TI plate and continue gently loading the remaining volume. Close the entrance clamp.
- Detach the 1 mL syringe and connect the entrance tubing to the syringe pump. Secure the exit tubing to a clean 1.5 mL conical tube for cell collection.
- Adjust the syringe pump flow rate to 0.09 mL/min, but do not start the pump yet. Tilt the TI plate ~30° towards the syringe pump side, using a TI plate running platform or any other means (e.g., a small flat object under one end of the plate).
- Carefully release the clamp on the entrance tubing. Start the syringe pump, observing carefully how the TI plate fills, and flick tubing or plate as necessary should any air bubbles impede the flow.
- Once the TI plate is completely filled, tilt it ~30° in the opposite direction as it empties. When all the cells and liquid are in the 1.5 mL conical collection tube, stop the pump.
- To wash the TI plate, disconnect the entrance tubing from the syringe pump, connect to a 1 mL syringe filled with 600 μL FBS, and follow the procedure for steps 4.8‒4.9.
- Adjust the syringe pump flow rate to 0.49 mL/min, release the entrance clamp, and run the TI plate as described in steps 4.12‒4.13, collecting the wash in the same 1.5 mL conical tube. Flick or tap the TI plate gently the entire time, to aid in detaching and eluting any adherent cells.
- Spin the collection 1.5 mL conical tube in the benchtop microfuge at 250 x g for 8 min. Discard the supernatant.
5. Preparation of Autologous Mouse Serum for Overnight Culture Medium
- Collect blood from 10‒12 week old C57BL/6J mice by any institutionally approved method (e.g., eye bleed, tail vein bleed, cheek bleed, or terminal bleed-out by cardiac puncture), without any anticoagulants. Estimate collecting 1 mL blood for every 300 μL of serum needed.
NOTE: One would need 300 μL of serum for every treatment group of 5 mice in the experiment. - Allow blood to clot overnight at 4 °C.
- Spin down the coagulated blood at 3,000 x g for 15 min. Carefully collect the top serum-containing layer
NOTE: Serum can be used immediately to make the overnight cell incubation medium (step 6.1), or preserved for future experiments. To preserve the serum, freeze in aliquots at -20 °C.
6. Overnight Co-incubation of PBMC with Antigen
- Resuspend the PBMC and tumor cell pellet (step 4.5) in 2 mL of clear RPMI with 15% autologous mouse serum (prepared in step 5). Plate in a 35 mm non-tissue-culture treated sterile dish, and incubate overnight under standard tissue culture conditions (37 °C, 5% CO2).
NOTE: If PBMC are being used with a non-cellular antigen (peptide, nanoparticle, protein, etc.), omit section 3 of the protocol, and proceed from section 2 directly to section 4, adding the desired antigen to the TI plate-passed PBMC for overnight co-incubation here in step 6.1. - On the following day, carefully detach any adherent cells from the bottom of the dish with a tissue culture scraper, rotating the dish while scraping to ensure even cell collection. Collect the cells in a 15 mL tube.
- Add 2 mL PBS to the dish and repeat the scraping step, collecting the cells into the same tube. Rinse the 35 mm dish with 1 mL PBS and add the rinse to the same tube.
- Spin for 10 min at 250 x g in a standard tissue culture centrifuge to collect the cells. Carefully pipet off the supernatant and resuspend the pellet by flicking the tube. Do not decant, as the pellet is soft and can be lost.
7. Re-injection of TI-treated Cells into Tumor-bearing Mice
- Spin down autologous plasma (prepared in step 2.4) at 750 x g for 15 min to sediment any particulates. Resuspend the cell pellet (from step 6.4) in 600 μL of autologous plasma or PBS.
- Inject cells at 100 μL per mouse into the retro-orbital plexus of appropriately anesthetized (e.g., 3‒5% Isoflurane inhalant gas, anesthesia confirmed by lack of hind paw pinch reflex) tumor-bearing experimental mice. If so desired, re-inject control tumor bearing mice with 100 μL of autologous plasma alone, or PBS.
- For YUMM1.7 tumor-bearing mice, repeat the treatment (steps 2–7.2) twice a week for 3 weeks, for a total of 6 treatments. Collect and process the PBMC from tumor-bearing mice weekly (protocol sections 2‒4) on Mondays and Thursdays, and re-infuse after overnight incubation (protocol sections 5‒7) on Tuesdays and Fridays.
NOTE: This treatment regimen was developed for the specific growth kinetics of YUMM1.7 tumors in mice. It may need to be titrated for other tumor systems with slower or faster tumor growth rates—respectively increasing or reducing the number of treatments. - Monitor tumor volume via bi-weekly measurement—preferably at the time of therapy administration (Tuesday and Friday)—of perpendicular tumor diameters and height using a caliper. Terminate the experiment when control tumor volumes reach maximal size permitted by institutional guidelines and protocols.
8. Protocol Adaptation for Treating Ssmall Volumes of Human Blood
- Adapt the protocol for use with human cells by first isolating PBMC from human blood. Use heparin as an anti-coagulant, with any preferred PBMC isolation protocol.
- Ensure that the isolated PBMC fraction contains a physiologic number of platelets, for best protocol results. Monitor platelet counts pre- and post-PBMC isolation using any standard hematology counter.
- If using a human cellular antigen source, treat the human antigenic cells following the steps described in section 3 for YUMM1.7 cells. Titrate 8-MOP and UVA doses accordingly.
- Perform plate-passage steps described in section 4, using up to 3 x 10⁷ PBMC per TI plate.
- Culture PBMC overnight with cellular/other antigen of choice, as described in section 6, but substitute 15% human AB serum for autologous mouse plasma for the overnight culture medium in step 6.1.
- Use the resulting cells in any desired assay. For instance, co-culture with antigen-reactive T cells to observe antigen-specific T cell responses initiated by the TI-treated cells.
Results
We recently developed a mouse-to-man scalable miniature ECP device, the TI plate (Figure 1A), and designed corresponding treatment protocols. The device and protocol reproduce key cellular and in vivo features of immunizing ECP, termed “transimmunization”.
The proof-of-principle murine transimmunization protocol11 (Figure 1B) consists of extracorporeal TI plate passage of peripheral blood mononuclear cells (PBMC) from tumor-bearing mice together with apoptotic 8-MOPA–exposed tumor cells. Notably, the TI chamber is transparent and sized to match the standard microscopy slide format, allowing for easy visualization of cell interactions within the TI plate at any point of the protocol (Video 1). The TI-plate-activated immune cells are incubated overnight with the 8-MOPA-exposed apoptotic tumor cells, facilitating tumor cell uptake, processing, and transfer of tumor antigens to the DCs. On the following day, the co-incubated cell mixture is returned into the blood stream of the tumor-bearing animal. Control animals undergo identical blood collection procedures, to normalize for any effects of lymphodepletion on tumor growth, but instead receive PBS re-infusions. Tumor growth in all animals is monitored throughout the experiment.
In studies using the YUMM1.7 syngeneic murine melanoma model18, the transimmunization protocol was repeated twice weekly over three weeks, for a total of six treatments in each animal (Figure 1B). The therapy appeared well tolerated in all animals treated (>100), and consistently showed reduction of YUMM1.7 tumor growth in treated versus control animals, as observed in 9 independent experiments conducted over 2 years (Figure 2A,B). The results show cumulative tumor growth data in transimmunization-treated and control animals over all experiments performed (Figure 2A), as well as representative tumor growth curves for individual animals within one experiment, to provide a sense of variability in the system (Figure 2B).
We found that the protocol’s success critically depends on the presence of monocytes in the treated PBMC, the presence of platelets in the PBMC fraction, and the TI plate passage step. When plate passage is omitted, or when either platelets or monocytes are depleted from the PBMC fraction, the therapeutic effect is no longer observed (Figure 3A). The treatment also requires the presence of apoptotic tumor cells. It is ineffective in the absence of either the immune cells or an antigen source, or in the presence of mismatched antigen, for instance when mice bearing YUMM1.7 tumors are treated using MC38 colon carcinoma cells (Figure 3B). For an immunizing outcome it is also critical to avoid PBMC exposure to 8-MOPA. 8-MOPA-exposed PBMC not only abrogate, or possibly even reverse, anti-tumor immunity (Figure 3C), but also inhibit the immunizing potential of unexposed cells, as in the experiment where an equal number of 8-MOPA-exposed and 8-MOPA-protected PBMC were used with no observable anti-tumor effect (Figure 3C).
With human PBMC, the TI chamber and the transimmunization protocol lead to successful monocyte activation into DC, indistinguishable by cell surface and intracellular activation markers from that achieved by the clinical ECP plate (Table 1). As in the mouse studies, DC activation (Figure 4A) and the ability of transimmunization-generated DCs to process and present antigen (Figure 4B,C) critically depend on the presence of platelets in the PBMC, and on TI plate passage. The Transimmunization-activated human DCs can effectively process and cross-present either peptide antigens (Figure 4B), or antigens from whole 8-MOPA-exposed human tumor cells, to activate human antigen-specific T cell lines in in vitro assays (Figure 4C), in a TI and platelet-dependent manner (Figure 4B,C).
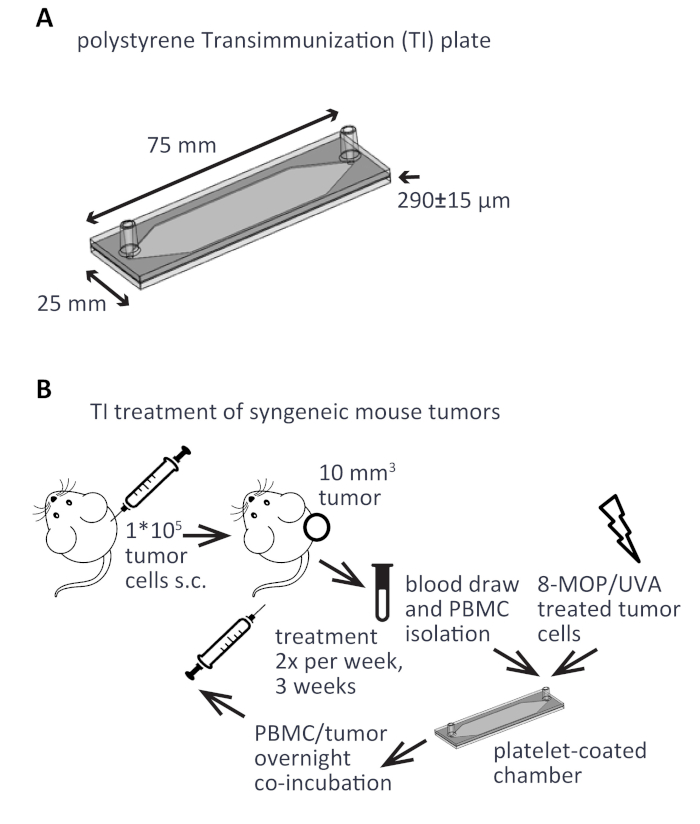
Figure 1: Transimmunization (TI) chamber and protocol schematics. (A) Diagram and specifications of the transimmunization treatment chamber (TI plate). (B) Schematic description of transimmunization treatment experimental workflow. Briefly, animals are inoculated subcutaneously (s.c.) with syngeneic tumor cells; animals with palpable tumors are treated twice weekly by blood draw, isolation of PBMC from blood, PBMC flow passage through the autologous platelet-coated TI plate in the presence of 8-MOP/UVA treated tumor cells, PBMC and tumor cell co-incubation overnight, and re-injection of the cells intravenously into the same tumor-bearing animals. Tumor volume is measured throughout the experiment. This figure has been modified from11. Please click here to view a larger version of this figure.
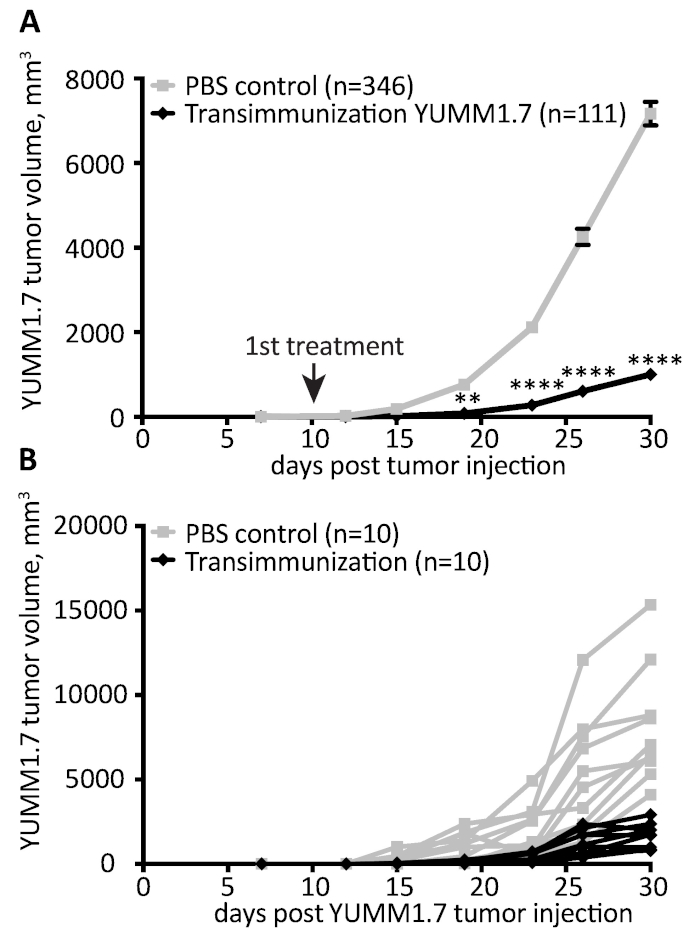
Figure 2: Transimmunization controls growth of YUMM1.7 melanoma syngeneic tumors. (A) YUMM1.7 tumor volume over time plotted for C57BL/6 mice inoculated with 1 x 10⁵ YUMM1.7 tumor cells, and receiving either six transimmunization treatments (black line), or six control treatments (gray line). Data are cumulative over nine independent experiments conducted over two years. (B) Data from a single representative YUMM1.7 transimmunizaton experiment, with each line showing tumor growth for an individual mouse. (A and B) “PBS control” mice in all experiments were bled on the same schedule as the experimental animals, but received six sterile PBS re-infusions. Error bars represent SEM, p-values calculated for each time point using Sidak’s multiple comparisons test; **, p = 0.0013; ****, p < 0.0001. This figure has been modified from11. Please click here to view a larger version of this figure.
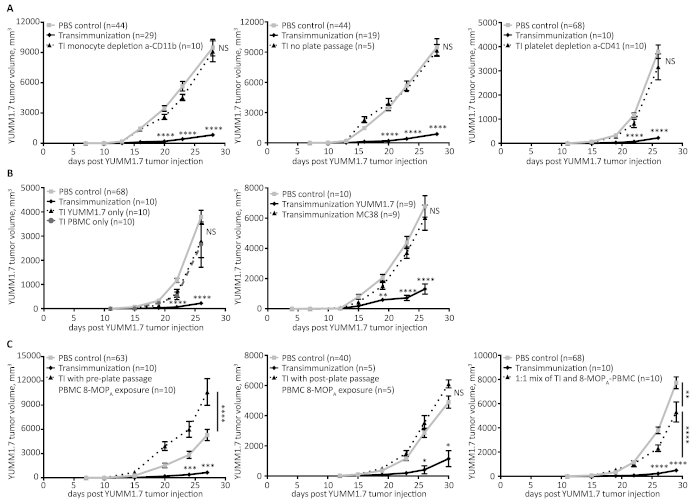
Figure 3: Transimmunization requires monocytes and platelets in TI plate-passed PBMC fraction, as well as 8-MOPA treatment of antigen-matched tumor cells and 8-MOPA sparing of PBMC. (A) YUMM1.7 tumor volume over time plotted for C57BL/6 mice inoculated with 1*105 YUMM1.7 tumor cells, and receiving either six transimmunization treatments (solid black lines), six control treatments (solid gray lines), or six TI treatments where monocytes or platelets were depleted from PBMC prior to plate passage step (using a-CD11b and a-CD41 depletion kits, respectively), or plate passage was omitted (dotted lines). (B) Tumor volume over time plotted for C57BL/6 mice inoculated with 1 x 10⁵ YUMM1.7 tumor cells, and receiving either six transimmunization treatments (solid black lines), six control treatments (solid gray lines), PBMC alone (dashed line), 8-MOPA-treated YUMM1.7 cells alone, or TI using 8-MOPA-treated MC38 tumor cells (dotted lines). (C) Tumor volume over time plotted for C57BL/6 mice inoculated with 1 x 10⁵ YUMM1.7 tumor cells, and receiving either six Transimmunization treatments (solid black lines), six control treatments (solid gray lines), six TI treatments where PBMC were uniformly exposed to 8-MOPA immediately before plate passage, six TI treatments where PBMC were uniformly exposed to 8-MOPA immediately after plate passage, or six treatments where TI cells after plate passage were mixed 1:1 with an equal number of PBMC that have been uniformly exposed to 8-MOPA irradiation (dotted lines). (A, B and C) “PBS control” mice in all experiments were bled on the same schedule as the experimental animals, but received six sterile PBS re-infusions. Data are provided for representative experiments. Bars represent SEM, P-values calculated for each time point using Sidak’s multiple comparisons test; *, p < 0.05; **, p < 0.01; ***, p < 0.001; ****, p < 0.0001; NS = differences not significant. This figure has been modified from11. Please click here to view a larger version of this figure.
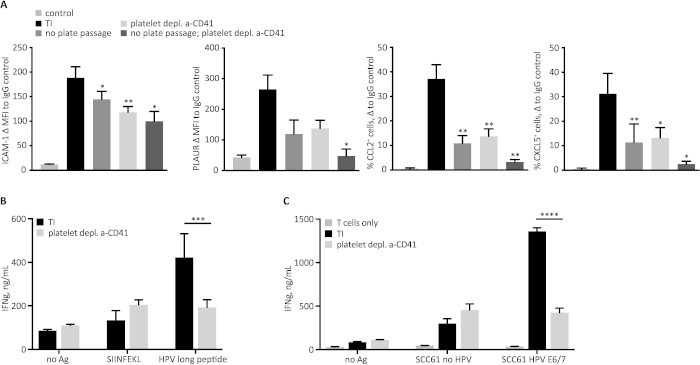
Figure 4: TI protocol with TI chamber rapidly induces DC maturation, unique activation profile, and T cell activating capacity in human PBMC, dependent on plate passage and platelets.
A. FACS analysis of the indicated markers in CD11c+ cells among either freshly isolated human PBMC (“control”), PBMC treated with the TI protocol (“TI”), or TI-treated PBMC where plate passage was omitted, platelets were depleted using the a-CD41 bead kit prior to plate passage, or both of the above were performed. Data summarize six independent experiments with three blood donors. Bars represent mean values, while error bars represent SEM. P-values for each comparison calculated using paired t-test; *, p < 0.05; **, p < 0.01. Panels have been modified from11. B. Platelet-containing or platelet-depleted TI-treated human PBMC were co-incubated overnight with an irrelevant (SIINFEKL) peptide, or with long peptide for head-and-neck squamous cell carcinoma-associated HPV E7 protein. The PBMC were then used to stimulate a human CD8 T cell line specifically reactive to E7 peptide. T cell stimulation was measured by IFNg production after 5 days of culture. (C) Platelet-containing or platelet-depleted TI-treated human PBMC were co-incubated overnight with 8-MOPA-treated head-and-neck squamous cell carcinoma cell line SCC61, either expressing (SCC61 HPV E6/7) or not expressing (SCC61 no HPV) the antigenic HPV E6 and E7 proteins19. The PBMC were then used to stimulate a human CD8 T cell line specifically reactive to E7 peptide. T cell stimulation was measured by IFNg production after 5 days of culture. (B and C) Data show representative experiments with three replicates in each. Bars represent mean values, while error bars represent SEM. P-values for each comparison calculated using Sidak’s multiple comparisons test; ***, p < 0.001; ****, p < 0.0001. Please click here to view a larger version of this figure.
| marker | parameter | untreated | ECP plate with TI protocol | TI plate with TI protocol | p-value ECP vs TI |
| HLA-DR | Δ MFI | 100.1 ± 42.4 | 439.8 ± 152.5 | 417.7 ± 152.2 | NS |
| CD80 | Δ % | 3.9 ± 1.1 | 22.3 ± 7.2 | 24.5 ± 7.2 | NS |
| CD83 | Δ MFI | 0.3 ± 0.2 | 53.3 ± 9.7 | 51.4 ± 17.4 | NS |
| CD86 | Δ MFI | 10.8 ± 1.7 | 103.9 ± 23.4 | 87.1 ± 17.6 | NS |
| PLAUR | Δ MFI | 54.5 ± 12 | 721.4 ± 183.6 | 528.7 ± 135.5 | NS |
| ICAM1 | Δ MFI | 12.2 ± 1.6 | 179.6 ± 28.5 | 192.5 ± 25.4 | NS |
| ITGB5 | Δ MFI | 53.6 ± 25.7 | 97.1 ± 31.6 | 103.8 ± 32.8 | NS |
| CCL2 (MCP-1) | Δ % | 0.6 ± 0.5 | 70.1 ± 6.7 | 55.2 ± 8.9 | NS |
| CXCL5 | Δ % | 0.7 ± 0.4 | 39.1 ± 7.2 | 41.5 ± 4.7 | NS |
| CXCL16 | Δ % | 0.3 ± 0.2 | 28.0 ± 8.8 | 35.3 ± 11.7 | NS |
| CD105 (endoglin) | Δ MFI | 3.6 ± 0.3 | 124.3 ± 25.4 | 141.8 ± 33.2 | NS |
| CD112 (nectin 2) | Δ MFI | 10.9 ± 1.8 | 47.3 ± 5.2 | 50.9 ± 9.2 | NS |
| CD120a (TNFR-1) | Δ MFI | 10.1 ± 2.6 | 2.2 ± 1.4 | 1.8 ± 1.1 | NS |
| CD137L (4-1BBL) | Δ MFI | 2.9 ± 1.5 | 1.0 ± 0.4 | 1.2 ± 0.6 | NS |
Table 1: TI protocol with TI chamber rapidly induces DC maturation equivalent to that induced by TI protocol with the clinical ECP chamber. FACS analysis of change of the indicated markers from corresponding IgG controls in live human CD11c+ cells among either freshly isolated PBMC (“untreated”), PBMC passed through the clinical ECP plate following the TI protocol (“ECP plate with TI protocol”) and analyzed following overnight incubation, or PBMC treated with the TI protocol (“TI plate with protocol”) and analyzed following overnight incubation. For markers, such as HLA-DR, where the entire cell population was altered, data are expressed as change in mean fluorescence intensity (MFI). For markers where only a subset of cells express the marker, such as CCL2, difference in percent marker-positive cells of live CD11c+ PBMC is instead represented. Data summarize six independent experiments with three blood donors. Data for each marker are expressed as aver- age ± standard error of the mean (SEM). P-values for each comparison calculated using paired t test; NS = differences not significant. Table has been modified from11.
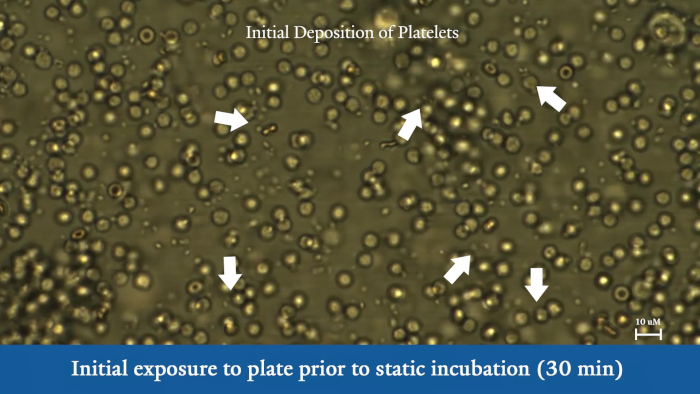
Video 1: Live cell imaging of platelet and immune cell interactions within the TI plate.
PBMC were prepared as described in protocol section 2 above and exposed to the transimmunization plate as described in section 4, except the static incubation period in step 4.2.3 was reduced from 1 h to 30 min. During the TI protocol, the TI plate, which is identical in size to a standard microscope slide, was fitted into the slide holding stage of an fluorescence imaging system and the cells within it were imaged at 40x magnification and at 37 °C during the plate filling (4.2.2), plate incubation (4.2.3), and plate flow (4.3.5) stages. Continuous images were acquired and movies produced using the “Automated Scanning Routine” software. The captions below the video indicate the stage of the protocol that the cells are being filmed at. Arrows and circles in the video, with the associated captions, point out the cells and areas of interest. The 10 μM scale bar is present in the lower right corner throughout the video. Please click here to view this video. (Right-click to download.)
Discussion
The miniaturized device and protocol described above for the first time allow for efficient laboratory investigation of mechanisms of ECP in mouse experimental systems, and in small human blood samples. This is a great advance; for instance, it allowed us to demonstrate for the first time the efficacy of transimmunization against solid tumors in a mouse model 11, opening the future possibility of a similar application in human oncology.
Prior to the development of the transimmunization device and method described here, it was impossible to fully investigate all aspects of ECP. In mouse models, although the 8-MOPA aspect of the therapy could be replicated somewhat by treating cells in a Petri dish12,20, there was no capacity to integrate into the method the plate passage, which has been shown to provide dynamic platelet interactions that are critically important for ECP’s physiological DC activation14. In human studies, alternatively, the flow component was fully present, but the ability to selectively expose specific cellular components to 8-MOPA, or to protect them from it, was missing21,22. This prevented the full understanding of ECP mechanism, and its optimization for immunity or tolerance. In addition, the amount of blood required to work with the clinical ECP apparatus is large, hampering scientific inquiry. The miniaturized ECP device and protocol described here for the first time allow for efficient, fully flexible and tunable laboratory ECP modeling. In addition, the TI plate allows for real-time visualization and monitoring of cell interactions within the plate by microscopy.
For the protocol’s success using both in vivo and ex vivo systems, it is critical that the treated PBMC contain monocytes that can be activated into functional DCs. For this activation to proceed, it is also necessary to ensure the PBMC fraction contains a physiologic number of healthy, activatable platelets, and that the TI plate passage protocol is followed closely. In order to direct the newly-activated DCs towards a specific reactivity, they must be provided with antigen. We have found that the most efficient method of antigen delivery for anti-cancer immunity is overnight co-incubation of the newly activated DCs with antigen-containing 8-MOPA-exposed tumor cells. This has the added advantage of being able to create an immunogenic anti-cancer response without necessitating prior knowledge of the tumor antigens, by allowing the DCs to select them. However, in cases where the antigen is known, we had some success in ex vivo systems when using free peptides as antigens in co-incubation. For immunogenic applications, the DCs themselves should be protected from 8-MOPA exposure. Finally, in in vivo experiments, it is important to work with an animal model that is capable of anti-tumor immunity. Transimmunization works by creating activated, antigen-specific DCs, which work in the body to initiate innate and adaptive immune responses. Impaired activity or lack of the NK, CD4, or CD8 T cells in the treated mouse will impact the protocol’s efficacy5,11.
While the protocol described here is a proof-of-principle one that has been optimized for a mouse solid syngeneic tumor model, it nevertheless reveals many opportunities. The mechanisms of ECP in oncology are only just being elucidated, and there is still much room for improved understanding. More broadly, the ability to generate physiologically activated mouse and human DCs, and to selectively direct them towards antigen-specific immunity has many potential applications beyond cancer. The ability to do the same, but instead direct the DCs towards antigen-specific tolerance, as is suggested by the tolerizing efficacy of ECP itself, also has wide-ranging medical implications. With this method, we hope to provide the tools and open a productive avenue of research for anyone with an interest in physiologic DC therapies.
Disclosures
Yale University owns patents deriving from the dendritic cell research of Prof. Richard Edelson that have been licensed to a Yale start-up company, Transimmune AG. Richard Edelson and Michael Girardi are scientific consultants to Transimmune AG, while Olga Sobolev is a Transimmune AG employee. Transimmune AG does not have any current commercial products, however on a collaborative basis it produces the Transimmune plates used in this article. It is possible that these three authors could potentially benefit from commercialization of these discoveries in the future.
Acknowledgements
This work was supported by NIH-NCI Spore Grant 1 P50 CA121974 (R. Edelson, M. Girardi); NIH Cancer Center Support Grant 3 P30 CA16359-28S1 (R. Edelson, M. Girardi); the Howard Hughes Medical Institute training fellowship (A. Vassall); and the NY Cardiac Foundation (R. Edelson, A. Ventura, A. Vassall, H. Ezaldein). Partial support was provided by R01 CA196660-01 to M. Bosenberg.
The authors are grateful to Dr. Robert Tigelaar for his mentoring, guidance, and experimental insight. We thank our colleagues at Fraunhofer IBMT, especially Dr. Thorsten Knoll, for developing and providing the ECP-equivalent TI chamber. Nicholas Theodosakis kindly helped with initial stages of the YUMM experiments. We thank our volunteer blood donors, Inger Christensen and her professional staff at Yale ECP Treatment Center for help with volunteer blood procurement. Dr. Wendell Yarbrough and Dr. Natalia Issaeva kindly shared with us the SCC61 and SCC61-E6/7 cell lines. For technical assistance on the project, we thank Dr. Julia Lewis for FACS protocol advice, and E. Menet, G. Tokmoulina, C. Cote at Yale FACS Core. Movie images of cells within the TI plate were acquired with the assistance of Felix Rivera-Molina, PhD, Dept of Cell Biology and Yale CINEMA Imaging Center, Yale School of Medicine. Movie production was supervised by Andrew Osborne, Senior Video Producer, Office of Communications, Yale School of Medicine.
Materials
| Name | Company | Catalog Number | Comments |
|---|---|---|---|
| 8-MOP (UVADEX 20ug/mL, 10 mL) | Therakos, Inc | Rx only, NDC No. 64067-0216-01 | Protocol steps 3 and 8 - mouse and human 8-MOP/UVA treatment of cells |
| AB serum | Lonza BioWhittaker | 14-498E | Protocol step 8.5 - overnight culture of human PBMC |
| ACK red cell lysis buffer | Lonza BioWhittaker | 10-548E | Protocol step 2 - mouse PBMC preparation |
| Anesthesia Tabletop V1 system with active scavenging | VetEquip | 901820 | Protocol steps 1 and 7 - mouse sc tumor introduction and TI administration |
| Autologous mouse plasma | prepare in lab | n/a | Prepare per protocol step 2.4, use in 7.1 - mouse TI treatment administration |
| Autologous mouse serum | prepare in lab | n/a | Prepare per protocol step 5, use in step 6.1 - overnight culture of mouse PBMC |
| C57Bl/6J mice | Jackson labs | 0000664 | Protocol steps 1, 2, 5 and 7 - mouse tumor injection, blood/serum collection, and therapy return |
| Cheek bleed GoldenRod lancet, 5 um | Medipoint | 9891620 | Protocol step 2 - mouse PBMC preparation |
| Clear RPMI | Gibco by LifeTech | 11835-030 | Protocol steps 6 and 8 - overnight culture of mouse/human PBMC |
| DMEM/F12 | Gibco by LifeTech | 11330-032 | Protocol steps 1 and 2 - YUMM1.7 cell culture |
| EasyGrip Petri Dishes, 35mm | Falcon | 351008 | Protocol steps 5 and 8 - overnight culture of mouse/human PBMC |
| Eppendorf 1.5mL conical tubes | DOT scientific | 1700-GMT | Protocol steps 1-8 |
| FBS (fetal bovine serum, heat-inactivated) | SAFC Biosciences | 12306C-500mL | Protocol steps 1-4 - YUMM1.7 cell culture, 8-MOP/UVA treatment of cells, TI plate |
| Hemavet 950FS hematology counter | Drew Scientific | HV950FS | Protocol step 8.2 - monitoring human platelet numbers |
| Heparin 5,000U/mL | McKesson Packaging services | 949512 | Protocol steps 2 and 8 - mouse and human PBMC preparation |
| Isoflurane | Abbott Laboratories | 5260-04-05 | Protocol steps 1 and 7 - mouse sc tumor introduction and TI administration |
| Lympholyte M lymphocyte isolation medium | Cedarlane Labs | CL5035 | Protocol step 2 - mouse PBMC preparation |
| Non-essential amino acids | Gibco by LifeTech | 11140-050 | Protocol steps 1 and 2 - YUMM1.7 cell culture |
| PBS (1x DPBS, (-) Ca+2, (-) Mg+2) | Gibco by LifeTech | 14190-144 | Protocol steps 1-7 |
| Pen/strep | Gibco by LifeTech | 15140-122 | Protocol steps 1 and 2 - YUMM1.7 cell culture |
| Polypropylene 15mL conical tubes | Falcon | 352097 | Protocol steps 1-8 |
| Programmable 2-channel syringe pump | New Era Pump Systems Inc | model NE-4000 | Protocol steps 4 and 8 - running the TI plate |
| Retro-orbital injection needles, 27G x 1/2 | BD Biosciences | 305109 | Protocol step 7 - mouse TI treatment administration |
| Syringes, 10mL (LUER-LokTip) | BD Biosciences | 309604 | Protocol steps 4, 8 - running the TI plate |
| Syringes, 1mL (Slip tip) | BD Biosciences | 309659 | Protocol steps 1, 4, 7, 8 |
| TI plate and tubing set | Transimmune AG | not commercially available | Please contact Prof. R. Edelson or Transimmune in order to obtain the device on a collaborative basis. |
| TI plate running platform | Transimmune AG | not commercially available | Please contact Prof. R. Edelson or Transimmune in order to obtain the device on a collaborative basis. |
| Tissue culture flasks, T75 (75 cm2) | Falcon | 353136 | Protocol steps 1, 2, 6 and 8 - mouse and human cell culture |
| Tissue culture plates, 12-well | Falcon | 353043 | Protocol steps 3 and 8 - mouse and human 8-MOP/UVA treatment of cells |
| Tissue culture scrapers | Falcon | 353085 | Protocol steps 6 and 8 - overnight culture of mouse/human PBMC |
| Trypsin-EDTA 0.25% (1x) | Gibco by LifeTech | 25200-056 | Protocol steps 1 and 2 - YUMM1.7 cell culture |
| Tumor injection needles, 25G x 5/8 | BD Biosciences | 305122 | Protocol step 1 - mouse subcutaneous tumor introduction |
| UVA irradiator | Johnson and Johnson | not commercially available | The apparatus was specifically developed by J&J for Prof. R. Edelson's laboratory. Several machines are available in the laboratory on a collaborative basis; please contact Prof. R. Edelson for use of one. Alternative UVA irradiators are commercially available but have not been tested by us. |
| Invitrogen EVOS FL Auto 2 Imaging System | Invitrogen | fluorescence imaging instrument |
References
- Edelson, R., et al. Treatment of cutaneous T-cell lymphoma by extracorporeal photochemotherapy. Preliminary results. The New England Journal of Medicine. 316 (6), 297-303 (1987).
- Berger, C. L., Wang, N., Christensen, I., Longley, J., Heald, P., Edelson, R. L. The immune response to class I-associated tumor-specific cutaneous T-cell lymphoma antigens. The Journal of Investigative Dermatology. 107 (3), 392-397 (1996).
- Scarisbrick, J. J., et al. A multicentre UK study of GVHD following DLI: rates of GVHD are high but mortality from GVHD is infrequent. Bone Marrow Transplantation. 50 (1), 62-67 (2015).
- Barten, M. J., Dieterlen, M. -T. Extracorporeal photopheresis after heart transplantation. Immunotherapy. 6 (8), 927-944 (2014).
- Heald, P., et al. Treatment of erythrodermic cutaneous T-cell lymphoma with extracorporeal photochemotherapy. Journal of the American Academy of Dermatology. 27 (3), 427-433 (1992).
- Ratcliffe, N., et al. National Institutes of Health State of the Science Symposium in Therapeutic Apheresis: Scientific Opportunities in Extracorporeal Photopheresis. Transfusion Medicine Reviews. 29 (1), 62-70 (2015).
- Edelson, R., Wu, Y., Schneiderman, J. American council on ECP (ACE): Why now? Journal of Clinical Apheresis. , (2018).
- Edelson, R. L. Mechanistic insights into extracorporeal photochemotherapy: Efficient induction of monocyte-to-dendritic cell maturation. Transfusion and Apheresis Science. 50 (3), 322-329 (2014).
- Gasparro, F. P., Dall’Amico, R., Goldminz, D., Simmons, E., Weingold, D. Molecular aspects of extracorporeal photochemotherapy. The Yale journal of biology and medicine. 62 (6), 579(1989).
- Bevilacqua, P. M., Edelson, R. L., Gasparro, F. P. High-performance liquid chromotography analysis of 8-methoxypsoralen monoadducts and crosslinks in lymphocytes and keratinocytes. The Journal of Investigative Dermatology. 97 (1), 151-155 (1991).
- Ventura, A., et al. Extracorporeal Photochemotherapy Drives Monocyte-to-Dendritic Cell Maturation to Induce Anticancer Immunity. Cancer Research. 78 (14), 4045-4058 (2018).
- Perez, M., Lobo, F. M., Yamane, Y., John, L., Berger, C. L., Edelson, R. L. Inhibition of antiskin allograft immunity induced by infusions with photoinactivated effector T lymphocytes (PET cells). Is in vivo cell transferrable? Annals of the New York Academy of Sciences. 636 (1), 95-112 (1991).
- Girardi, M., et al. Transimmunization for cutaneous T cell lymphoma: A phase I study. Leukemia & Lymphoma. 47 (8), 1495-1503 (2006).
- Durazzo, T. S., Tigelaar, R. E., Filler, R., Hayday, A., Girardi, M., Edelson, R. L. Induction of monocyte-to-dendritic cell maturation by extracorporeal photochemotherapy: Initiation via direct platelet signaling. Transfusion and Apheresis Science. 50 (3), 370-378 (2014).
- Gonzalez, A. L., Berger, C. L., Remington, J., Girardi, M., Tigelaar, R. E., Edelson, R. L. Integrin-driven monocyte to dendritic cell conversion in modified extracorporeal photochemotherapy: ECP activation of monocytes by fibronectin. Clinical & Experimental Immunology. 175 (3), 449-457 (2014).
- Kibbi, N., Sobolev, O., Girardi, M., Edelson, R. L. Induction of anti-tumor CD8 T cell responses by experimental ECP-induced human dendritic antigen presenting cells. Transfusion and Apheresis Science. 55 (1), 146-152 (2016).
- Maeda, A., Schwarz, A., Bullinger, A., Morita, A., Peritt, D., Schwarz, T. Experimental Extracorporeal Photopheresis Inhibits the Sensitization and Effector Phases of Contact Hypersensitivity via Two Mechanisms. Generation of IL-10 and Induction of Regulatory T Cells. The Journal of Immunology. 181 (9), 5956-5962 (2008).
- Meeth, K., Wang, J., Micevic, G., Damsky, W., Bosenberg, M. W. The YUMM lines: a series of congenic mouse melanoma cell lines with defined genetic alterations. Pigment Cell & Melanoma Research. , (2016).
- Gubanova, E., et al. Downregulation of SMG-1 in HPV-Positive Head and Neck Squamous Cell Carcinoma Due to Promoter Hypermethylation Correlates with Improved Survival. Clinical Cancer Research. 18 (5), 1257-1267 (2012).
- Berger, C. L., Perez, M., Laroche, L., Edelson, R. Inhibition of Autoimmune Disease in a Murine Model of Systemic Lupus Erythematosus Induced by Exposure to Syngeneic Photoinactivated Lymphocytes. Journal of Investigative Dermatology. 94 (1), 52-57 (1990).
- Spisek, R., Gasova, Z., Bartunkova, J. Maturation state of dendritic cells during the extracorporeal photopheresis and its relevance for the treatment of chronic graft-versus-host disease. Transfusion. 46 (1), 55-65 (2006).
- Berger, C., et al. Rapid generation of maturationally synchronized human dendritic cells: contribution to the clinical efficacy of extracorporeal photochemotherapy. Blood. 116 (23), 4838-4847 (2010).
Reprints and Permissions
