Elevated spinal fluid protein levels can either be the result of diffusion of plasma protein across an altered blood-brain barrier or intrathecal synthesis. An optimized testing protocol is presented in this article that helps to discriminate both cases and provides quantitative measurements of intrathecally synthesized proteins.
A subscription to JoVE is required to view this content. Sign in or start your free trial.
Method Article
Quantitative Measurement of Intrathecally Synthesized Proteins in Mice
In This Article
Summary
Abstract
Cerebrospinal fluid (CSF), a fluid found in the brain and the spinal cord, is of great importance to both basic and clinical science. The analysis of the CSF protein composition delivers crucial information in basic neuroscience research as well as neurological diseases. One caveat is that proteins measured in CSF may derive from both intrathecal synthesis and transudation from serum, and protein analysis of CSF can only determine the sum of these two components. To discriminate between protein transudation from the blood and intrathecally produced proteins in animal models as well as in humans, CSF protein profiling measurements using conventional protein analysis tools must include the calculation of the albumin CSF/serum quotient (Qalbumin), a marker of the integrity of the blood-brain interface (BBI), and the protein index (Qprotein/Qalbumin), an estimate of intrathecal protein synthesis. This protocol illustrates the entire procedure, from CSF and blood collection to quotients and indices calculations, for the quantitative measurement of intrathecal protein synthesis and BBI impairment in mouse models of neurological disorders.
Introduction
Cerebrospinal fluid (CSF), a clear and colorless liquid surrounding the brain and the spinal cord, holds great clinical and basic scientific importance. The CSF preserves the electrolytic environment of the central nervous system (CNS), balances the systemic acid-base status, supplies nutrients to neuronal and glial cells, functions as a lymphatic system for the CNS, and transports hormones, neurotransmitters, cytokines and other neuropeptides throughout the CNS1. Thus, as the CSF composition reflects the activity of the CNS, this fluid offers a valuable, though indirect, access to characterize the physiological and pathological state of the CNS.
CSF has been used to diagnose conditions that affect the CNS for over a hundred years, and for most of this time, it was primarily studied by clinicians as a diagnostic tool. However, in recent years neurobiologists have recognized the potential of CSF for studying the pathophysiology of the CNS. In particular, several high-throughput protein analysis tools have been introduced in the neuroscience realm allowing a detailed study of the protein composition of the CSF, with the expectation that this analysis may help provide insight into the dynamic changes occurring within the CNS.
Technological developments in multiplex immunoassay techniques such as Luminex and Simoa technologies2,3, provide researchers today with the ability to detect hundreds of proteins at very low concentrations. Moreover, these same technologies allow the use of small sample volumes, thereby promoting studies in small animals, including mice, in which limited sample volumes of CSF has precluded detailed characterizations of the fluid until recently.
Nevertheless, one caveat is that proteins measured in CSF may derive from intrathecal synthesis and/or transudation from serum due to a damaged blood-brain interface (BBI). Unfortunately, protein analysis of CSF alone can only determine the sum of these two components. To discriminate between transudate and intrathecally produced proteins, CSF protein measurements using any available protein analysis tool must be adjusted for individual variability in serum concentrations as well as barrier integrity. However, although this adjustment is commonly used in clinical practice, e.g., the CSF IgG index, which has high sensitivity for detecting intrathecal IgG synthesis4,5,6, to date very few research studies have corrected CSF protein concentrations for serum concentration and barrier integrity7,8.
Currently, the Reibergram approach is the best way to determine the barrier function and intrathecal synthesis of proteins. It is a graphical evaluation in CSF/serum quotient diagrams which analyzes, in an integrated way, both the barrier (dys)function and intrathecal protein synthesis, referring to an exclusively blood-derived protein9,10. The highly abundant protein albumin is usually chosen as reference protein because it is produced only in the liver and because its size, approximately 70 kDa, is intermediate between small and large proteins11. The analysis diagram was first defined by Reiber and Felgenhauer in 1987 for the major classes of immunoglobulins (Igs)11, being empirically based on the results obtained from the analysis of thousands of human samples9. The approach was subsequently confirmed by the application of the two Fick’s laws of diffusion in the theory of molecular diffusion/flow rate12. Such a theory demonstrates the diffusion of a protein through the barrier has a hyperbolic distribution and can quantitatively explain the dynamics of proteins in the CNS9,13. Overall, the advantage of using the Reibergram for demonstrating intrathecal protein synthesis is that it concurrently identifies the protein fraction that enters the CSF from serum as well as the amount of protein found in the CSF because of local production.
The present article and the related protocol describe the entire procedure, from CSF and blood collection to the final calculations correcting CSF protein levels, for the quantitative measurement of intrathecal protein synthesis in mouse models of neurological disorders. This procedure provides a baseline against which to assess (1) the pathophysiological origin of any CSF protein and (2) the stability and functional significance of the barrier integrity. This procedure and protocol are not only useful for assessing mouse CSF samples but are also useful in analyzing CSF in a multitude of animal models of neurological diseases and human patients.
Access restricted. Please log in or start a trial to view this content.
Protocol
All animal work utilizes protocols reviewed and approved by the Institutional Animal Care and Use Committee (IACUC) at Geisel School of Medicine at Dartmouth.
1. Collection of fluids
NOTE: Both serum and CSF are required. Two protocols for each fluid collection are needed for survival and necropsy.
- Serum and CSF collection using survival procedures
NOTE: For survival fluid collection, serum collection should precede CSF collection as it is a less invasive procedure. CSF must be obtained within one week of serum draw.- Retro-orbital bleeding procedure for serum collection.
NOTE: This procedure is for survival bleeding of mice14. The procedure described applies to any age, gender, and strain of mice. Since IACUC rules dictate that a maximum blood volume of 1% of body weight can be removed as a single blood draw, it is recommended the procedure is performed only on mice weighing more than 15 g.- Move the cages containing mice from the rack to an appropriate working area. Prepare the anesthesia gas machine by turning on the oxygen flow meter to 1 L/min.
- Place the animal into the induction chamber and close the lid tightly. Turn on the isoflurane vaporizer to 3.5% and monitor the animal until recumbent.
- Remove the animal from the chamber and assess the level of anesthesia by pedal reflex, i.e., firm footpad pinch. Ensure adequate depth of anesthesia before performing the procedure: lack of response to a firm pinch indicates adequate anesthesia.
- Restrain the anesthetized mouse by grasping the loose skin behind the ears with the thumb and index finger of the non-dominant hand. Bulge the eyes by using the index finger to draw back the skin above the eye and the thumb to draw back the skin below the eyes.
- Place the tip of a Pasteur pipette into the eye socket underneath the eyeball (Figure 1, left panel), directing the tip at approximately 45° toward the middle of the eye socket (Figure 1, right panel). Rotate the pipette between fingers during the forward passage. Apply gentle pressure and then release until blood is entering the pipette.
NOTE: Maximum amount of blood that may be withdrawn at one time from this location is about 1% of body weight, e.g., 0.2 mL from a 20 g mouse. - Gently remove the capillary to prevent injury to the eye and place the collected blood in a 1.5 mL centrifuge tube. Close the eyelid and apply mild pressure with gauze to prevent further bleeding. Once fully alert and mobile (usually 3−5 min), return the mouse to its holding cage.
- Allow blood to clot for 30−60 min at room temperature (RT), then centrifuge blood for 10 min at 2,000 x g in a 4 °C refrigerated centrifuge. Using a clean pipette technique, collect serum into a new, labeled 0.5 mL vial. Immediately freeze vial of serum at -80 °C.
- CSF collection with survival procedure
NOTE: This procedure is for survival surgery, and it is based on the protocol published by Liu and Duff in 200815. The mice are anesthetized by a Ketamine (20 mg/mL), xylazine (0.5 mg/mL), and acepromazine (0.5 mg/mL) cocktail administered intraperitoneally.- Move the cages containing mice from the rack to a designated surgery working area. Prepare surgery space in a sterile environment. Ensure that all instruments and materials used are sterilized before surgery.
- Weigh the mouse and calculate the anesthesia volume needed (0.1 mL of anesthesia cocktail for a 20 g mouse). Inject anesthesia intraperitoneally16. After a few minutes, test the mouse by pinching the footpad to ensure adequate anesthesia. If more anesthetic is required, further inject 0.01−0.03 mL of the anesthetic cocktail.
- Use either scissors or a shaver to shave a small area of the head, on the caudal end, medial on the skull, to expose large enough working area for CSF collection. Position the mouse in the prone position on the stereotaxic instrument, and steady the head by using ear bars (Figure 2A).
NOTE: The mouse is laid down so that the head forms a nearly 135° angle with the body (Figure 2A). Once the animal is positioned, a surgical drape is used to maintain a sterile field at the surgical site. Clear adhesive drapes are preferred for CSF collection in mice, as they allow for direct and more focused visualization of the animal. - Swab the surgical site with 30% chlorhexidine diacetate. Using a sterile scalpel, make a sagittal incision of the skin inferior to the occiput to expose muscles overlying the cisterna magna.
- By blunt dissection with forceps, separate the subcutaneous tissue and muscles to expose the cisterna magna (Figure 2B). Use microretractors to hold the muscles apart (Figure 2B) and expose the dura mater meningeal layer over the cisterna magna.
- Gently wash with sterile phosphate-buffered saline (PBS) to remove any possible blood contamination. Blot dry the dura mater with a sterile cotton swab and gently puncture the membrane covering the cisterna magna with a 30 G needle. Quickly and gently insert a small glass capillary tube to collect CSF (Figure 2C).
NOTE: Intracranial pressure allows CSF to flow spontaneously into the capillary (Figure 2C). Depending on the age and size of the mouse, approximately 5−12 µL of CSF is obtained from each mouse. - Carefully remove the capillary tube from the membrane. Connect the tube to a 3 mL syringe through a polyethylene tubing (Table of Materials) and inject the collected CSF into a labeled 0.5 mL tube (Figure 2D). Keep vials in ice.
- Close incision by using polydioxanone suture (PDS) with disposable needle and using buried sutures17. Clean off the area of any dried blood or tissue.
- Inject mice, subcutaneously or intraperitoneally16, with 0.05−0.1 mg/kg of buprenorphine hydrochloride as analgesic treatment. Also, inject subcutaneously 1 mL of sterile saline to prevent dehydration.
- Place the mouse back in a clean and warm cage for recovery. Once the mouse is mobile and able to reach food and water, place the cage back on the rack.
- Centrifuge CSF for 10 min at 1,000 x g in a 4 °C refrigerated centrifuge. Check the degree of blood contamination by visual inspection for identification of xanthochromia and presence of a red pellet in the bottom of the tube. Discard blood-contaminated samples.
NOTE: The formula utilized for the correction of CSF protein amounts in blood-contaminated specimens is based on equation parameters that include protein content in CSF and serum, hematocrit (HCT), and red blood cells (RBC) count in CSF and blood18. However, such a correction strategy cannot be easily applied to mouse CSF specimens due to the small volume, therefore limiting the correction strategy to a visual inspection. - Using a clean pipette technique, collect CSF into a new 0.2 mL tube, leaving behind the pellet with cells. Dilute CSF 1:3 with PBS to reduce volume loss due to aerosol. Immediately freeze the vial of CSF at -80 °C.
- Retro-orbital bleeding procedure for serum collection.
- Serum and CSF collection using non-survival procedures
NOTE: For non-survival fluid collection, CSF collection precedes serum collection as the mouse needs to have a pulse.- CSF collection at necropsy
NOTE: This procedure is for non-survival surgery, and approximately 10−20 µL of CSF is obtained from each mouse. A sterile surgical field is recommended, but not required for non-survival surgery.- Move the cages containing mice from the rack to a comfortable working space. Follow steps 1.1.2.2−1.1.2.7 and 1.1.2.11−1.1.2.12 for CSF collection. Proceed to section 1.2.2 for serum collection.
- Blood collection via intracardiac puncture (open approach)
NOTE: Blood volumes expected is approximately 3% of body weight, e.g., 0.6 mL from a 20 g mouse.- Following CSF collection ensure the mouse is still sufficiently anesthetized by pinching the footpad. If any reaction is observed, administer a second dose of anesthetic. If no reaction is observed, proceed.
- Place the animal on the back and swab skin on the abdomen with 70% alcohol. With surgical scissors, open the thoracic cavity and expose the heart. Insert a 25 G needle (attached to a 3 mL syringe) into the left ventricle and gently apply negative pressure on the syringe plunger. Withdraw needle after blood has been collected.
- Perform a secondary method of euthanasia such as decapitation or cervical dislocation to ensure that the animal is deceased.
- Push the plunger of the syringe down and inject the collected blood into a 1.5 mL vial. Allow blood to clot for 30-60 min at RT and then centrifuge it for 10 min at 2,000 x g in a 4 °C refrigerated centrifuge.
- Using clean pipette technique, collect serum into a new, labeled 0.5 mL vial. Immediately freeze vial of serum at a -80 °C freezer.
- CSF collection at necropsy
2. Protein analysis
- Use a preferred method, e.g., Luminex technology, for quantifying target protein(s) and albumin in matched serum and CSF specimens.
NOTE: Here, an example is given with Luminex magnetic technology, but virtually any technique that measures protein amounts, including enzyme-linked immunosorbent assays (ELISAs), can be applied to the current protocol. Ideally, CSF and serum samples are run for both albumin and target proteins on the same platform. Assay conditions must be optimized for crucial steps in the protocol such as antigen-bead coupling concentration, serum and CSF sample dilutions, best-fit standard curves for each analyte, and buffer composition to reduce non-specific reactivity. If a commercial kit is used for protein(s) measurement, e.g., the immunoglobulin isotyping kit (Table of Materials) used to obtain data presented in Figure 3, manufacturers’ instructions have to be followed.- Upon thawing and prior to analysis, centrifuge CSF and serum samples (2,000 x g for 10 min) and use the supernatant to prevent clogging of the filter plates and/or probe. Follow the assay procedure provided with the kit for appropriate sample dilutions. Otherwise, determine the appropriate dilution for each analyte and fluid. Dilute samples in PBS accordingly.
NOTE: If there are no specific guidance or instructions, dilutions for each analyte and fluid have to be established before the study test, by determining the appropriate dilution ranges necessary to obtain concentration estimates that fall within the most reliable range of a standard curve. Knowing the characteristics of the biological sample to be analyzed, e.g., physiological and pathological concentrations in the fluid, allows trying different dilutions with samples of low, medium, and high analyte content. If the expected range of concentrations in the samples is known a priori, the dilutions can be selected after calculating how many times the sample has to be diluted in order to be within the chosen standard curve range.
CAUTION: By calculating the dilution factors, remember that CSF has already been diluted 1:3. - Prepare a standard curve for each protein of interest, e.g., albumin and IgG as used to generate data in Figure 3, by serial diluting reference standard proteins. During the preparation of standard curves, thoroughly mix each higher concentration before making the next dilution.
NOTE: Regardless of the chosen method of quantification, it is essential to include a standard curve each time the assay is performed to estimate protein(s) concentration in samples. The best choice for a reference standard is a purified, known concentration of the protein of interest. Deciding on the specific dilutions, as well as the number of data points and replicates used to define the standard curve, depends upon the degree of non-linearity in the standard curve. - Select the appropriate antibody-coupled magnetic bead sets (Table of Materials). For individual vials of beads, sonicate each vial for 30 s and vortex for 1 min. Prepare a “working beads mixture” by diluting the bead stocks to a final concentration of 50 beads of each set/µL in assay/wash buffer (PBS, 1% bovine serum albumin [BSA]). Add 50 µL of the mixed beads to each well in a flat-bottom 96-well plate (Table of Materials).
CAUTION: The fluorescent beads are light-sensitive. Therefore, they should be protected from prolonged exposure to light throughout the procedure. - Diagram the placement of backgrounds, standards, and samples on a well map worksheet.
- Add 50 µL of assay/wash buffer to each background well, and 50 µL of each standard to the wells for the standard curve. Load 50 μL of each diluted sample into the appropriate wells last. Wrap the plate with foil and incubate with agitation (~800 rpm) on a plate shaker for 30 min at RT.
- Place the plate on a handheld magnet (Table of Materials) and rest the plate on the magnet for ~60 s to allow complete setting of magnetic beads. Remove well contents by gently decanting the plate and tap plate on absorbent pads to remove residual liquid.
- Wash the plate by removing it from the magnet, by adding 200 µL of assay/wash buffer, by shaking for ~30 s, and finally by reattaching it to the magnet. Repeat washing 3x.
- Dilute the biotinylated detection antibody, i.e., biotin-labeled antibody raised against the protein host species, to 4 μg/mL in assay/wash buffer. Add 50 µL of the diluted detection antibody to each well. Cover the plate and incubate for 30 min at RT on the plate shaker at ~800 rpm. Place the plate on the magnet and repeat steps 2.1.6 and 2.1.7.
- Dilute phycoerythrin (PE)-conjugated streptavidin (SAPE) to 4 μg/mL in assay/wash buffer. Add 50 µL of diluted SAPE to each well. Cover the plate and incubate for 30 min at RT on the plate shaker at ~800 rpm. Place the plate on the magnet and repeat steps 2.1.6 and 2.1.7.
- Remove the plate from the magnet and resuspend the beads in 100 μL of assay/wash buffer. Read wells with a dual laser flow-based detection instrument which allows for the detection of the magnitude of PE fluorescence intensity (FI).
NOTE: The signal, e.g., FI, generated is proportional to the amount of target antigen attached to the surface of the beads. - Export raw data and create standard curves by graphing detection signal FI versus standard protein concentrations. Use the standard curve(s) to calculate the concentration of the analyte(s) in the samples.
NOTE: Albumin is preferentially expressed in g/dL, while proteins of interest are preferentially expressed in mg/dL.
- Upon thawing and prior to analysis, centrifuge CSF and serum samples (2,000 x g for 10 min) and use the supernatant to prevent clogging of the filter plates and/or probe. Follow the assay procedure provided with the kit for appropriate sample dilutions. Otherwise, determine the appropriate dilution for each analyte and fluid. Dilute samples in PBS accordingly.
3. Intrathecal index calculations
- Organize protein concentration values into a spreadsheet and analyze the results by applying the following formulas.
- Calculate Qalbumin:
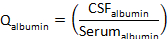
where CSFalbumin and Serumalbumin are concentrations of albumin in matched serum and CSF specimens, respectively. - Calculate Qprotein:
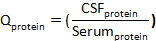
where CSFprotein and Serumprotein are concentrations of target protein(s) in matched serum and CSF specimens, respectively. - Calculate the protein index:
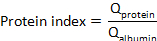
Access restricted. Please log in or start a trial to view this content.
Results
This representative experiment aimed to compare the intrathecal synthesis of IgG in two clinically relevant rodent models of multiple sclerosis (MS): the PLP139-151-induced relapsing experimental autoimmune encephalomyelitis (R-EAE) and the chronic progressive, Theiler’s murine encephalomyelitis virus-induced demyelinating disease (TMEV-IDD). R-EAE is a useful model for understanding relapsing-remitting MS, whereas the TMEV-IDD model features chronic progressive MS19.
Access restricted. Please log in or start a trial to view this content.
Discussion
Quantitative methods for the evaluation of increased CSF protein concentrations are useful tools in the characterization of the physiological and pathological state of the CNS. However, beyond reliable quantification of CSF protein levels, the detection of CSF proteins requires an expression of results that discriminates between blood- and CNS-derived fractions in the CSF. However, to date, the commonly used protein quantification assays do not allow discrimination between the two protein components, even with the aid of...
Access restricted. Please log in or start a trial to view this content.
Disclosures
The authors have nothing to disclose.
Acknowledgements
The authors thank the staff of the Center for Comparative Medicine and Research (CCMR) at Dartmouth for their expert care of the mice used for these studies. The Bornstein Research Fund funded this research.
Access restricted. Please log in or start a trial to view this content.
Materials
| Name | Company | Catalog Number | Comments |
|---|---|---|---|
| 1 mL insulin syringe | BD | 329650 | |
| 1 mL syringe | BD | 329622 | |
| 25 gauge needle | BD | 305122 | |
| 3 mL syringe | BD | 309582 | |
| 30 gauge insulin needle | BD | 305106 | |
| Absorbent pads | Any suitable brand | ||
| Acepromazine | Patterson Vet Supply Inc | ||
| BioPlex Handheld Magnetic Washer | BioRad | 171020100 | Magnet |
| BioPlex MAGPIX Multiplex Reader | BioRad | 171015001 | |
| BioPlex Pro Flat Bottom Plates | BioRad | 171025001 | |
| Biotinilated detection antibody | Any suitable source | The antibody has to be directed against the species of the protein of interest. | |
| Bovine Serum Albumin (BSA) | Sigma | A4503 | |
| Buprenorphine hydrochloride | PAR Pharmaceutical | NDC 42023-179-05 | |
| Capillary Tubes | Sutter Instrument | B100-75-10 | OD: 1.0 mm, ID: 0.75 mm Borosilicate glass 10 cm; drawn over Bunsen to make ID smaller. |
| Centrifuge tube, 0.2 mL | VWR | 20170-012 | |
| Centrifuge tube, 0.5 mL | VWR | 87003-290 | |
| Centrifuge tube, 1.5 mL | VWR | 87003-294 | |
| Chlorhexidine diacetate | Nolvasan | E004272 | |
| Disposable pipettes tips | Any suitable brand | ||
| Ear bars | KOPF Instruments | 1921 or 1922 | |
| Ethanol | Kopter | V1001 | |
| Freezer | VWR | VWR32086A | |
| Gauze | Medline | NON25212 | |
| Heating pad | Sunbeam | XL King Size SoftTouch, 4 Heat Settings with Auto-Off, Teal, 12-Inch x 24-Inch | |
| Induction Chamber | VETEQUIP | ||
| Isoflurane | Patterson Vet Supply Inc | NDC 14043-704-06 | |
| Ketamine (KetaVed) | Patterson Vet Supply Inc | ||
| MagPlex Microspheres (antibody-coupled) | BioRad | Antibody-coupled magnetic bead | |
| Microplate Shaker | Southwest Scientific | SBT1500 | |
| Microretractors | Carfill Quality | ACD-010 | Blunt - 1 mm |
| Microsoft Office (Excel) | Microsoft | ||
| MilliPlex MAP Mouse Immunoglobulin Isotyping Magnetic Bead Panel | EMD Millipore | MGAMMAG-300K | Commercial kit for the quantification through Luminex of a panel of immunoglobulin isotypes and subclasses in mouse fluids. |
| Mouse Albumin capture ELISA kit | Novus Biological | NBP2-60484 | Commercial kit for the quantification through ELISA of albumin in mouse fluids. |
| Multichannel pipette | Eppendorf | 3125000060 | |
| Non-Sterile swabs | MediChoice | WOD1002 | Need to be autoclaved for sterility |
| Oxygen | AIRGAS | OX USPEA | |
| Pasteur Pippettes | Fisher | 13-678-20A | 5 & 3/4" |
| PDS suture with disposable needle, 6-0 Prolen | Patterson Vet | 8695G | P-3 Reverse Cutting, 18" |
| PE-Streptavidin | BD Biosciences | 554061 | |
| Pipetters | Eppendorf | Research seriers | |
| Polyethylene tubing | |||
| Refrigerated Centrifuge | Beckman Coulter | ALLEGRA X-12R | |
| Scale | Uline | H2716 | |
| Scalpel | Feather | EF7281 | |
| Shaver | Harvard Apparatus | 52-5204 | |
| Standard proteins | Any suitable source | The best choice for a reference standard is a purified, known concentration of the protein of interest. | |
| Stereotaxic instrument | KOPF Instruments | Model 900LS | Standard Accessories |
| Sterile 1 x PBS | Corning Cellgro | 21-040-CV | |
| Sterile saline | Baxter | 0338-0048-02 | 0.9 % Sodium Chloride Irrigation USP |
| Surgical Forceps Curved, 7 (2) | Fine Science Tools | 11271-30 | Dumont |
| Surgical Scissors | Fine Science Tools | 14094-11 | Stainless 25x |
| Vaporizer + Flow meter | Moduflex Anhestesia Instruments | ||
| Vortex | Fisher | 02-215-414 | |
| Warming pad | Kent Scientific Corporation | RT-JR-20 | |
| Water Sonicator | Cole Parmer | EW-08895-01 | |
| Xylazine | Patterson Vet Supply Inc |
References
- Whedon, J. M., Glassey, D. Cerebrospinal fluid stasis and its clinical significance. Alternative Therapies in Health and Medicine. 15 (3), 54-60 (2009).
- Kang, J. H., Vanderstichele, H., Trojanowski, J. Q., Shaw, L. M. Simultaneous analysis of cerebrospinal fluid biomarkers using microsphere-based xMAP multiplex technology for early detection of Alzheimer's disease. Methods. 56 (4), 484-493 (2012).
- Barro, C., et al. Fluid biomarker and electrophysiological outcome measures for progressive MS trials. Multiple Sclerosis. 23 (12), 1600-1613 (2017).
- Tourtellotte, W. W., et al. Multiple sclerosis: measurement and validation of central nervous system IgG synthesis rate. Neurology. 30 (3), 240-244 (1980).
- Bonnan, M. Intrathecal IgG synthesis: a resistant and valuable target for future multiple sclerosis treatments. Multiple Sclerosis International. 2015, 296184(2015).
- Reiber, H. Cerebrospinal fluid--physiology, analysis and interpretation of protein patterns for diagnosis of neurological diseases. Multiple Sclerosis. 4 (3), 99-107 (1998).
- DiSano, K. D., Linzey, M. R., Royce, D. B., Pachner, A. R., Gilli, F. Differential neuro-immune patterns in two clinically relevant murine models of multiple sclerosis. Journal of Neuroinflammation. 16 (1), 109(2019).
- Pachner, A. R., Li, L., Lagunoff, D. Plasma cells in the central nervous system in the Theiler's virus model of multiple sclerosis. Journal of Neuroimmunology. 232 (1-2), 35-40 (2011).
- Reiber, H. Flow rate of cerebrospinal fluid (CSF)--a concept common to normal blood-CSF barrier function and to dysfunction in neurological diseases. Journal of Neurological Sciences. 122 (2), 189-203 (1994).
- Reiber, H., Zeman, D., Kusnierova, P., Mundwiler, E., Bernasconi, L. Diagnostic relevance of free light chains in cerebrospinal fluid - The hyperbolic reference range for reliable data interpretation in quotient diagrams. Clinica Chimica Acta. 497, 153-162 (2019).
- Reiber, H., Felgenhauer, K. Protein transfer at the blood cerebrospinal fluid barrier and the quantitation of the humoral immune response within the central nervous system. Clinica Chimica Acta. 163 (3), 319-328 (1987).
- Dorta-Contreras, A. J. Reibergrams: essential element in cerebrospinal fluid immunological analysis. Revista de Neurologia. 28 (10), 996-998 (1999).
- Metzger, F., Mischek, D., Stoffers, F. The Connected Steady State Model and the Interdependence of the CSF Proteome and CSF Flow Characteristics. Frontiers Neuroscience. 11, 241(2017).
- Wolforth, J. Methods of blood collection in the mouse. Laboratory Animals. 29, 47-53 (2000).
- Liu, L., Duff, K. A technique for serial collection of cerebrospinal fluid from the cisterna magna in mouse. Journal of Visualized Experiments. (21), e960(2008).
- Machholz, E., Mulder, G., Ruiz, C., Corning, B. F., Pritchett-Corning, K. R. Manual restraint and common compound administration routes in mice and rats. Journal of Visualized Experiments. (67), e2771(2012).
- Johnston, S. A., Tobias, K. M. Veterinary Surgery: Small Animal Expert Consult - E-Book. Elsevier Health Sciences. , (2017).
- Nigrovic, L. E., Shah, S. S., Neuman, M. I. Correction of cerebrospinal fluid protein for the presence of red blood cells in children with a traumatic lumbar puncture. Journal of Pediatrics. 159 (1), 158-159 (2011).
- McCarthy, D. P., Richards, M. H., Miller, S. D. Mouse models of multiple sclerosis: experimental autoimmune encephalomyelitis and Theiler's virus-induced demyelinating disease. Methods in Molecular Biology. 900, 381-401 (2012).
- Link, H., Tibbling, G. Principles of albumin and IgG analyses in neurological disorders. II. Relation of the concentration of the proteins in serum and cerebrospinal fluid. Scandinavian Journal of Clinical Laboratory Investigation. 37 (5), 391-396 (1977).
- Tibbling, G., Link, H., Ohman, S. Principles of albumin and IgG analyses in neurological disorders. I. Establishment of reference values. Scandinavian Journal of Clinical Laboratory Investigation. 37 (5), 385-390 (1977).
- Deisenhammer, F., et al. Guidelines on routine cerebrospinal fluid analysis. Report from an EFNS task force. European Journal of Neurology. 13 (9), 913-922 (2006).
- Johanson, C. E., Stopa, E. G., McMillan, P. N. The blood-cerebrospinal fluid barrier: structure and functional significance. Methods in Molecular Biology. 686, 101-131 (2011).
- Zaias, J., Mineau, M., Cray, C., Yoon, D., Altman, N. H. Reference values for serum proteins of common laboratory rodent strains. Journal of the American Association for Laboratory Animal Science. 48 (4), 387-390 (2009).
- Felgenhauer, K., Renner, E. Hydrodynamic radii versus molecular weights in clearance studies of urine and cerebrospinal fluid. Annals of Clinical Biochemistry. 14 (2), 100-104 (1977).
- Pachner, A. R., DiSano, K., Royce, D. B., Gilli, F. Clinical utility of a molecular signature in inflammatory demyelinating disease. Neurology, Neuroimmunology & Neuroinflammation. 6 (1), 520(2019).
- Pachner, A. R., Li, L., Gilli, F. Chemokine biomarkers in central nervous system tissue and cerebrospinal fluid in the Theiler's virus model mirror those in multiple sclerosis. Cytokine. 76 (2), 577-580 (2015).
- Gerbi, C. Protein concentration in the arterial and venous renal blood serum of the rabbit. Archives of Biochemistry and Biophysics. 31 (1), 49-61 (1951).
- Abbott, N. J., Patabendige, A. A., Dolman, D. E., Yusof, S. R., Begley, D. J. Structure and function of the blood-brain barrier. Neurobiology of Disease. 37 (1), 13-25 (2010).
- Reiber, H. Proteins in cerebrospinal fluid and blood: barriers, CSF flow rate and source-related dynamics. Restorative Neurology and Neuroscience. 21 (3-4), 79-96 (2003).
- Reiber, H. Knowledge-base for interpretation of cerebrospinal fluid data patterns. Essentials in neurology and psychiatry. Arquivos de Neuropsiquiatria. 74 (6), 501-512 (2016).
- Kuehne, L. K., Reiber, H., Bechter, K., Hagberg, L., Fuchs, D. Cerebrospinal fluid neopterin is brain-derived and not associated with blood-CSF barrier dysfunction in non-inflammatory affective and schizophrenic spectrum disorders. Journal of Psychiatric Research. 47 (10), 1417-1422 (2013).
- Bromader, S., et al. Changes in serum and cerebrospinal fluif cytokines in response to non-neurological surgery: an observational study. Journal of Neuroinflammation. 9, 242(2012).
- Starhof, C., et al. Cerebrospinal fluid pro-inflammatory cytokines differentiate parkinsonian syndromes. Journal of Neuroinflammation. 15 (1), 305(2018).
Access restricted. Please log in or start a trial to view this content.
Reprints and Permissions
