This paper presents two optimized protocols for examining resident and peripherally derived immune cells within the central nervous system, including the brain, spinal cord, and meninges. Each of these protocols helps to ascertain the function and composition of the cells occupying these compartments under steady state and inflammatory conditions.
Method Article
Isolating Central Nervous System Tissues and Associated Meninges for the Downstream Analysis of Immune cells
In This Article
Summary
Abstract
The central nervous system (CNS) is comprised of the brain and spinal cord and is enveloped by the meninges, membranous layers serving as a barrier between the periphery and the CNS. The CNS is an immunologically specialized site, and in steady state conditions, immune privilege is most evident in the CNS parenchyma. In contrast, the meninges harbor a diverse array of resident cells, including innate and adaptive immune cells. During inflammatory conditions triggered by CNS injury, autoimmunity, infection, or even neurodegeneration, peripherally derived immune cells may enter the parenchyma and take up residence within the meninges. These cells are thought to perform both beneficial and detrimental actions during CNS disease pathogenesis. Despite this knowledge, the meninges are often overlooked when analyzing the CNS compartment, because conventional CNS tissue extraction methods omit the meningeal layers. This protocol presents two distinct methods for the rapid isolation of murine CNS tissues (i.e., brain, spinal cord, and meninges) that are suitable for downstream analysis via single-cell techniques, immunohistochemistry, and in situ hybridization methods. The described methods provide a comprehensive analysis of CNS tissues, ideal for assessing the phenotype, function, and localization of cells occupying the CNS compartment under homeostatic conditions and during disease pathogenesis.
Introduction
The central nervous system (CNS) is an immunologically specialized site. The CNS parenchyma, excluding the CSF space, the meninges, and the vasculature, is classically viewed as an immune-privileged site1,2,3,4,5 and is relatively devoid of immune cells during homeostatic conditions2,6,7. In contrast, the meninges, comprised of the dura, arachnoid, and pia layers, are crucial components of the CNS compartment, actively participating in homeostatic immune surveillance and inflammatory processes during disease pathogenesis3,6,7,8. During steady state conditions, the meninges support numerous immune sentinel cells, including innate lymphoid cells (ILC), macrophages, dendritic cells (DC), mast cells, T cells, and to a lesser extent, B cells9,10,11.
The meninges are highly vascularized structures and contain lymphatic vessels that provide a lymphatic connection between the CNS and its periphery8,12,13,14. In inflammatory conditions induced by CNS injury, infections, autoimmunity, or even neurodegeneration, peripherally derived immune cells infiltrate the parenchyma and alter the immune landscape within the meninges. Following cell infiltration, the meninges may represent a functional niche for peripherally derived immune cells, promoting immune cell aggregation, local immune cell activation, and long-term survival in the CNS compartment. Prominent meningeal inflammation is observed in multiple diseases affecting the CNS, including multiple sclerosis (MS)15,16,17,18,19, stroke20,21, sterile injury22,23 (i.e., spinal cord injury and traumatic brain injury), migraines24, and microbial infection25,26,27,28,29. Thus, the characterization of resident cells and peripherally derived immune cells in the meningeal compartment is essential for understanding the role of these cells during steady state conditions and disease pathogenesis.
The extraction of the brain, spinal cord, and meninges from the cranium and vertebral bodies is technically challenging and time-consuming. There are currently no techniques available for the rapid extraction of the brain with all three meningeal layers intact. While laminectomy yields excellent spinal cord tissue morphology and preserves the meningeal layers, it is both extremely time-consuming and complicated30,31. Conversely, more conventional extraction methods such as the removal of the brain from the cranium and the hydraulic extrusion of the spinal cord facilitate the quick extraction of the CNS tissue, but both the arachnoid and dural meninges are lost with these techniques30,31. The omission of dura and arachnoid layers during conventional isolation of brain and spinal cord tissues results in an incomplete analysis of the cells within the CNS compartment. Thus, the identification of new techniques focused on the quick extraction of CNS tissues with intact meninges is crucial for the optimal analysis of the CNS compartment.
This manuscript presents two methods for the rapid extraction of the brain, spinal cord, and meninges from mice, facilitating the downstream analysis of resident cells and peripherally derived immune cells in the CNS parenchyma and meninges. These optimized protocols focus on 1) isolating single-cell suspensions for downstream analysis and 2) preparing tissue for histological processing. Obtaining single-cell suspensions from the brain, spinal cord tissue, and dural and arachnoid meninges32 allows for the simultaneous analysis of cells residing in both the parenchymal and meningeal compartments. Single-cell suspensions can be used in different applications, including cell culture assays to perform in vitro stimulation33, enzyme-linked immunospot (ELISpot)28,34,35, flow cytometry36,33, and single-cell37 or bulk transcriptomics. Additionally, the optimized protocol for decalcification of whole brains and spinal cords with intact skulls or vertebral columns, respectively, allows for the gentle decalcification of the surrounding bone, leaving the meninges intact and preserving the tissue morphology. This method allows for the selective identification of proteins or RNA using immunohistochemistry (IHC) or in situ hybridization (ISH) techniques within both the parenchymal and meningeal spaces. The characterization of the phenotype, activation state, and localization of resident cells and peripherally derived immune cells within the CNS may provide information essential to understanding how individual cell types in the CNS compartment contribute to homeostasis and disease pathogenesis.
Protocol
All animal work utilizes protocols reviewed and approved by the Institutional Animal Care and Use Committee (IACUC) at Geisel School of Medicine at Dartmouth.
1. Processing brain and spinal cord samples for decalcification
- Isolating brain and spinal cord samples
- Euthanize the mouse via CO2 inhalation. Ensure that the CO2 flow rate displaces 10%–30% of the cage volume per minute.
- Using forceps, lift the xiphoid process, and cut the abdominal wall laterally just below the rib cage with scissors, pulling up to avoid cutting underlying blood vessels or organs. Cut through the diaphragm laterally.
- Cut the rib cage along the lateral edges parallel to the lungs up to the collarbone. Using forceps, lift the sternum and clamp the sternum with a hemostat. Place the hemostat over the head to lift the rib cage away and expose the heart.
- Using forceps, grasp the heart near its apex and make an incision in the right atrium of the heart to provide an outlet. Insert a 25 G needle with a 10 mL syringe attached to slowly administer 10 mL of ice-cold 1x phosphate buffered saline (PBS) into the left ventricle to transcardially perfuse the mouse.
NOTE: Perfusion should occur over 4–5 min until the liver is cleared of blood. A total of 10 mL of 1x PBS is usually enough for perfusion, but more may be utilized if necessary. A clear liver usually indicates adequate perfusion. - Using sharp scissors, remove the head by decapitation (Figure 1; 1). Make a midline incision in the skin (Figure 1; 2) and flip the skin over the eyes to free the skull.
- Cut at the nasal bone to release the mandible from the skull (Figure 1; 3). Remove the mandible, tongue, and eyes. Cut along the lateral aspects of the skull to release the tissue along the external auditory meatus (Figure 1; 4). Trim to remove all excess skin, muscle, and tissue overlaying the skull.
- Separate the rib cage from the spinal column by cutting parallel to the spine with sharp scissors (Figure 1; 5 and 6). Make a small cut at the lower lumbar region to isolate the spinal column (Figure 1; 7). Trim and remove any remaining muscle along the spine to expose the vertebrae (Figure 1; 8).
NOTE: Removing excess tissue from the spinal column and skull is necessary to obtain adequate penetration of fixative paraformaldehyde (PFA) and ethylenediaminetetraacetic acid (EDTA) decalcification buffer.
- Post-fixation, decalcification, and cryopreservation
- Using forceps, place the brain with the intact skull or spinal column in a 15 mL conical tube containing 10 mL of 4% PFA. Place the tubes at 4 ˚C for at least 48 h for adequate fixation.
NOTE: To avoid overfixation of the tissue, do not exceed 72 h of fixation. Fixation times are extended for bone specimens before decalcification. Adequate fixation will protect tissue from the effects of the decalcification and ensure better tissue morphology. - Rinse the brain or spinal cord by removing the tissue from the 4% PFA with forceps and placing the tissue in a disposable 14 mL tube with 10 mL of 1x PBS for 5 min. Transfer the brain or spinal cord into a 50 mL conical tube with 10 mL of 10% EDTA (pH = 7.2–7.4).
NOTE: Using a larger tube with 10 mL of EDTA gives the EDTA a greater contact area with the tissue and accelerates the decalcification process. - Check daily if the bone is soft and pliable: remove the tissue from the EDTA solution with forceps, place it on a Petri dish, and gently test the bone softness with a 25 G needle. If the needle easily penetrates the bone, the decalcification process is complete.
- Remove the tissue from the EDTA solution and transfer the brain or spinal cord to a 14 mL disposable tube containing 10 mL of 1x PBS and wash for 10 min. Repeat the wash.
NOTE: Decalcification usually takes 2–3 days. The solution should be changed every 2–3 days if the bone is not yet adequately decalcified. However, prolonged incubation in EDTA after the bone has been decalcified can damage the tissue morphology. - Prepare 10%, 20%, and 30% sucrose solutions by adding sucrose to 1x PBS. For example, for 10% sucrose, add 10 g of sucrose and bring the volume to 100 mL using sterile 1x PBS. Store the solution at 4 ˚C for up to 1 month.
NOTE: Sucrose solutions are prone to microorganism growth, so samples should not be stored for prolonged periods of time in these solutions. - Remove the tissue from the 1x PBS, place it in 10 mL of 10% sucrose solution and store it at 4 ˚C. Let the tissue sit for 24 h or until it sinks to the bottom of the tube.
- Repeat this process, moving the tissue to a 20% sucrose solution first and finally to a 30% sucrose solution. Allow the tissue to sink in 30% sucrose (at least 24 h) and proceed to tissue embedding.
- Using forceps, place the brain with the intact skull or spinal column in a 15 mL conical tube containing 10 mL of 4% PFA. Place the tubes at 4 ˚C for at least 48 h for adequate fixation.
- Tissue embedding and freezing
- Using forceps, remove the tissue from the 30% sucrose, place it on a Petri dish, and tilt the dish to get rid of any excess sucrose solution on the tissue. Using a scalpel, cut the tissue into desired segments.
- Create a thin layer of optimal cutting temperature (OCT) compound at the bottom of the cryomold and place the tissue piece(s) in the mold. Cover the tissue completely with the OCT compound, ensuring no bubbles are present.
- Flash freeze the blocks by hovering over liquid nitrogen38 or setting the blocks on a 100% isopropanol/dry ice slurry39 until the block is opaque. Wrap the cryomolds in aluminum foil and store the blocks at -80 ˚C for long-term storage. Move blocks to -20 ˚C before sectioning.
NOTE: Care must be taken when sectioning and performing histology protocols on decalcified brains as the skull and meningeal layers may be lost if the sections are handled roughly.
2. Preparation of the meninges and CNS tissues for flow cytometry staining
- Extracting the skull cap and brain
- Using sharp scissors, remove the head by decapitation (Figure 2A; 1). Using scissors, make a midline incision in the skin (Figure 2A; 2) and flip the skin over the eyes to free the skull.
- Place the scissors within the foramen magna and begin cutting the skull laterally along the cortices towards the olfactory bulb, keeping the incisions above the external auditory meatus and mandible (Figure 2A; 3). Perform the same cuts on the opposite side, with cuts meeting at the olfactory bulb to free the skull cap from the brain (Figure 2A; 3).
- Using forceps, peel back the skull cap and place the skull cap into a 15 mL conical tube containing 5 mL of cold RPMI medium supplemented with 25 mM HEPES. Keep the tube on ice.
- Using curved forceps, place the forceps below the base of the brain, and lift to free the brain from the skull cap. Place the brain into a 15 mL conical tube containing 5 mL of cold RPMI supplemented with 25 mM HEPES. Keep the tube on ice until processing.
- Extracting the vertebral column and spinal cord tissue
- Using forceps and sharp scissors, separate the rib cage from the spinal column by cutting parallel to the spine (Figure 2A; 4 and 5). Make a small cut at the lower lumbar region to isolate the vertebral column (Figure 2A; 6). Trim and remove any remaining muscle along the spine to expose the vertebrae (Figure 2A; 7).
- Place the extra fine surgical scissors within the vertebral column and cut along the lateral edge of the column (Figure 2C). Cut the opposite lateral edge completely to divide the vertebral column into an anterior and posterior portion.
NOTE: The spinal cord will remain attached to the vertebral column. - Using forceps, slowly and carefully peel away the spinal cord from the vertebral column and place the tissue in a 15 mL conical tube containing 5 mL of cold RPMI with 25 mM HEPES. Transfer the anterior and posterior portions of the spinal column to a 15 mL conical tube containing 5 mL of cold RPMI with 25 mM HEPES.
- Removing the meninges to prepare single-cell suspensions
- Using forceps, remove the skull cap from the RPMI media. Using sharp forceps (#7 forceps; Table of Materials), score around the outer edge of the skull cap (Figure 2B) and peel the meninges away from the edge of the skull cap, scraping to remove the dural and arachnoid meninges. Place the meninges on a Petri dish.
NOTE: Removal of the meninges from both the brain and spinal cord requires practice. If the user experiences difficulty extracting the meninges, use a dissecting microscope to aid in the removal. - Remove the vertebral column from the tube. Using sharp forceps, score around the edges of the vertebral column to free the meninges and peel away the meninges from the edge of the vertebra using curved forceps. Place the meninges on a Petri dish.
- Place a nylon mesh strainer in a 50 mL conical tube. Move the meninges into the strainer and add 3 mL of RPMI supplemented with 25 mM HEPES. Using the plunger from a 5 mL syringe, grind the tissue and media through the strainer.
- Using a 5 mL serological pipette, wash the strainer with an additional 2 to 3 mL of RPMI/HEPES media until all visible tissue has passed through the strainer.
NOTE: To obtain adequate cell numbers for flow cytometric analysis, meninges from multiple animals may need to be pooled together. In this experiment (Figure 3 and Figure 4), the brain and spinal cord meninges from 4–5 mice were pooled together. If the samples are pooled, additional media will be required to grind the tissue through the nylon mesh strainer to prevent overheating of the tissue. - Using a 10 mL serological pipette, transfer the cells and media to a fresh 15 mL conical tube. Using a 10 mL serological pipette, wash the 50 mL conical tube with 5 mL of media to collect any remaining cells. Centrifuge at 450 x g for 5 min at 4 °C to pellet the cells.
- Using a Pasteur pipette with vacuum, aspirate the supernatant being careful to avoid the cell pellet and resuspend the cells in an appropriate volume and buffer.
- To count the single-cell suspension, dilute a small volume of the cells (i.e., 5–10 µL) using trypan blue exclusion dye (1:10 dilution) and RPMI. Add 10 µL of the dilution to the hemocytometer.
- Count the cells as previously described40,41, averaging at least two 16 square grids for accuracy.
NOTE: In Figure 3, for example, pooled, pelleted cells from the meninges were resuspended in 250 µL of fluorescence-activated cell sorting (FACS) buffer (1x PBS with 1% FBS) for downstream surface staining. The cells were diluted 1:10 for counting (5 µL cells, 5 µL trypan blue, 40 µL RPMI). This dilution yielded between 50–100 cells per 16 square grids, ensuring more accurate cell counting because the cells are neither too dense and overlapping nor too sparse. Nucleated cell counts from pooled brain and spinal cord meninges per mouse were as follows: For meninges from sham-treatment mice = 100,000–150,000 cells and for meninges from Theiler’s murine encephalomyelitis virus-induced demyelinating disease (TMEV-IDD) mice = 300,000–350,000 cells. Cell counts will vary depending on the precision of collection, processing, and if meningeal inflammation is present. - Proceed to the desired single-cell technique such as a FACS surface (Figure 3)14,36,42,43,44, intracellular staining protocols33,45, in vitro stimulation, cell culture assays33,46,47, ELISPOT assay28,34,35, and bulk or single-cell transcriptomics37,48.
NOTE: Keep all tubes on ice in between processing steps.
- Using forceps, remove the skull cap from the RPMI media. Using sharp forceps (#7 forceps; Table of Materials), score around the outer edge of the skull cap (Figure 2B) and peel the meninges away from the edge of the skull cap, scraping to remove the dural and arachnoid meninges. Place the meninges on a Petri dish.
- Preparing single-cell suspensions of brain and spinal cord tissue
- Transfer the brain or spinal cord tissue with media to the top of the 100 mm Petri dish by pouring the tissue and media from the tube. Using forceps, move the tissue to the bottom of the Petri dish. Finely mince the brain or spinal cord with a sterile razor blade. Using the razor blade, move the minced tissue to the bottom of the plate by scraping to gather the tissue.
NOTE: For the enzymatic digestion protocol below, up to two spinal cords may be pooled together for processing. Brains should be processed individually. - Using a 5 mL serological pipette, add 3 mL of RPMI supplemented with 10% fetal calf serum (FCS) to the Petri dish. Using a 10 mL serological pipette, pipette up and down to resuspend the tissue in the media and transfer to a 15 mL conical tube.
NOTE: If the downstream application is single-cell or bulk RNA sequencing analysis or cell culture, FCS lots should be tested to ensure cells are not activated prior to analysis. Alternatively, cells can be processed using 1x PBS with 0.04% BSA instead of RPMI with 10% FCS. - Using a 10 mL serological pipette, wash the Petri dish with an additional 2 mL of media to collect any residual tissue and transfer to a conical tube for a 5 mL total volume. Keep the tubes on ice between processing steps.
- Using a pipette, resuspend the collagenase I powder in Hank’s Balanced Salt Solution (HBSS) media to obtain the desired concentration (i.e., 100 mg/mL). Add collagenase type I to the conical tube containing the minced tissue sample to obtain the desired final concentration (i.e., 50 µL for 1 mg/mL).
NOTE: Higher concentrations of collagenase will increase cell yields but can cleave cell surface markers. Therefore, collagenase I lots should be titrated to determine the optimal concentration needed to obtain the highest number of viable cells with all required cell surface markers intact. For example, collagenase I was tested at final concentrations of 0.5 mg/mL, 1 mg/mL, and 2 mg/mL on single brain or spinal cord samples. Cell viability was determined using the trypan blue exclusion method and cell surface markers CD45, CD19, and CD4 were assessed by flow cytometry. A 1 mg/mL concentration of collagenase I yielded the highest live cell count while retaining all cell surface markers of interest. Thus, this concentration was used for further experiments examining these cell types. - Gently resuspend DNase I powder using 0.15 M sodium chloride to the desired stock concentration. Add the resuspended DNase I to the conical tube containing the minced tissue sample to obtain a final concentration of 20 U/mL.
NOTE: DNase I lots vary by units of activity per mL. The concentration to be added to the tissue sample will change based on the stock vial’s units of activity per milliliter. The final desired concentration per sample is 20 U/mL. - Place the tubes in a tube rack in a 37 °C water bath and incubate for 40 min. Invert the tubes every 15 min to thoroughly mix the tissue with the enzymes. After incubation, add 500 µL of 0.1 M EDTA (pH = 7.2) to each tube for a final concentration of 0.01 M EDTA and incubate for an additional 5 min to inactivate the collagenase.
- Using a 10 mL serological pipette, add 9 mL of RPMI supplemented with 10% FCS to each tube to bring the volume of each tube to ~14.5 mL. Centrifuge at 450 x g for 5 min at 4 ˚C. Using a Pasteur pipette with vacuum, aspirate the supernatant being careful not to touch the cell pellet.
- Using a 5 mL serological pipette, add 3 mL of 100% stock isotonic density gradient solution to the tube containing the cell pellet. Using a 10 mL serological pipette, add additional RPMI 10% FCS media to bring the final volume to 10 mL and resuspend the cell pellet to create a 30% stock isotonic density gradient solution layer.
NOTE: Prepare the 100% stock isotonic density gradient medium in advance, aliquot, and store at 4 °C for up to 3 months. To prepare the 100% stock isotonic density gradient solution, dilute the density gradient media (Table of Materials) with density gradient media dilution buffer. Prepare the density gradient media dilution buffer (80.0 g/L NaCl, 3.0 g/L KCl; 0.73 g/L Na2HP04, 0.20 g/L KH2HP04; 20.0 g/L glucose) and filter sterilize using a vacuum filter system. Make the 100% stock isotonic density gradient solution by mixing 1 part of density gradient dilution buffer and 9 parts density gradient media. Mix well. - Invert and mix each tube well prior to adding the 70% stock isotonic density gradient solution underlay. Insert a 1 mL serological pipette containing 1 mL of 70% stock isotonic density gradient solution into the bottom of the tube. Slowly underlay 1 mL of the solution, being careful not to make bubbles. Slowly remove the serological pipet from the tube, being careful not to disturb the gradient.
NOTE: For the 70% underlay, the 100% stock isotonic density gradient solution should be diluted to 70% using RPMI media (i.e., 7 mL of 100% stock isotonic density gradient solution and 3 mL of RPMI media mixed well). Additionally, creating a clean, undisturbed 70% underlay is essential for the removal of myelin debris and for obtaining pure single-cell suspensions at the gradient interface following centrifugation. - Centrifuge at 800 x g for 30 min at 4 °C with no brake. Aspirate the supernatant, including the myelin debris layer until 2–3 mL remains in the tube, being careful not to disturb the cell layer. Harvest the cell layer between the 30/70% density gradient using a 1 mL pipette and transfer to a new 15 mL conical tube.
- Using a 10 mL serological pipette, add RPMI 10% FCS media to bring the final volume to 15 mL. Centrifuge 450 x g for 5 min at 4 °C.
NOTE: During this step, cell layers from two tubes can be pooled if needed. Do not pool more than two tubes or the cells will not pellet due to a high-density gradient media concentration. - Aspirate the supernatant carefully to not disturb the cell pellet. Resuspend the cells in an appropriate volume/buffer to count the cells using a hemocytometer (e.g., resuspend a single spinal cord in 250 µL of FACS buffer for downstream surface staining) (Figure 3).
- Using a 1 mL pipette, transfer the cell suspensions to the top of a filter top tube (Table of Materials) and allow the cells to filter to the bottom of the tube to remove any remaining myelin debris.
- Using trypan blue exclusion dye, dilute, and count the cells on a hemocytometer by averaging at least two 16 square grids for accuracy40,41.
- Proceed with the desired single-cell analysis technique.
NOTE: Using various forms of collagenase (i.e., D, type I, type II, type IV), immune cells, microglia (Figure 3), astrocytes, pericytes, endothelial cells49, and neurons50 can all be efficiently isolated. Nucleated cell counts obtained for the results were as follows using the titrated collagenase I enzyme: Whole sham-treated brain = 500,000–600,000 cells; Whole TMEV-IDD brain = 800,000–1,000,000 cells; Whole sham-treated spinal cord = 150,000–200,000 cells; Whole TMEV-IDD spinal cord = 300,000–400,000. Cell counts will vary depending on the precision of collection, processing, and whether CNS inflammation is present.
- Transfer the brain or spinal cord tissue with media to the top of the 100 mm Petri dish by pouring the tissue and media from the tube. Using forceps, move the tissue to the bottom of the Petri dish. Finely mince the brain or spinal cord with a sterile razor blade. Using the razor blade, move the minced tissue to the bottom of the plate by scraping to gather the tissue.
Results
This representative experiment was aimed at quantifying B and T cells and describing B and T cell localization in the meningeal and parenchymal CNS compartments in homeostatic conditions as well as in a murine progressive MS model (i.e., TMEV-IDD). TMEV-IDD was induced in 5-week-old female SJL mice by intracranial infection with 5 x 10⁶ plaque forming units (PFU) of TMEV BeAn as previously described29.
The present study assessed B and T cells in the meninges, brain, and spinal cord during chronic TMEV-IDD at day 120 postinfection. Age-matched sham-treated mice were used as controls. The study was comprised of two experiments. The first focused on obtaining single-cell suspensions for flow cytometric assessment, a well-established technique to analyze and quantify cell composition by evaluating cell surface and/or intracellular antigens (n = 4 sham-treated; n = 5 TMEV-IDD). The second experiment focused on describing B and T cell localization in the CNS compartment by utilizing immunohistochemistry on decalcified brain and spinal cord tissues (n = 3 sham-treated; n = 8 TMEV-IDD).
Following the isolation of single-cell suspensions from the brain, spinal cord, and pooled meninges (brain and spinal cord) from TMEV-IDD and sham-treated mice, a surface staining protocol was applied to all samples. Briefly, single-cell suspensions were incubated with a fixable viability exclusion stain (780) for 15 min, washed, blocked with Fc block in the presence of mouse serum for 15 min, and stained with conjugated antibodies for cell surface markers, including CD45 (30-F11; PerCP-Cy5.5), CD19 (1D3; PE-CF594), and CD4 (GK1.5; PE) for 30 min as previously described28,29. Cells were then washed and analyzed using a flow cytometer28,29. Viability gating was conducted as previously described28. CD45 expression was assessed to distinguish CD45hi peripherally derived infiltrating immune cells (P1) from CD45lo microglia (P2) and CD45- neurons, astrocytes, and oligodendrocytes in the brain and spinal cord (P3; Figure 3A). In sham-treated mice, few CD45hi cells were present in the spinal cord and brain tissue. In the meninges, the same gating cut-off for CD45hi expression used for the brain and spinal cord data was applied to identify CD45hi immune cells (P1; Figure 3C) and exclude nonimmune cells present in the meninges (i.e., fibroblasts, endothelial cells). In sham-treated mice, few CD45hi cells (<0.1%) were present in the meninges. Among CD45hi immune cells in TMEV-IDD CNS tissues, B cells and CD4 T cells were identified by surface expression of CD19 and CD4, respectively (Figure 3B–D). In all TMEV-IDD CNS tissues, increased percentages of CD45hi immune cells were observed compared to sham-treated mice (Figure 4A). During chronic TMEV-IDD, the percentage of B cells among CD45hi immune cells in the brain and spinal cord was higher compared to the meningeal compartment (Figure 4B).
To identify the localization of B cells and T cells within the CNS compartment during chronic TMEV-IDD, decalcified brains and spinal cords were evaluated using immunohistochemistry using the staining protocol previously described29. The meninges and vasculature were demarcated using laminin, a basement membrane component29,51 and ER-TR7, a fibroblast reticular cell marker52,53. During conventional extraction of brain from the skull cap, the pia layer was intact, but the remaining meningeal layers were excluded (Figure 5A). In the spinal cord, hydraulic extrusion resulted in the absence of all meningeal layers (data not shown). In both decalcified brains and spinal cords, all meningeal layers were intact (Figure 5B). To examine B and T cell localization in chronic TMEV-IDD, IgG expression was used to determine the localization of isotype-switched B cells29, and CD3 was used to visualize all T cells29. Costaining IgG with ER-TR7 revealed that isotype-switched IgG+ B cells were present in the CNS parenchyma and the meninges (Figure 6A). Cellular aggregates within ER-TR7+ meninges contained multiple IgG+ B cells and CD3+ T cells (Figure 6B).
The representative results show high percentages of both B cells and T cells in the parenchymal and meningeal compartments in chronic TMEV-IDD mice in contrast to age-matched sham-treated mice. IHC analysis further demonstrated that in TMEV-IDD tissue, B cells and T cells were dispersed in the parenchyma, but were closely associated in the meninges, forming inflammatory aggregates. In progressive MS patients, meningeal inflammatory aggregates are associated with adjacent tissue injury and worse disease outcomes. In chronic TMEV-IDD, persistent B cell and T cell presence in the CNS compartment and aggregation in the meninges may be associated with tissue injury and disease progression. Further studies are needed to understand how meningeal versus parenchymal inflammation affect demyelination, neurodegeneration, and clinical disability.
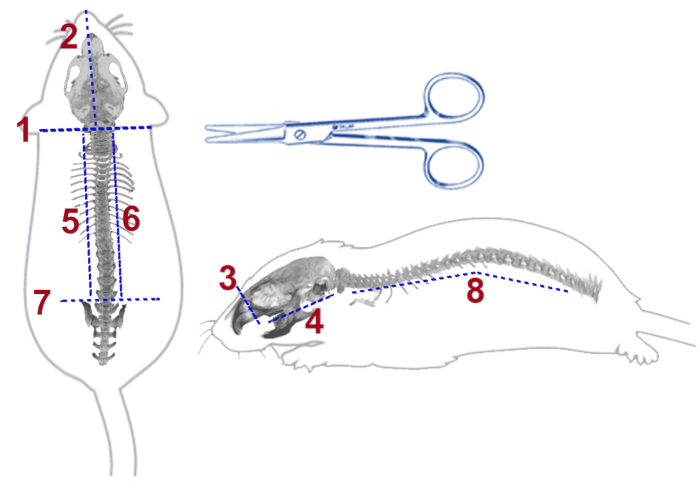
Figure 1: Isolating brains and spinal cords for decalcification. Blue dotted lines indicate cuts made to isolate the brain with intact skull (cuts 1-4) and vertebral column (cuts 5-8). Please click here to view a larger version of this figure.
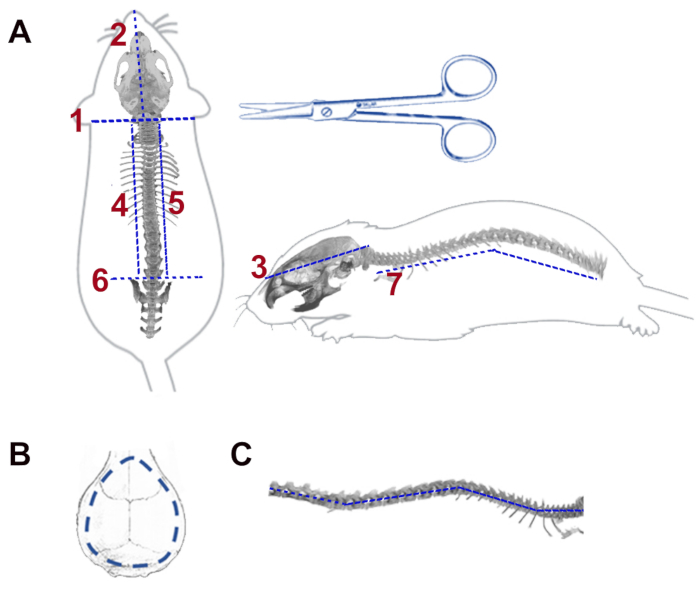
Figure 2: Isolating brains, spinal cords, and meninges for single-cell techniques. (A) Blue dotted lines indicate cuts made to isolate the skull cap with intact meninges and brain (cuts 1-3) and vertebral column (cuts 5-7). Lateral cut 3 is made on both sides of the skull. (B) Blue line indicates incision made to score and remove the meninges in the skull cap and the cuts made to the vertebral column (both lateral sides) to isolate the spinal cord and meninges. Please click here to view a larger version of this figure.
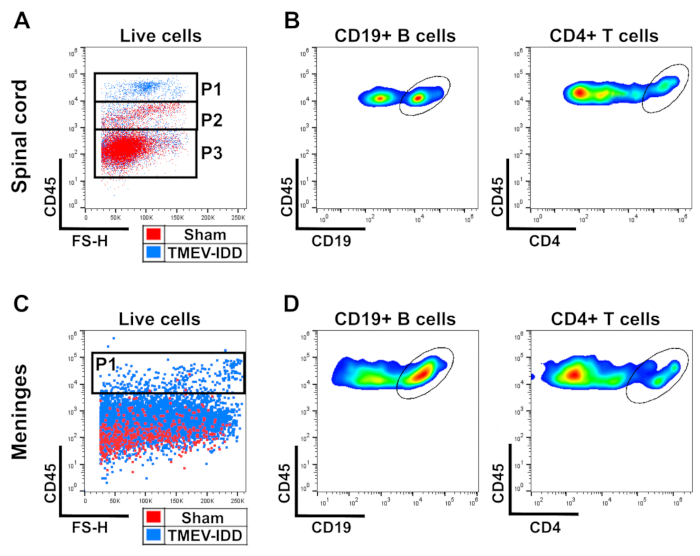
Figure 3: Identification of CD45hi infiltrating immune cells in CNS tissues. (A) Gating strategy for the identification of CD45hi infiltrating immune cells (P1), CD45lo microglia (P2), and CD45- oligodendrocytes, astrocytes, and neurons among total live cells in spinal cords from sham-treated (red) or TMEV-IDD (blue) mice. Minimal CD45hi cells were detected in sham-treated brains and spinal cords. (B) Gating strategy for identifying CD19+ B cells and CD4+ T cells among CD45hi infiltrating immune cells (P1) in TMEV-IDD mice. Gating strategies were similar for brain and spinal cord tissue. (C) Gating strategy for identifying CD45hi cells (P1) in the meninges of sham-treated (red) and chronic TMEV-IDD mice (blue). (D) Gating strategy for identifying CD19+ B cells and CD4+ T cells among CD45hi infiltrating immune cells (P1) in the meninges of chronic TMEV-IDD mice. Please click here to view a larger version of this figure.
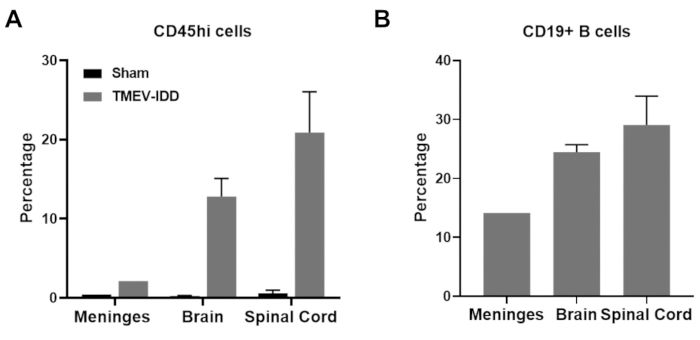
Figure 4: CD45hi immune cells and CD19+ B cells increased in CNS tissues in chronic TMEV-IDD. Bar graphs summaries of flow cytometry data obtained from sham-treated or TMEV-IDD meninges, brain, and spinal cords show percentages of CD45hi infiltrating immune cells (A) or percentages of CD19+ B cells (B). For TMEV-IDD tissues, flow cytometry data were obtained from five mice, with spinal cords and brains processed individually, while meninges were pooled for analysis. For sham-treated mice, flow cytometry data were obtained from four mice, with spinal cords and brains processed individually, while meninges were pooled for analysis. Data for spinal cords and brains are shown as mean ± SEM. Please click here to view a larger version of this figure.
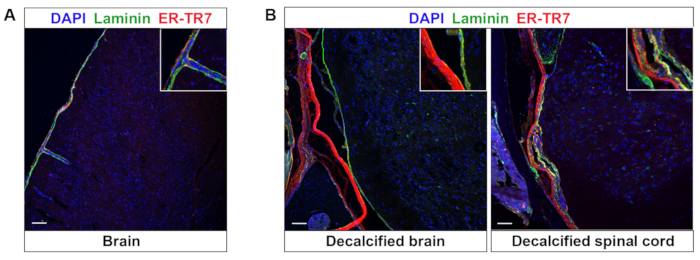
Figure 5: Intact meningeal layers in decalcified brains and spinal cords. (A) Brains extracted from the skull cap or (B) decalcified brains with intact skulls and vertebral columns from chronic-TMEV-IDD mice were assessed for DAPI (blue), meningeal markers laminin (green), and ER-TR7 (red). Scale bar = 50 µm. Please click here to view a larger version of this figure.
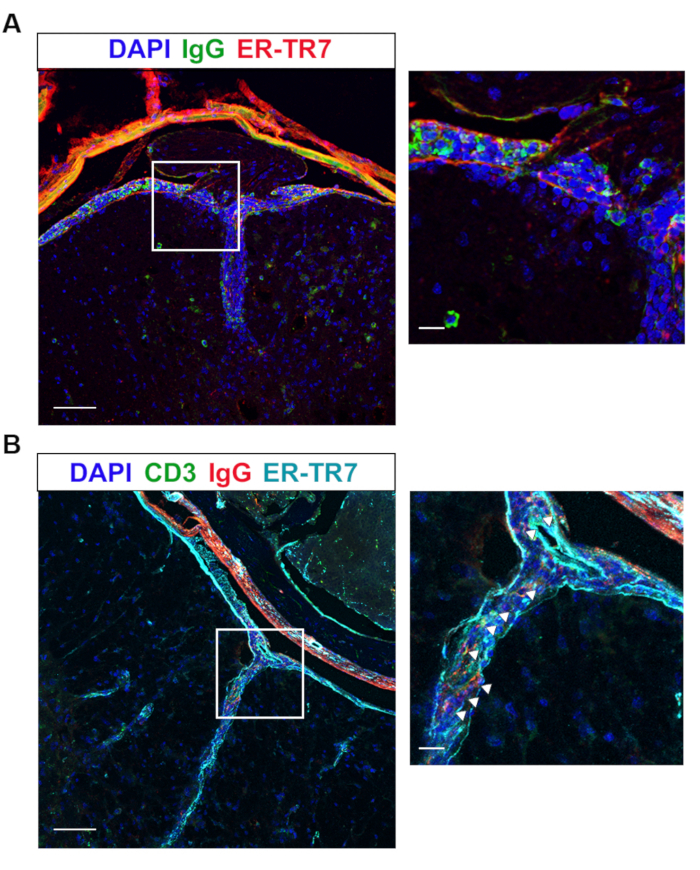
Figure 6: Immune cell aggregation was evident in the meninges during chronic TMEV-IDD. (A) Decalcified vertebral columns from chronic-TMEV-IDD mice were examined for the presence of IgG (green) to identify isotype-switched immune cells in the parenchyma and in the ER-TR7+ meninges (red). (B) CD3+ T cells (green) and IgG+ isotype-switched B cells (red) were costained with ER-TR7+ meninges to assess localization within the spinal cord tissue. White arrows highlight B and T cells within the meninges. Scale bar = 50 µm. White boxes delineate areas selected for cropped images (right; scale bar= 10 µm). Please click here to view a larger version of this figure.
Discussion
Methods for evaluating the cellular composition in the CNS compartment during homeostasis and disease are essential for understanding the physiological and pathological states of the CNS. However, despite serving as an important barrier in the CNS and housing a diverse array of immune cells, the meninges are often omitted from analysis because many conventional tissue extraction methods for the brain and spinal cord do not allow for the collection of these membranes. This omission is a critical limitation in the advancement of our understanding of the cellular composition and function of the meninges and its role in steady state and inflammatory conditions. Recent studies revealed that both resident and peripherally derived immune cells residing in the meningeal compartment play an essential role in maintaining homeostasis in the CNS, as well as in driving CNS disease pathogenesis. These studies emphasize the need to analyze not only the parenchymal compartment but also the surrounding meningeal layers. The protocols described here allow for the rapid isolation of brain and spinal cords while preserving the meninges, ultimately enabling a comprehensive downstream analysis of the CNS compartment utilizing both histologic and single-cell studies. The representative results focus on assessing immune cells in the CNS compartment; however, the protocols may be adapted to analyze microglia, astrocytes, neurons, pericytes, endothelial cells, or other CNS resident cells.
A critical step in the described methods is the careful extraction of the tissue, essential for both isolating pure single-cell suspensions from brain, spinal cord, and meninges and for obtaining CNS tissues with either intact skulls or vertebral columns, allowing high-quality tissue morphology. Practicing the technique for obtaining single-cell suspensions is the key to a successful tissue extraction because it will not only enhance the purity of the sample but also improve cell yields for downstream applications. Similarly, practice in the isolation of CNS tissues with intact skulls or vertebral columns to adequately remove excess tissue surrounding the bone is an essential step that ensures better fixation, decalcification, and cryopreservation of the tissue, all crucial components for obtaining tissue sections with high-quality morphology and intact antigen targets.
One limitation of our protocol for isolating single-cell suspensions from the meninges is that it focuses on obtaining dural and arachnoid meninges32,54 while omitting the isolation of the pia, which remains attached to the brain or spinal cord via astrocyte processes. Although the cells residing in the pia mater are an essential component of the meningeal compartment, it was decided to exclude the pia mater during the single-cell suspension preparation due to the extensive amount of time required to adequately isolate it55. Similarly, the protocol only focuses on obtaining meninges in the superior portion of the cranium and excludes the isolation of the invaginating meninges in the brain and choroid plexus. Collection of the invaginating meninges and choroid plexus can be conducted according to previously published protocols55, although it is a time-consuming procedure. In both cases the choice to omit part of the meningeal layers was due to the amount of time it requires to isolate them. The timing of the protocol used to prepare single-cell suspensions required for downstream applications such as flow cytometry, cell culture assays, and RNA sequencing (RNAseq) is critical to improve cell viability and data quality. Therefore, depending on the specific research question, a balance should be struck between sample isolation time and the thoroughness in extracting the meninges. In the current protocol, only single-cell suspension preparations from the dura and arachnoid meninges are obtained, which limits the ability to extrapolate results to the entirety of the CNS meninges. However, if these methods are used in combination with IHC or ISH analysis of whole tissue sections with the three layers of meninges, a more thorough understanding of the cellular and molecular dynamics in the parenchymal and meningeal compartments can be gained.
Another limitation of the protocol is the low cell numbers obtained from the dural and arachnoid meninges, especially during homeostatic conditions. However, if cell numbers in the spinal cord, brain, or the meninges are deemed to be too low for analysis of a particular target cell population, the minimal cell number required for that analysis can be determined by estimating the total number of events required for a given precision (e.g., 5% coefficient of variation) as described in previous literature specializing in rare event analysis56. These calculations can then be used to determine if samples from multiple animals must be pooled in order to acquire sufficient cell numbers to analyze the cell population of interest.
The methods described provide an essential advancement in the investigation of the cellular dynamics within the CNS compartment by extending analyses to include the commonly neglected meningeal compartment. These protocols allow for the individual extraction of the brain, spinal cord, and the dural and arachnoid meninges to generate single-cell suspensions. Additionally, the decalcification protocol allows histological analyses of tissue sections comprising brain or spinal cord tissue inclusive of the three meningeal layers. Utilizing EDTA provides a slow but gentle decalcification process, which is most appropriate for specimens where high-quality tissue morphology is required (e.g., IHC and ISH). The protocol uses a pH of 7.2–7.4 to slow the rate of decalcification and ensure the maintenance of intact tissue morphology, a clear advantage over strong and weak acids (e.g., hydrochloric acid and trichloroacetic acid), which have a shorter decalcification time, but impact the quality of the tissue morphology.
Future methods seeking to isolate single-cell suspensions from the meninges should focus on developing protocols to shorten the time required to thoroughly isolate the pial layer from CNS tissues and the invaginating meninges in the brain. Obtaining the complete complex of the three meningeal layers will not only increase the cell numbers for any analysis but will also provide a more comprehensive assessment of the resident and infiltrating immune cells occupying the meninges, which enclose the CNS. Concurrently, future protocols focused on preparing decalcified brains and spinal cords should seek to identify novel agents aimed at expediting tissue decalcification while preserving the quality of tissue morphology. However, altogether, downstream applications analyzing CNS single-cell suspensions inclusive of dual and arachnoid meninges, performed in combination with comprehensive tissue section analysis, can provide a detailed understanding of cell phenotype, function, and localization within the CNS compartment.
Disclosures
The authors have nothing to disclose.
Acknowledgements
The authors thank the staff of the Center for Comparative Medicine and Research (CCMR) at Dartmouth for their expert care of the mice used for these studies. The Bornstein Research Fund funded this research.
Materials
| Name | Company | Catalog Number | Comments |
|---|---|---|---|
| Aluminum foil | any | N/A | |
| Bovine Serum Albumin | ThermoFisher Scientific | 37002D | |
| Centrifuge | Beckman Coulter | Allegra X-12R centrifuge | |
| Collagenase I | Worthington | LS004196 | |
| Conical tube, 15 mL | VWR | 525-1069 | |
| Conical tube, 50 mL | VWR | 89039-658 | |
| Cover glass | Hauser Scientific | 5000 | |
| Cryomold | VWR | 18000-128 | |
| Curved forceps | Fine Science Tools | 11003-14 | |
| Disposable polystyrene tube, 14 mL | Fisher Scientific | 14-959-1B | |
| Disposable Scalpel | Fisher Scientific | NC0595256 | |
| DNAse I | Worthington | LS002139 | |
| Dry ice | Airgas | N/A | |
| Durmont #7Forceps | Fine Science Tools | 11271-30 | |
| EDTA disodium salt dihydrate | Amresco | 0105-500g | |
| Ethanol, 100% | any | N/A | |
| Fetal Bovine Serum (FBS) | Hyclone | SH30910.03 | |
| Filter top tube, 5 mL | VWR | 352235 | |
| Fixable viability stain 780 | Becton Dickinson | 565388 | |
| Flow cytometer | Beckman Coulter | Gallios | |
| Glucose | Fisher Chemical | D16-500 | |
| Goat anti-mouse IgG (488 conjugate) | Jackson immunoresearch | 115-546-146 | |
| Goat anti-mouse IgG (594 conjugate) | Jackson immunoresearch | 115-586-146 | |
| Goat anti-rabbit 488 | Jackson immunoresearch | 111-545-144 | |
| Goat anti-rat 594 | Jackson immunoresearch | 112-585-167 | |
| Goat anti-rat 650 | Jackson immunoresearch | 112-605-167 | |
| Hank's Balnced Salt Solution (HBSS) | Corning | 21-020-CV | |
| Hemacytometer | Andwin Scientific | 02-671-51B | |
| Hemostat | Fine Science Tools | 13004-14 | |
| HEPES (N-2-hydroxyethylpiperazine-N-2-ethane sulfonic acid) | ThermoFisher Scientific | 15630080 | |
| KCl | Fisher chemical | BP366-500 | |
| KH2PO4 (anhydrous) | Sigma Aldrich | P5655-100G | |
| Liquid Nitrogen | Airgas | N/A | |
| Mouse FC block (CD16/32) | Becton Dickinson | 553141 | |
| Na2HP04 (anhydrous) | Fisher Chemical | S374-500 | |
| NaCl | Fisher chemical | S671-500 | |
| Needle, 25 gauge | Becton Dickinson | 305122 | |
| Normal mouse serum | ThermoFisher Scientific | 31881 | |
| Nylon mesh strainer | VWR | 352350 | |
| OCT | Sakura | 4583 | |
| Paraformaldehyde, 20% | Electron Microscopy Sciences | 15713-S | Diluted to 4% using 1 x PBS |
| Pasteur pipette, 9 inch, unplugged | Fisher Scientific | 13-678-20C | |
| PBS (1x) | Corning | 21-040-CV | |
| PE Rat Anti-Mouse CD4 | Becton Dickinson | 553730 | |
| PE-CF594 Rat Anti-Mouse CD19 | Becton Dickinson | 562329 | |
| Percoll density gradient media | GE healthcare | 17-0891-01 | |
| PerCP-Cy5.5 Rat Anti-Mouse CD45 | Becton Dickinson | 550994 | |
| Petri dish, 100 mm | VWR | 353003 | |
| pH meter | Fisher Scientific | 13-636-AB150 | |
| Pipet-Aid | Drummond Scientific Corporation | 4-000-101 | |
| Pipette 200 µl | Gilson | FA10005M | |
| Pipette tips, 1 mL | USA Scientific | 1111-2831 | |
| Pipette tips, 200 µl | USA Scientific | 1111-1816 | |
| Pipette, 1 mL | Gilson | FA10006M | |
| Prolong Diamond mountant with DAPI | ThermoFisher Scientific | P36962 | |
| Purified Rat Anti-Mouse CD16/CD32 | Becton Dickinson | 553141 | |
| Rabbit anti-mouse CD3 (SP7 clone) | Abcam | ab16669 | |
| Rabbit anti-mouse laminin | Abcam | ab11575 | |
| Rat anti-mouse ERT-R7 | Abcam | ab51824 | |
| RPMI 1640 | Corning | 10-040-CV | |
| Serological pipet, 1 mL | VWR | 357521 | |
| Serological pipet, 10 mL | VWR | 357551 | |
| Serological pipet, 5 mL | VWR | 357543 | |
| Sodium hydroxide | Fisher Scientific | S318-100 | |
| Sucrose | Fisher chemical | S5-500 | |
| Surgical scissors | Fine Science Tools | 14001-16 | |
| Surgical scissors, extra fine | Roboz | RS-5882 | |
| Syringe, 10 mL | Becton Dickinson | 302995 | |
| Syringe, 5 mL | Becton Dickinson | 309646 | |
| Trypan blue | Gibco | 15250-061 | |
| Vacuum filter system | Millipore | 20207749 | |
| Vacuum flask | Thomas Scientific | 5340-2L | |
| Vacuum in-line filter | Pall Corporation | 4402 | |
| Vacuum line | Cole Palmer | EW-06414-20 | |
| Water bath | ThermoFisher Scientific | Versa bath |
References
- Mastorakos, P., McGavern, D. The anatomy and immunology of vasculature in the central nervous system. Science Immunology. 4 (37), 0492(2019).
- Carson, M. J., Doose, J. M., Melchior, B., Schmid, C. D., Ploix, C. C. CNS immune privilege: hiding in plain sight. Immunological Reviews. 213, 48-65 (2006).
- Rua, R., McGavern, D. B. Advances in Meningeal Immunity. Trends in Molecular Medicine. 24 (6), 542-559 (2018).
- Greene, H. S. The transplantation of tumors to the brains of heterologous species. Cancer Research. 11 (7), 529-534 (1951).
- Murphy, J. B., Sturm, E. Conditions determining the transplantability of tissues in the brain. Journal of Experimental Medicine. 38 (2), 183-197 (1923).
- Louveau, A., Harris, T. H., Kipnis, J. Revisiting the Mechanisms of CNS Immune Privilege. Trends in Immunology. 36 (10), 569-577 (2015).
- Prinz, M., Priller, J. The role of peripheral immune cells in the CNS in steady state and disease. Nature Neuroscience. 20 (2), 136-144 (2017).
- Louveau, A., et al. Structural and functional features of central nervous system lymphatic vessels. Nature. 523 (7560), 337-341 (2015).
- Korin, B., et al. High-dimensional, single-cell characterization of the brain's immune compartment. Nature Neuroscience. 20 (9), 1300-1309 (2017).
- Walker-Caulfield, M. E., Hatfield, J. K., Brown, M. A. Dynamic changes in meningeal inflammation correspond to clinical exacerbations in a murine model of relapsing-remitting multiple sclerosis. Journal of Neuroimmunology. 278, 112-122 (2015).
- Gadani, S. P., Smirnov, I., Smith, A. T., Overall, C. C., Kipnis, J. Characterization of meningeal type 2 innate lymphocytes and their response to CNS injury. Journal of Experimental Medicine. 214 (2), 285-296 (2017).
- Aspelund, A., et al. A dural lymphatic vascular system that drains brain interstitial fluid and macromolecules. Journal of Experimental Medicine. 212 (7), 991-999 (2015).
- Li, J., Zhou, J., Shi, Y. Scanning electron microscopy of human cerebral meningeal stomata. Annals of Anatomy. 178 (3), 259-261 (1996).
- Louveau, A., et al. CNS lymphatic drainage and neuroinflammation are regulated by meningeal lymphatic vasculature. Nature Neuroscience. 21 (10), 1380-1391 (2018).
- Choi, S. R., et al. Meningeal inflammation plays a role in the pathology of primary progressive multiple sclerosis. Brain. 135, Pt 10 2925-2937 (2012).
- Howell, O. W., et al. Meningeal inflammation is widespread and linked to cortical pathology in multiple sclerosis. Brain. 134, Pt 9 2755-2771 (2011).
- Kooi, E. J., Geurts, J. J., van Horssen, J., Bo, L., van der Valk, P. Meningeal inflammation is not associated with cortical demyelination in chronic multiple sclerosis. Journal of Neuropathology & Experimental Neurology. 68 (9), 1021-1028 (2009).
- Lucchinetti, C. F., et al. Inflammatory cortical demyelination in early multiple sclerosis. New England Journal of Medicine. 365 (23), 2188-2197 (2011).
- Magliozzi, R., et al. A Gradient of neuronal loss and meningeal inflammation in multiple sclerosis. Annals of Neurology. 68 (4), 477-493 (2010).
- Arac, A., et al. Evidence that meningeal mast cells can worsen stroke pathology in mice. American Journal of Pathology. 184 (9), 2493-2504 (2014).
- Benakis, C., et al. Commensal microbiota affects ischemic stroke outcome by regulating intestinal gammadelta T cells. Nature Medicine. 22 (5), 516-523 (2016).
- Roth, T. L., et al. Transcranial amelioration of inflammation and cell death after brain injury. Nature. 505 (7482), 223-228 (2014).
- Shechter, R., et al. Recruitment of beneficial M2 macrophages to injured spinal cord is orchestrated by remote brain choroid plexus. Immunity. 38 (3), 555-569 (2013).
- Schain, A. J., et al. Activation of pial and dural macrophages and dendritic cells by cortical spreading depression. Annals of Neurology. 83 (3), 508-521 (2018).
- Azevedo, R. S. S., et al. In situ immune response and mechanisms of cell damage in central nervous system of fatal cases microcephaly by Zika virus. Scientific Reports. 8 (1), 1(2018).
- Coles, J. A., et al. Intravital imaging of a massive lymphocyte response in the cortical dura of mice after peripheral infection by trypanosomes. PLoS Neglected Tropical Diseases. 9 (4), 0003714(2015).
- Kang, S. S., McGavern, D. B. Lymphocytic choriomeningitis infection of the central nervous system. Frontiers in Bioscience. 13, 4529-4543 (2008).
- DiSano, K. D., Stohlman, S. A., Bergmann, C. C. Activated GL7(+) B cells are maintained within the inflamed CNS in the absence of follicle formation during viral encephalomyelitis. Brain, Behavior, and Immunity. 60, 71-83 (2017).
- DiSano, K. D., R, D. B., Gilli, F., Pachner, A. R. Central Nervous System Inflammatory Aggregates in the Theiler's Virus Model of Progressive Multiple Sclerosis. Frontiers in Immunology. 10, (2019).
- Kennedy, H. S., Jones, C., Caplazi, P. Comparison of standard laminectomy with an optimized ejection method for the removal of spinal cords from rats and mice. Journal of Histotechnology. 36 (3), 86-91 (2013).
- Richner, M., Jager, S. B., Siupka, P., Vaegter, C. B. Hydraulic Extrusion of the Spinal Cord and Isolation of Dorsal Root Ganglia in Rodents. Journal of Visualized Experiments. (119), e55226(2017).
- Manglani, M., Gossa, S., McGavern, D. B. Leukocyte Isolation from Brain, Spinal Cord, and Meninges for Flow Cytometric Analysis. Current Protocols in Immunology. 121 (1), 44(2018).
- Laroumanie, F., Dale, B. L., Saleh, M. A., Madhur, M. S. Intracellular Staining and Flow Cytometry to Identify Lymphocyte Subsets within Murine Aorta, Kidney and Lymph Nodes in a Model of Hypertension. Journal of Visualized Experiments. (119), e55266(2017).
- Cao, Y., et al. An optimized assay for the enumeration of antigen-specific memory B cells in different compartments of the human body. Journal of Immunological Methods. 358 (1-2), 56-65 (2010).
- Wykes, M. N., Renia, L. ELISPOT Assay to Measure Peptide-specific IFN-γ Production. Bio-Protocol. 7 (11), (2017).
- Gjurich, B. N., Taghavie-Moghadam, P. L., Galkina, E. V. Flow Cytometric Analysis of Immune Cells Within Murine Aorta. Methods in Molecular Biology. 1339, 161-175 (2015).
- Laboissonniere, L. A., Sonoda, T., Lee, S. K., Trimarchi, J. M., Schmidt, T. M. Single-cell RNA-Seq of Defined Subsets of Retinal Ganglion Cells. Journal of Visualized Experiments. (123), e55229(2017).
- Currle, D. S., Monuki, E. S. Flash freezing and cryosectioning E12.5 mouse brain. Journal of Visualized Experiments. (4), 198(2007).
- McGowan, J. W., Bidwell, G. L. The Use of Ex Vivo Whole-organ Imaging and Quantitative Tissue Histology to Determine the Bio-distribution of Fluorescently Labeled Molecules. Journal of Visualized Experiments. (118), e54987(2016).
- JoVE Science Education Database. Basic Methods in Cellular and Molecular Biology. Using a Hemacytometer to Count cells. Journal of Visualized Experiments. , Available from: https://www.jove.com/science-education/5048/using-a-hemacytometer-to-count-cells (2019).
- Ricardo, R., Phelan, K. Counting and determining the viability of cultured cells. Journal of Visualized Experiments. , e752(2008).
- Hatfield, J. K., Brown, M. A. Group 3 innate lymphoid cells accumulate and exhibit disease-induced activation in the meninges in EAE. Cellular Immunology. 297 (2), 69-79 (2015).
- Molina Estevez, F. J., Mathews, T. D., Biffi, A., Peviani, M. Simultaneous Flow Cytometric Characterization of Multiple Cell Types Retrieved from Mouse Brain/Spinal Cord Through Different Homogenization Methods. Journal of Visualized Experiments. (153), e752(2019).
- Herz, J., Louveau, A., Da Mesquita, S., Kipnis, J. Morphological and Functional Analysis of CNS-Associated Lymphatics. Methods in Molecular Biology. 1846, 141-151 (2018).
- Kwong, B., et al. T-bet-dependent NKp46(+) innate lymphoid cells regulate the onset of TH17-induced neuroinflammation. Nature Immunology. 18 (10), 1117-1127 (2017).
- Justus, C. R., Leffler, N., Ruiz-Echevarria, M., Yang, L. V. In vitro cell migration and invasion assays. Journal of Visualized Experiments. (88), e51046(2014).
- Nurkhametova, D., et al. Activation of P2X7 Receptors in Peritoneal and Meningeal Mast Cells Detected by Uptake of Organic Dyes: Possible Purinergic Triggers of Neuroinflammation in Meninges. Frontiers in Cellular Neuroscience. 13, 45(2019).
- Van Hove, H., et al. A single-cell atlas of mouse brain macrophages reveals unique transcriptional identities shaped by ontogeny and tissue environment. Nature Neuroscience. 22 (6), 1021-1035 (2019).
- Czupalla, C. J., Yousef, H., Wyss-Coray, T., Butcher, E. C. Collagenase-based Single Cell Isolation of Primary Murine Brain Endothelial Cells Using Flow Cytometry. Bio-Protocol. 8 (22), 3092(2018).
- Katzenell, S., Cabrera, J. R., North, B. J., Leib, D. A. Isolation, Purification, and Culture of Primary Murine Sensory Neurons. Methods in Molecular Biology. 1656, 229-251 (2017).
- Eriksdotter-Nilsson, M., Björklund, H., Olson, L. Laminin immunohistochemistry: a simple method to visualize and quantitate vascular structures in the mammalian brain. Journal of Neuroscience Methods. 17 (4), 275-286 (1986).
- Cha, J. H., et al. Prompt meningeal reconstruction mediated by oxygen-sensitive AKAP12 scaffolding protein after central nervous system injury. Nature Communications. 5, 4952(2014).
- Van Vliet, E., Melis, M., Foidart, J. M., Van Ewijk, W. Reticular fibroblasts in peripheral lymphoid organs identified by a monoclonal antibody. Journal of Histochemistry and Cytochemistry. 34 (7), 883-890 (1986).
- Louveau, A., Filiano, A. J., Kipnis, J. Meningeal whole mount preparation and characterization of neural cells by flow cytometry. Current Protocols in Immunology. 121 (1), (2018).
- Derecki, N., J, K. Mouse meninges isolation for FACS. Protocol Exchange. , (2014).
- Hedley, B. D., Keeney, M. Technical issues: flow cytometry and rare event analysis. International Journal of Laboratory Hematology. 35 (3), 344-350 (2013).
Reprints and Permissions
