In vivo imaging is a powerful tool for the study of biology in health and disease. This protocol describes transpupillary imaging of the mouse retina with a standard two-photon microscope. It also demonstrates different in vivoimaging methods to fluorescently label multiple cellular cohorts of the retina.
Method Article
Transpupillary Two-Photon In Vivo Imaging of the Mouse Retina
In This Article
Summary
Abstract
The retina transforms light signals from the environment into electrical signals that are propagated to the brain. Diseases of the retina are prevalent and cause visual impairment and blindness. Understanding how such diseases progress is critical to formulating new treatments. In vivo microscopy in animal models of disease is a powerful tool for understanding neurodegeneration and has led to important progress towards treatments of conditions ranging from Alzheimer's disease to stroke. Given that the retina is the only central nervous system structure inherently accessible by optical approaches, it naturally lends itself towards in vivo imaging. However, the native optics of the lens and cornea present some challenges for effective imaging access.
This protocol outlines methods for in vivo two-photon imaging of cellular cohorts and structures in the mouse retina at cellular resolution, applicable for both acute- and chronic-duration imaging experiments. It presents examples of retinal ganglion cell (RGC), amacrine cell, microglial, and vascular imaging using a suite of labeling techniques including adeno-associated virus (AAV) vectors, transgenic mice, and inorganic dyes. Importantly, these techniques extend to all cell types of the retina, and suggested methods for accessing other cellular populations of interest are described. Also detailed are example strategies for manual image postprocessing for display and quantification. These techniques are directly applicable to studies of retinal function in health and disease.
Introduction
In vivo visualization of the central nervous system generally requires invasive procedures like skull thinning and installation of glass windows or optical relay lenses. The retina is the only structure in the nervous system that can be directly observed without the need for invasive preparation as it natively receives light from the environment. The ease of optical access to the retina makes it an attractive model system for studying the central nervous system.
Live fluorescent imaging of the retina in mice has been used to track RGC death in models of glaucoma1,2, optic nerve injury1,3,4, and stroke5, as well as changes in microglial activation6,7,8 and vasculature9 in degenerative conditions. Intrinsic signals can also be used to visualize photoreceptors10,11,12 and retinal pigment epithelial cells13. Many approaches to in vivo imaging of the retina use either highly specialized devices specifically designed for ophthalmological purposes6 or highly modified optical systems to correct for the native aberrations of the cornea and lens8,9,11,12,13,14.
The present protocol demonstrates an approach to in vivo imaging of fluorescent signals in the retina at cellular resolution, utilizing a basic method of partially correcting for the anterior optics of the mouse eye. This strategy requires very minor adaptations to multiphoton microscope setups that are commonly used for in vivo imaging of the brain. As this approach is straightforward to set up, and the mice are under little stress, it is conducive to perform time-lapse experiments over both acute and chronic durations. Additionally, genetic and organic dye-based procedures that label individual retinal components, including RGCs, amacrine cells, microglia, and vasculature, are compatible with this imaging technique and enable in vivo observation of cell types and structures critical for retinal function. These tools can be adapted to label most other neuronal cell types as well as glial and vascular components of the retina.
Protocol
NOTE: The following procedure was performed in compliance with the guidelines of the Institutional Animal Care and Use Committee at Washington University in St. Louis. See the Table of Materials for details about the reagents, equipment, and animals used in this study.
1. Adeno-associated virus injection
NOTE: Labeling of specific cells in the retina can be accomplished in Cre transgenic mouse lines with restricted patterns of expression. This section describes intravitreal delivery of AAV-vectors that encode Cre-dependent expression of a fluorescent protein, thus labeling specific retinal cells. Inject mice (male and female), starting at 4 weeks of age.
- Preparing the micropipette needle
- Use a micropipette puller to create a borosilicate glass capillary needle. Load a glass capillary in the micropipette puller and perform the Ramp Test, recording the resulting value. Discard the glass capillary used for the Ramp Test.
- Pull micropipettes with the following settings: heat: Ramp Test value minus 10; pull: 55; velocity: 65; time: 120; air pressure: 500; air time at start of pull: 20.
NOTE Settings may need to be adjusted for different pullers. - Under a dissecting microscope, use a razor blade to cut the tip of the pulled micropipette at the location where the glass tip deflects slightly under force, ~10 mm from the end of the tapered section. Cut at a sharp angle such that the cut produces a beveled tip. Discard blunt tips.
- Preparing injection syringe
- Fit a cut glass micropipette into a 2 cm segment of ethyl vinyl acetate (EVA) plastic tubing (0.05" inner diameter, 0.09" outer diameter). Connect the other end of this tubing segment to a 20 cm length of EVA tubing (0.02" inner diameter, 0.06" outer diameter).
- Connect the tubing to a 50 μL glass syringe with a 22 G cemented needle. Remove the plunger from the glass syringe and backfill the syringe and connected tubing with mineral oil using a 25 G syringe needle. Leave 4 mm air space at the tip of the micropipette.
- Intravitreal injection of AAV
- Perform intravitreal injection with standard aseptic technique, using sterile surgical gloves, clean lab coat, mask, sterile field, and autoclaved instruments according to institutional protocols for survival surgery.
- Remove an aliquot of AAV vector from storage at -80 °C and thaw on ice. After thawing, centrifuge for 10 s at 2,000 × g to remove any air bubbles.
- Follow the anesthesia and controlled substances guidelines of the institutional Animal Studies Committee. Using a 30 G hypodermic needle, perform a 0.1 mL/10 g body weight intraperitoneal (IP) injection of a ketamine/xylazine cocktail (10 mg/mL ketamine, 1 mg/mL xylazine in saline, effective dose to mouse: 100 mg/kg ketamine, 10 mg/kg xylazine). Return the mouse to its cage and allow 5 min for anesthesia to take effect.
- Using a 30 G hypodermic needle, perform a 0.1 mL/10 g body weight subcutaneous injection of meloxicam (0.5 mg/mL in 0.9% sodium chloride).
- Test the depth of anesthesia by confirming loss of corneal reflex and withdrawal reflex to tail and toe pinch. If corneal reflex persists after loss of tail and toe withdrawal reflex, apply a drop of 0.5% proparacaine solution to each eye and wait for 10 s.
- Place the mouse on its side under the stereomicroscope. Use a mini bulldog hemostatic clamp to grab the skin superior and inferior to the orbit, and secure the clamp at the medial canthus to partially displace the globe up out of the orbit.
- Puncture the lateral sclera with the cut micropipette connected to the glass syringe, ~1-2 mm posterior to the limbus. Avoid disturbing the vasculature that runs circumferentially immediately posterior to the limbus. Perform the puncture at an angle perpendicular to the sclera, and slightly retract the micropipette immediately after piercing the sclera to avoid damaging the lens.
- Use the plunger of the glass syringe to withdraw 1-2 μL of vitreous humor, corresponding roughly to the fluid volume intended for injection. Withdraw the micropipette from the eye, and eject the removed vitreous humor.
- Fill the tip of the micropipette with 1-2 μL of AAV, leaving ~4 mm of air space between the viral vector and the mineral oil to avoid mixing. Insert the micropipette in the hole in the sclera created by the first puncture, and slowly press the plunger of the glass syringe to inject the viral vector over the course of 20-30 s. Visualize the fluid level of the viral vector in the tip of the micropipette, and be careful to stop injecting before any air enters the eye.
- Hold the micropipette in the same position for 10 s, then retract the micropipette. Remove the bulldog hemostatic clamp.
- Apply oxytetracycline/polymyxin B antibiotic ophthalmic ointment to the injected eye. Place the mouse on a heating pad, and monitor its recovery from anesthesia (see 3.4.3).
- Return the mouse to its housing, and perform postoperative care per institutional guidelines. Allow 2-3 weeks for viral-mediated expression of fluorophores before imaging.
2. Microscope setup
NOTE: A schematic of the microscope light path is shown in Figure 1.
- "Always-On" equipment: These instruments should always remain on unless undergoing adjustment or maintenance. Set the high temperature of the laser cooling system to 20.0 °C. Turn on the main power to the ultrafast Ti:Sapphire laser, allow time for completion of system startup processes, and turn the "Laser Enable" key to the "On" position.
- Emission light path configuration
- Configure the fluorescence emission collection path to sample wavelengths using appropriate dichroic and band pass filter sets for the fluorophores of interest.
NOTE: In this manuscript, Twitch2b imaging used a filter cube consisting of a 505 long pass dichroic and 480/40 and 535/30 band pass filter pairs. GFP was imaged using a red/green filter cube consisting of a 560 long pass filter with 525/50 and 605/70 band pass filters. Evans Blue was imaged using a 560 short pass filter. Changing emission filters exposes the emission light path to stray room light that could damage photomultiplier tubes (PMTs). Ensure PMTs are turned off, and turn off room lights prior to modifying the collection light path as light exposure can adversely affect PMT function.
- Configure the fluorescence emission collection path to sample wavelengths using appropriate dichroic and band pass filter sets for the fluorophores of interest.
- Starting up image acquisition
NOTE: Direct exposure to the two-photon laser is hazardous, especially to the eye as far-red light will not induce a blink response. Proper care should be taken to ensure that the laser is closed along the light path, and fail-safes are in place to protect the user from exposure via the eye pieces or emissions from the microscope objective. Users should understand under which conditions the laser will emit from the objective, and take proper precautions not to expose themselves to such hazards.- Turn on the data acquisition device, computer, Pockels cell, microscope and stage controller, mechanical shutter controller, and PMT main power. Keep PMTs in the "Disabled" state until ready for image acquisition and shielded from stray light. Open the laser control interface on the computer and image acquisition software. Turn on the laser from the computer interface and ensure mode-locking.
- Set the desired laser wavelength. Ensure that laser light is entering the Pockels Cell by opening the laser shutter, and allow 30 min for laser power to stabilize.
- Measuring laser power at the objective and setting maximum laser percentage
NOTE: Laser radiation emits from the objective lens during power measurement. Close the microscope enclosure curtain, and wear appropriate eye protection prior to enabling the imaging shutter. Measure laser power at the time of initial system installation to establish the power output curve for each wavelength of interest and monthly thereafter to verify the stability of excitation power.- Turn on the optical power meter, and select the measurement wavelength corresponding to the laser wavelength. Place the optical power meter detector on the microscope stage and maneuver it directly under the objective lens in the X-Y dimensions. Using the Z-dimension motorized focus drive, lower the objective lens until the power meter detector is ~1 mm below the objective lens.
- Switch from epifluorescence illumination to the laser as the microscope excitation light path. Enable the mechanical shutter.
- In the image acquisition software, start a point scan to open the imaging shutter, and send the laser to the optical power meter. Set the laser power to 100% in the scanning software. Optimize the X-Y and Z positions of the power meter detector until the highest laser power measurement is achieved.
- Measure laser power at the objective from 0.1% to 100% on the Pockels Cell, taking measurements at 10% intervals. Record the Pockels Cell percentage corresponding to 45 mW of power at the objective. Set this percentage as the maximum laser power in the image acquisition software.
NOTE: The highest power observed for in vivo mouse retinal imaging without visible damage to the target tissue was 45 mW, as assayed by histological staining two weeks after imaging. Obvious retinal damage is evident after imaging with 55 mW at the objective. - Disable the imaging shutter and return the excitation light path to epifluorescence.
3. Preparation of mouse for image acquisition
- Anesthetizing mouse for imaging
NOTE: Ensure proper waste gas scavenging to mitigate exposure to isoflurane. Make sure the exhaust port of the anesthesia induction chamber is connected to a passive scavenging gas filter cannister, and the outlet of the mouse anesthesia nosepiece is connected to an active scavenging gas filter cannister with vacuum provided by a gas evacuation apparatus. Follow the manufacturer's guidelines for monitoring the filter canister weight for replacement.- Anesthetize the mouse using the ketamine/xylazine cocktail as described above in step 1.3.3. Alternatively, induce anesthesia via isoflurane inhalation if also using isoflurane for maintenance of anesthesia (imaging session > 30 min). Set the small animal anesthesia device to fill the induction chamber with 5% isoflurane mixed with room air at a flow rate of 0.5 L/min. Place the mouse in the induction chamber, and allow 15 s for the mouse to become anesthetized.
- Switch the isoflurane vaporizer to 0%, and direct the anesthesia flow to the nosepiece. Perform a 5-seconds "O2 flush" of the induction chamber. Take the mouse out of the induction chamber, and secure it in the head holder (see section 3.3), attaching the nosepiece.
- Use a mixture of 1% isoflurane with room air at a flow rate of 0.5 L/min for maintenance of anesthesia. Monitor respiratory rate at 5-minute intervals throughout anesthesia, adjusting the isoflurane percentage to maintain a respiratory rate of ~60 breaths/min.
NOTE: These settings (% isoflurane, flow rate) can also be used for maintenance of anesthesia induced by the ketamine/xylazine cocktail.
- Pupil dilation
- Prepare a solution of 1% w/v atropine and 2.5% w/v phenylephrine hydrochloride in water. Store the dilator solution at room temperature protected from light.
- Using a disposable pipette eye dropper, apply a drop of the dilator solution to each eye that will be imaged. Turn off the room lights, and wait 5 min for the pupil to dilate. When the pupil is dilated, blot away the dilator solution with lint-free tissue.
NOTE: Ensure dilator solution does not enter the nostrils. - Apply a large drop of lubricant eye gel to each eye that will be imaged. If both eyes are to be imaged, apply a small piece of plastic cling film over the eye gel on the non-imaging eye to prevent dehydration. If only imaging one eye, apply lubricant eye ointment to the eye that will not be imaged.
- Positioning mouse for imaging
- To secure the mouse in the imaging head holder, rotate the main arm of the head holder until the earpiece bar is tilted at an angle of 60° or more below horizontal. Secure the lower ear canal pin in the inward extended position and the upper ear canal pin in the withdrawn position.
- With the mouse facing the bite bar, mount one ear onto the extended lower pin, inserting the pin into the ear canal. Loosen the screw securing the upper ear canal pin, and extend the pin into the other ear canal. Tighten the screw to secure the head.
- Slide the bite bar toward the head of the mouse. Gently elevate the head of the mouse, then lower the maxillary incisors of the mouse into the hole of the bite bar. Retract the bite bar with gentle force to secure the head of the mouse, and secure the bite bar position by tightening the screw.
- If using isoflurane, slide the nosepiece through its slot onto the bite bar prior to securing the incisors of the mouse. Secure and tighten the bite bar position as in step 3.3.3. Tighten the nosepiece using the two screws on its upper face until it fits snugly on the nose of the mouse, but does not constrict the snout.
- Transfer the mouse, in the head holder, to the microscope stage beneath the objective. Rotate the main arm of the head holder until the pupil of the eye is oriented straight up, in line with the light path (Figure 2).
- Place a #1.5 coverslip in the compact filter holder, and attach the holder to the microscope stage. Lower the coverslip toward the eye, contacting the lubricant eye gel, such that the coverslip lies horizontally immediately above the cornea (Figure 2). Ensure that the coverslip does not touch the cornea.
NOTE: On the microscope, ensure the excitation light path is set to epifluorescence and emission light path is set to eyepiece. Turn on the epifluorescence illuminator at its lowest power and open the illuminator shutter. Choose the epifluorescence illuminator wavelength and fluorescence filter corresponding to the fluorophore being imaged. - Maneuver the stage in the X-Y dimensions and objective in the Z-position using the stage control and motorized focus drive until the widefield excitation light fully covers the cornea. Looking through the eyepiece, continue to adjust the Z-position of the stage until the fluorescent cells or structures in the retina come into focus. Increase epifluorescence illuminator power if the sample signal is insufficiently bright to resolve individual cells or structures of interest through the eyepiece.
NOTE: If having trouble locating the retina, the iris is a high contrast landmark to anchor on and then focus down toward the retina. This step will also allow verification that the pupil is maximally dilated. - Obtain an imaging area on axis with the mouse lens. Adjust the angle of the mouse using the various degrees of freedom on the head holder until only expansion or contraction of out-of-focus light occurs when adjusting the focal plane. Turn off the epifluorescence illuminator and close the illuminator shutter.
NOTE: Significant X-Y parallax of out-of-focus light while scrolling through the Z-direction focal planes indicates that the retina is not on axis with respect to the imaging light path.
4. Two-photon image acquisition
- Image setup and acquisition parameters
NOTE: Turn off room lights, and cover stray light sources in the room. Ensure the epifluorescence illuminator is off, and the illuminator shutter is closed.- Switch the excitation light path to the laser and emission light path to the PMTs.
- In the image acquisition software, set a frame size of 512 x 512 and frame average of 3. Set the steps per slice to -8 µm. Designate z-stepping to start at the top of the stack and progress downward, minimizing two-photon laser activation of photoreceptors.
NOTE: The step size can be reduced to increase Z-resolution at a cost of increased imaging time, but 8 µm steps are sufficient to resolve cell somata in this imaging configuration. - Turn on and enable the PMTs. Adjust the PMT voltage to 680 V. Enable the excitation shutter.
NOTE: Powered PMTs are susceptible to light damage. Ensure that the epifluorescence illuminator is off, the microscope enclosure curtain is drawn, and room lights are off. - Begin a live image preview of the target tissue, starting with 1% laser power. Auto adjust the display brightness to visualize the cells or structures of interest. Auto adjust the scan phase. If the target tissue is dim or unclear, increase the laser power percentage until structures become visible without surpassing the limit set in step 2.4.4 corresponding to 45 mW.
NOTE: For a 16-bit image, a display value of ~1000 when auto adjusting brightness in a Z-plane containing structures of interest indicates sufficient brightness of the sample. - Maneuver the microscope stage in the X-Y direction to center on a desired imaging area, then navigate to the Z-plane with the structures of interest in focus.
NOTE: Imaging adjacent to the optic nerve head allows it to serve as an unambiguous landmark for chronic imaging experiments. - If this is a chronic time-lapse experiment, have a previous image open on the acquisition computer, and use it as a reference to find the same area of interest. Ensure that the angle of imaging is similar to that of previous images to acquire the same set of cells with minimal parallax.
NOTE: Further adjustment of the mouse head position is likely required to image the same cells as in previous time points (Figure 3). - Set the Z-limits of the imaging stack by navigating to the uppermost and lowermost Z-planes of interest, and acquire the image. Upon completion of image acquisition, disable the PMTs and the emission shutter. Switch the emission light path back to the eyepiece, and the excitation light path to epifluorescence illumination. Remove the mouse from the microscope stage.
- System software and hardware shutdown
- Exit the image acquisition software. Turn off the laser in the computer interface. Shut down hardware in reverse startup order, with the exception of the "Always-On" Equipment.
- Mouse recovery
- Remove the head holder and mouse from the microscope stage. If applicable, set the isoflurane vaporizer to 0%. Remove the mouse from the head holder.
- Gently wipe off lubricant eye gel with a lint-free tissue, and apply white petrolatum-mineral oil lubricant eye ointment to both eyes. Place the mouse on the warm water circulating heating pad (set at 37 °C), continue attending to the mouse and monitoring its respiratory rate until the mouse wakes up and regains ambulatory capacity. Return the mouse to its housing.
- If applicable, assess animal activity and morbidity at 24 h post intravitreal injection. Upon completion of the study, euthanize the mouse with an overdose of tribromoethanol (250 mg/kg) and perform transcardial perfusion with 4% paraformaldehyde to preserve retinal tissue.
5. Image processing and analysis
- Deinterleave and merge multichannel data
- As certain image acquisition software programs store multichannel images in an interleaved format, open the .tif image file using software, such as Fiji (https://imagej.net/Fiji), to separate the channels.
- In the Image menu of Fiji, select Stacks | Tools | Deinterleave. Input the number of channels composing the image and click OK.
- To merge the separated channels into a single file, go to Image | Color | Merge Channels. Place the deinterleaved image channels into separate color channels, and click OK to create the multichannel composite image. Save this composite image as a new .tif file.
- Quantification of fluorescence intensity in multichannel images
NOTE: Fluorescence intensity within designated regions of interest (ROIs) can be quantified in single-image planes using Fiji. Quantification of ratiometric readouts can be achieved by measuring the fluorescence intensity in different channels of a composite image within the same ROI. For chronic imaging experiments, it is best to use biosensors based on excitation or emission ratiometric outputs.- In Fiji, go to Analyze | Tools | ROI Manager. Open the composite image in Fiji. Scroll to the z-slice corresponding to the structure of interest, and use the Selection tools (such as Rectangle selection, Oval selection, Polygon selection) to outline the ROIs.
- Press T on the keyboard to add each selection to the ROI Manager. Upon completion of ROI selection, click on Measure in the ROI Manager to record various data from the ROIs such as Area and Mean Intensity value.
- Copy the measurements for the currently selected channel recorded in the Results window to a spreadsheet. Switch to the next Channel in the Composite image window and click on Measure to obtain measurements for that channel within the same set of ROIs. Within the ROI Manager, go to More | Save, and save the ROIs as a .zip file.
- Maximum intensity projections for display
- To create displays of the image data, use the Z-project function in Fiji. In the Image menu, select Stack | Z project. Choose only the frames within which areas of interest are present to reduce the background.
- If removal of PMT shot noise is desired, use the Median filter function. In the Process menu, select Process | Filters | Median. Choose a value of 1.0 to maintain spatial details.
- To create maximum-intensity projections focused on single cells, repeat this process choosing only the image frames that correspond to the cell of interest.
NOTE: This can greatly improve the ability to resolve cellular arbors (Figure 4). Measurements of fluorescence intensity should be performed in single-image planes and not on maximum intensity projections.
Results
Various transgenic, viral vector, or inorganic dye-labeling approaches can be used to specifically visualize several retinal cells types and structures in vivo using a simple adaptation of a basic multiphoton microscope. To visualize RGCs and amacrine cells, VGlut2-Cre and VGat-Cre transgenic mice, respectively, were given an intravitreal injection of a Cre-dependent AAV expression construct encoding Twitch2b, a cytoplasmic fluorescence resonance energy transfer (FRET)-based Ca2+ sensor that contains cyan and yellow fluorescent proteins (CFP and YFP, respectively) and the Ca2+ binding domain of troponin15. In VGlut2-Cre mice, RGC somas are clearly discernable, and fascicles of axons are often apparent (Figure 3).
It should be noted that the trajectory of axons and the negative image of the vasculature makes it very straightforward to identify the optic nerve head in VGlut2-Cre mice, which is useful as a landmark in chronic imaging experiments (Figure 3). Although amacrine cells appear less bright than RGCs, possibly due to their smaller soma size and/or less efficient AAV transduction, their somas are still readily apparent in the inner nuclear layer. In contrast to RGCs, amacrine cell neurites are more often observed in the inner plexiform layers (Figure 4). Retinal microglia can be imaged in the Cx3cr1-GFP transgenic mouse line6. Microglia associate with the vasculature, making it possible to find the same region in time-lapse imaging experiments.
This approach can be used to track the dynamics of fine microglia processes, a procedure that has better spatial resolution in single-plane images, or if maximum-intensity projections are prepared focusing on individual cells (Figure 5). The poor axial resolution caused by optical aberration through the mouse lens precludes examination of fine details in the z-dimension. To determine whether this imaging technique can observe degenerative changes in cellular ultrastructure, 1 µL of 50 mM N-methyl-D-aspartate (NMDA) was injected into the vitreous to induce excitotoxic lesion. One day after injection, the microglia demonstrated short processes or amoeboid morphology (Figure 5) in accordance with previous reports16. It should be noted that cells in the Cx3cr1-GFP transgenic line exhibited more uniform and complete fluorescent protein expression across the cellular cohort than in experiments with AAV-mediated delivery of fluorescent protein expression cassettes. The benefits of varied and sparse versus complete and uniform labeling should be considered when designing experiments.
To label retinal vasculature as previously described8, mice were injected intraperitoneally with 200 µL of Evans blue dye (20 mg/mL in sterile saline) 30-60 min before imaging. This led to strong labeling of blood vessels emanating from the optic nerve head (Figure 6). Surprisingly, the fluorescent signal of a single injection persisted for at least seven days. Two distinct methods were used to estimate the dimensions of the in vivo images. First, the same retinal regions were imaged in vivo and after fixation in flattened retinal wholemounts using confocal microscopy (Figure 7). Random cell pairs were selected from four different in vivo samples, and the true distance between cell pairs was measured in confocal scans and matched with in vivo pixel distance to obtain an average pixel size of 0.99 µm with 1x digital magnification. Using similar methods correlating in vivo images with confocal wholemount scans has revealed that a single head position allows for imaging over a roughly 650 mm2 patch of retina.
Repositioning of the head holder along one torsional axis can allow access to a linear region of the retina 2.2 mm in length (not shown). Further, 1 or 2 µm diameter fluorescent microspheres were injected into the eyes of mice and their diameter was measured as full-width half-maximum of line scans from in vivo images with 10x digital zoom. This gave a slightly larger pixel size estimate, but with more variance (Figure 7). Overall, confocal imaging of wholemount samples after completion of in vivo experiments is the most consistent method to assign scale to individual images, as variance in corneal and lens properties may alter image scale from sample to sample.
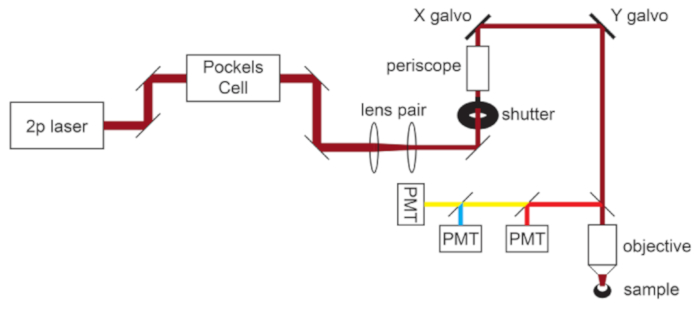
Figure 1: Light path schematic. The basic components of the two-photon microscope used in this protocol consist of a Pockels Cell to modulate laser power, a lens pair to reduce the laser beam diameter to match the back aperture of the microscope objective, and a pair of galvo scan mirrors for beam steering. A pair of steering mirrors is present before each major optical component. The focus is controlled by a motor that drives the objective mount. The emission light path can be customized for different fluorophores by changing out dichroic and barrier filters. A general setup for cyan/yellow/red imaging is displayed in which a short pass dichroic mirror directs red light to the first PMT, and a long pass dichroic mirror paired with appropriate band pass filters is used to separate cyan and yellow emissions. Abbreviation: PMT = photomultiplier tube. Please click here to view a larger version of this figure.
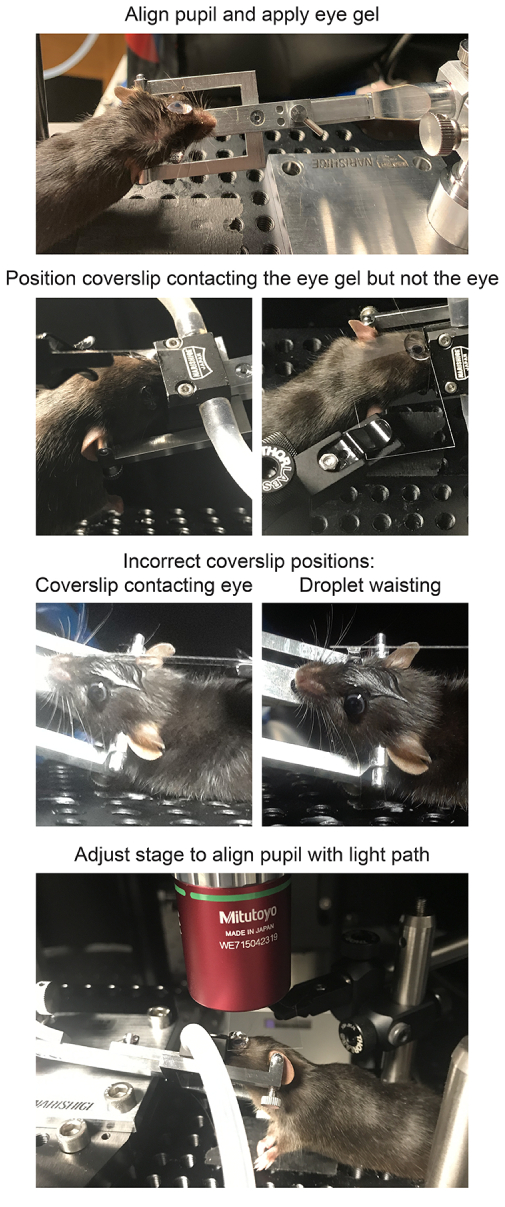
Figure 2: Positioning mice for in vivo imaging. To position the mouse with the pupil on axis with the light path, the anesthetized mouse is first restrained in a head holder, the head is rotated and angled, a large drop of lubricant eye gel is placed on the eye, and the mouse is placed on the stage. A coverslip is mounted in the coverslip holder perpendicular to the light path and lowered down towards the eye. The coverslip should not contact the cornea or mouse head (left), which will be evident if the coverslip is deflected. However, the coverslip should also be close enough to avoid waisting of the droplet (right), because this will have a demagnifying effect on the sample. After applying the gel immersion and securing the coverslip, the stage should be moved in place directly under the microscope objective. Please click here to view a larger version of this figure.
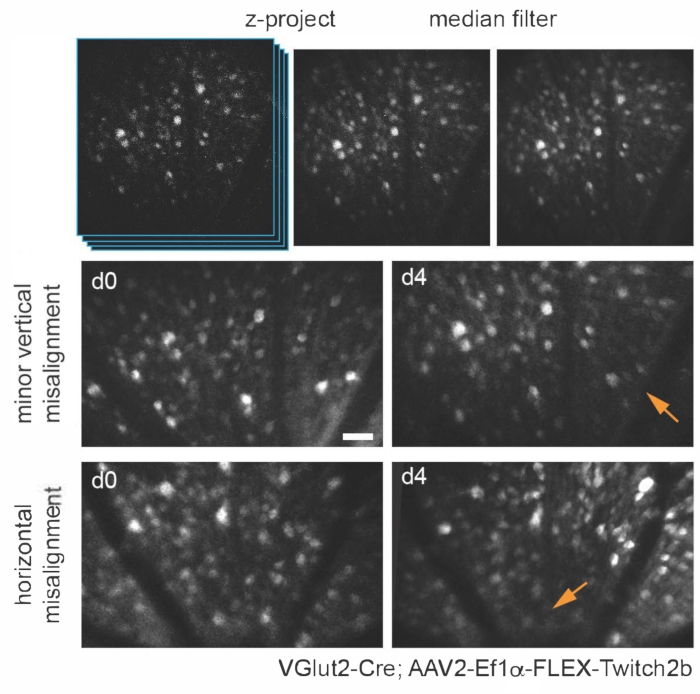
Figure 3: Imaging retinal ganglion cells. For image display, maximum intensity projections with the z-planes containing cells of interest are created, and resultant images are median-filtered to remove PMT shot noise. Two examples of retinal ganglion cells labelled by injecting AAV-EF1α-FLEX-Twitch2b into VGlut2-Cre transgenic mice are shown, specifically the CFP signal. Images were acquired at sessions four days apart, and vascular landmarks were used to return to the same region near the optic nerve head. The optic nerve head is oriented towards the bottom of the image. Although both samples show some variance in orientation (regions with decreased intensity are indicated with arrows), most cells are present at both time points. Scale bar = approximately 50 µm. Abbreviations: PMT = photomultiplier tube; AAV = adeno-associated virus; EF1α = elongation factor-1alpha; FLEX = flip-excision; VGlut2 = vesicular glutamate transporter 2; CFP = cyan fluorescent protein. Please click here to view a larger version of this figure.
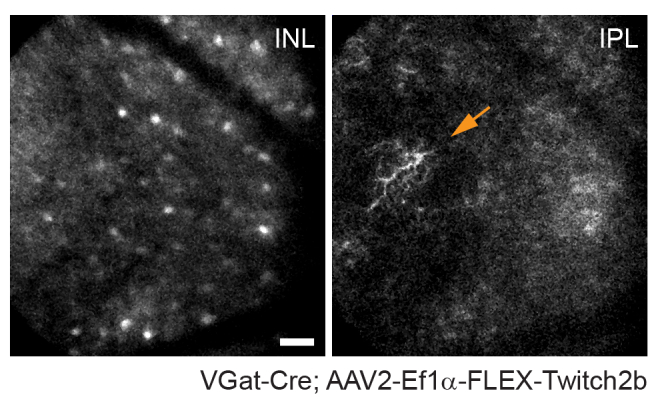
Figure 4: Imaging amacrine cells. Amacrine cells were labeled by injecting AAV-EF1α-FLEX-Twitch2b into VGat-Cre transgenic mice. The CFP signal of Twitch 2b is specifically shown. Small maximum-intensity projections focused on the depths of the inner nuclear layer indicate amacrine cell somas, while focusing on the inner plexiform resolves amacrine cell neurites (arrow). The optic nerve head is oriented towards the right of the image. Scale bar = approximately 50 µm. Abbreviations: AAV = adeno-associated virus; EF1α = elongation factor-1alpha; FLEX = flip-excision; VGat = vesicular gamma aminobutyric acid transporter; CFP = cyan fluorescent protein; INL = inner nuclear layer; IPL = inner plexiform layer. Please click here to view a larger version of this figure.
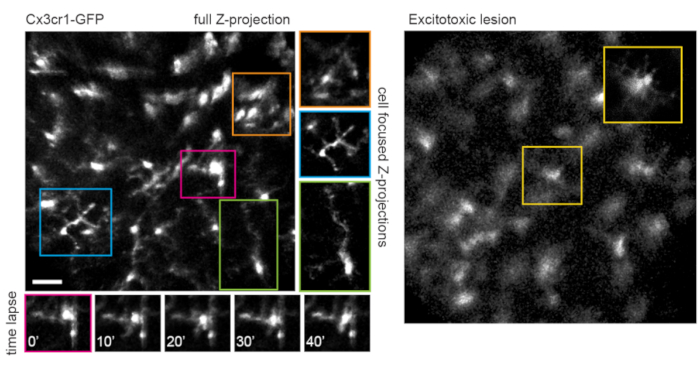
Figure 5: Imaging microglia. The transgenic mouse line Cx3cr1-GFP was used to label microglia. A maximum-intensity projection of the full scan volume shows many microglia, some with fine process detail that can be resolved. Note that cells towards the lower left of the field have less distortion in the maximum projection than those towards the upper right due to parallax in this region. Maximum-intensity projections containing only the cell of interest significantly reduces this parallax (center, boxed in corresponding colors). Furthermore, this imaging strategy can document the dynamics of fine microglia process remodeling (lower panels). Comparatively, many microglia can be seen with short processes or amoeboid morphology one day after an excitotoxic lesion by intravitreal injection of 50 mM NMDA (right). Scale bar = approximately 50 µm. Abbreviations: GFP = green fluorescent protein; Cx3cr1 = Cx3 chemokine receptor 1; NMDA = N-methyl-D-aspartate. Please click here to view a larger version of this figure.
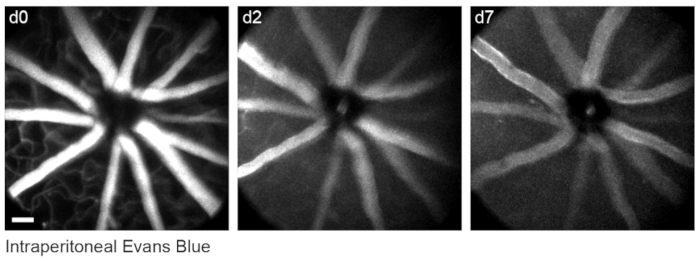
Figure 6: Labelling vascular landmarks. Mice were injected with 200 µL of 20 mg/mL Evans blue intraperitoneally 30-60 min prior to the first imaging session. Full thickness maximum-intensity projections demonstrate lasting fluorescence in the retinal vasculature that persisted for at least seven days. Scale bar = approximately 50 µm. Please click here to view a larger version of this figure.

Figure 7: Image dimensions. Retinal ganglion cells labelled by injecting AAV-EF1α-FLEX-Twitch2b into VGlut2-Cre transgenic mice were imaged in vivo, and the same region was then imaged by confocal laser scanning microscopy after fixation and wholemount preparation of the retina. Yellow fluorescent protein channel is shown for both. Colored arrow pairs indicate the same cell in both preparations (upper panels). Single-plane image of 2 µm diameter fluorescent microspheres injected intravitreally and imaged in vivo (lower left panel). Microspheres did not settle and thus were in constant motion making measurement of axial resolution impossible. Pixel sizes calculated from full-width half-maximum measurements of in vivo fluorescent microspheres or correlative confocal measurements taken from 2-4 retinas per group (lower right). Scale bar = 50 µm. Abbreviations: AAV = adeno-associated virus; EF1α = elongation factor-1alpha; FLEX = flip-excision; VGlut2 = vesicular glutamate transporter 2. Please click here to view a larger version of this figure.
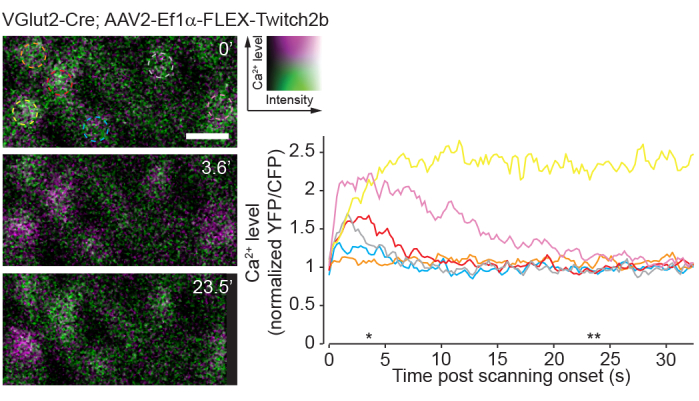
Figure 8: Calcium activity induced by two-photon scanning. Retinal ganglion cells labelled by injecting AAV-EF1α-FLEX-Twitch2b into VGlut2-Cre transgenic mice, YFP is pseudocolored magenta and CFP green, imaged in a single plane as a time series at 4.22 Hz. All RGCs had a similar starting YFP/CFP ratio. Most responded with an increase in FRET ratio (excluding the orange cell), and one maintained a high YFP/CFP ratio throughout the time series (yellow cell). YFP/CFP ratios were normalized to the first frame average, and colored circles match with colored traces. Asterisks indicate time points with representative images displayed on left. Scale bar = 20 µm. Abbreviations: AAV = adeno-associated virus; EF1α = elongation factor-1alpha; FLEX = flip-excision; VGlut2 = vesicular glutamate transporter 2; YFP = yellow fluorescent protein; CFP = cyan fluorescent protein; RGCs = retinal ganglion cells; FRET = fluorescence resonance energy transfer. Please click here to view a larger version of this figure.
Discussion
The two-photon imaging procedure described herein enables longitudinal in vivo imaging of the mouse retina. Repeatable images of the same region of retina can be obtained for a continuous period of up to 6 or more h under isoflurane. The mouse can also be imaged on different days using cellular and vascular landmarks to locate the same imaging area (Figure 3). The use of a clear gel immersion combined with cover glass for this purpose has previously been applied to a range of procedures, including visualization of retina for subretinal injection, laser-induced retinal injury models, and fundus imaging20,21,22.
The anatomy of the eye presents unique challenges to in vivo imaging, as the high optical power of the mouse cornea and lens impedes direct imaging though the pupil without correction. Several other in vivo imaging methods rely on the use of a plano-concave contact lens for correction of the anterior optics of the mouse eye7,17,18,19. With only optical correction at the cornea, the high optical power of the mouse lens results in an inevitable amount of parallax, particularly of structures in the peripheral scan field, manifesting as stretching and translational movement in the X-Y dimension at different Z-planes. To minimize image parallax-related distortion in X and Y dimensions, it is crucial that the mouse eye is oriented such that the tangent plane to the retina at the imaging area is perpendicular to the microscope light path. The setup described here is conducive to precise manipulation of the angle of the eye to achieve this alignment. An adjustable mouse head holder that permits rotation along two axes allows for easy manual adjustments of the angle of the eye as the experimenter scrolls through the Z-dimension to minimize parallax. This tilting also circumvents the field stop effect of the pupil to permit imaging greater areas of the retina. The restraint of the head holder also greatly reduces motion artifacts caused by respiration.
Care must be taken to maintain clarity of the mouse eye, as image quality will deteriorate with opacification during continuous imaging. Frequent reapplication of lubricant gel during imaging, and ointment application after each imaging session help to prevent the eye from drying and developing opacities. Some corneal opacities will spontaneously resolve after 24-48 h. The use of clear gel and cover glass as described in this protocol provides for similar image quality and aberration correction as a contact lens7, while allowing for easier adjustments of the eye angle without the need to realign the cover glass. Additionally, the gel provides continual hydration to the eye, making it possible to perform acute imaging sessions of up to several hours. Finally, since the cover glass does not contact the cornea, it causes minimal irritation to the eye that may reduce optical clarity for repeat imaging sessions.
A limitation of this approach is the fact that optical aberrations are not entirely corrected. While this severely diminishes axial resolution due to the heavy parallax, quantitative measurements of the soma can be obtained in single-image planes. It should be noted that as fluorescence signal intensity of retinal neurons is dependent on sample alignment with this method, excitation and emission ratiometric based sensors are more appropriate for experiments comparing samples chronically across different imaging sessions. An approach to correct optical aberrations at the system level is adaptive optics, which allows for subcellular resolution in the retina8,9,14,21. However, adaptive optics requires highly specialized equipment and extensive expertise to implement.
Alternative approaches to two-photon in vivo retinal imaging are confocal microscopy or ophthalmoscopy6. The approach presented here should be readily translatable to widefield or confocal microscopy. Single photon imaging is perhaps more robust and poses less risk of damaging the retina due to high energy of the two-photon laser necessary to achieve efficient two-photon effect through the cornea and lens of the eye. To avoid two-photon laser damage, the threshold for maximal laser power should be empirically determined by examining wholemount retinas after completion of imaging experiments and immunostaining for cell types in the layers imaged. In the system presented here, RGCs were labelled with the pan-RGC marker, Rbpms, and densities were normal up to 45 mW imaging power, whereas 55 mW caused a significant loss of RGCs (not shown).
A drawback of single-photon imaging is the fact that this approach will very heavily stimulate the native visual circuits of the retina compared to two-photon imaging23. Previous experiments using retinal wholemounts or eyecup preparations have shown that two-photon laser scanning elicits circuit activation that is largely transient24. Here, imaging of RGC activity with the Ca2+ sensor Twitch2b shows that the onset of laser scanning induces Ca2+ elevations, which return to baseline over the course of 5-20 s in most RGCs (Figure 8). Given that the laser power in this protocol is in the range of previous experiments reporting in vivo retinal light response8, the currently described method is likely amenable to recordings of circuit activity in the retina. Such considerations are important for experiments that may be influenced by circuit activity.
This protocol demonstrates in vivo imaging of two types of retinal neurons, RGCs and amacrine cells. Similar labeling of other major cell types can be achieved, including horizontal cells (Cx57-Cre25), bipolar cells (Chx10-Cre26; mGluR6-GFP27), cone photoreceptors (S- or M-opsin-Cre28), rod photoreceptors (Nrl-Cre29), Müller glia (Foxg1-Cre26), and pericytes (NG2-DsRed9). Transgenic mice are also available to label discrete subsets of RGCs (e.g., KCNG4-Cre for αRGCs30; OPN4-Cre for ipRGCs31; JAM-B-CreER for J-RGCs32) and amacrine cells (e.g., ChAT-Cre for starburst amacrine cells26 and neuropeptide promoter drivers for various amacrine cell subtypes 3,34). Viral vectors can be used to target specific cell populations in lieu of transgenic mice. Intravitreal injections of AAV2 with a ubiquitous CAG promoter element almost exclusively label RGCs, amacrine cells and horizontal cells25. Pairing the modified AAV2.7m8-Y444F capsid with an engineered mGluR6 promoter construct allows for broad labeling of ON bipolar cells35. Subretinal injections of AAV lead to an enrichment of photoreceptors, with serotype AAV2/5 having the highest transduction efficiency36. Shh10, a modified AAV6 capsid protein, paired with glial fibrillary acidic protein promoter elements has been demonstrated specific for Müller glia37.
The ability to observe cells in the central nervous system with a completely non-invasive approach can be used to study both basic properties of neural circuits8, as well as mechanisms of neurodegeneration3,4,5,6,38. Many blinding diseases target cellular populations in the retina, and in vivo imaging approaches in mice have been used to study optic nerve injury1,3,4, macular degeneration13, stroke5, glaucoma2,6, and uveitis7. Furthermore, many central nervous system neurodegenerative conditions manifest in the retina including Alzheimer's disease39, multiple sclerosis40, and Parkinson's disease41. Therefore, this readily accessible technique for in vivo imaging of the retina can be applied as a tool to study a broad set of neurodegenerative conditions.
Disclosures
The authors have nothing to disclose.
Acknowledgements
This work was supported by grants from the Research to Prevent Blindness Foundation (Career Development Award to P.R.W. and an unrestricted grant to the Department of Ophthalmology and Visual Sciences at Washington University School of Medicine in St. Louis), National Glaucoma Research (a program of BrightFocus Foundation), and the McDonnell Center for Cellular and Molecular Neurobiology. Z.W. is supported by an Institutional National Research Service Award T32 EY013360. This work was also supported by the Hope Center Viral Vectors Core at Washington University School of Medicine.
Materials
| Name | Company | Catalog Number | Comments |
|---|---|---|---|
| #1.5 coverslip | ThermoFisher | 152440 | Richard-Allan #1.5 24 mm x 40 mm |
| 50 mL glass syringe | Hamilton | 80950 | 22G cemented needle |
| Adeno-associated virus (AAV2) | Hope Center Viral Core | NA | |
| Anesthesia Air Pump | RWD Life Science | R510-30 | |
| Atropine | Sigma | A0132 | For pupil dilator solution |
| Basic Small Animal Anesthesia Device | RWD Life Science | R500IE | |
| Borosilicate glass capillary | Sutter | B150-86-10 | Outside diameter 1.50 mm, inside diameter 0.86 mm, length 10 cm |
| CFP/YFP filter cube | Chroma | custom | 480/40, 505 long pass, 535/30 |
| ChromoFlex - Two channel PMT detection unit | Scientifica | S-MPLG-1002 | |
| Circulating heating pump | Braintree Scientific | tp-700 | Set to 37 °C |
| Cling film | VWR | 10713-916 | |
| Compact Filter Holder | ThorLabs | DH1 | Holds coverslip over mouse eye |
| Cx3cr1-GFP transgenic mice (B6.129P2(Cg)-Cx3cr1tm1Litt/J) | The Jackson Laboratory | 005582 | |
| DAQ controller chassis | National Instruments | PXIe-1073 | |
| Data acquisition device | National Instruments | BNC-2090A | |
| Evans Blue dye | Fisher Scientific | AAA1677409 | |
| FPGA module with digitizer | National Instruments | NI-5734 | |
| Gas Evacuation Apparatus | RWD Life Science | R546W | |
| GenTeal Severe lubricant eye gel | Alcon | (from local pharmacy) | For use during imaging |
| GFP/Red filter cube | Chroma | custom | 535/30, 560 long pass, 605/70 |
| Heating pad | McKesson Medical and Surgical | 190147 | |
| HyperScope Launch Optics for use with Pockels Cell | Scientifica | S-MP-101080 | |
| HyperScope Main module | Scientifica | S-MP-100466 | |
| HyperScope Scan Path | Scientifica | S-MP-100406 | |
| HyperScope X galvo Module | Scientifica | MP-100443 | |
| ImageJ Fiji software | Freeware | ||
| Isoflurane | Patterson Veterinary | NDC 14043-704-06 | |
| Isoflurane gas filter cannister (active scavenging) | RWD Life Science | R510-31 | |
| Isoflurane gas filter cannister (passive scavenging) | RWD Life Science | R510-31S | |
| ketamine HCl (100 mg/mL) | Vedco | NDC 50989-161-06 | |
| M32 to M26 adapter | ThorLabs | M32M26S | |
| MaiTai GUI software | Spectra-Physics | NA | |
| MATLAB software | MathWorks | NA | R2015b |
| meloxicam (5 mg/mL) | Boehringer Ingelheim | NDC 0010-6013-01 | Analgesic |
| Micorscope Objective | Edmund Optics | 46-404 | Mitutoyo WE715042319 |
| micropipette puller | Sutter | Flaming/Brown Model P-97 | |
| Mineral oil | Fisher | BP2629-1 | |
| Mini bulldog hemostatic clamp | Fine Science Tools | 18053-28 | |
| Miniature EVA Tubing 0.02" ID, 0.06" OD | McMaster Carr | 1883T1 | |
| Miniature EVA Tubing 0.05" ID, 0.09" OD | McMaster Carr | 1883T4 | |
| Mouse head holder | Narishige | SGM-4 | |
| No. 5 Forceps | Fine Science Tools | 11251-10 | |
| Optic Posts 1/2" | ThorLabs | TR3-P5 | |
| Optical power meter kit | ThorLabs | PM100D | |
| pE-300 Ultra LLG Deivery | Scientifica | COO-LED3ULLGs | |
| Phenylephrine hydrochloride | Sigma | P6126 | For pupil dilator solution |
| Pockels cell | Conoptics | 350-80-02 | |
| Pockels cell amplifier | Conoptics | Model 302RM | |
| Proparacaine hydrochloride | Sigma | 1571001 | For eye immobilization |
| Red & Far Red short pass filter Cube | Chroma | custom | 560 short pass |
| Rotating 1/2" post clamp | ThorLabs | SWC | |
| ScanImage package | Vidrio Technologies | Freeware | Image acquisition software; Version 5.4.0 (2018); requires MATLAB |
| sodium chloride solution, sterile (0.9%) | Fresenius Kabi | NDC 63323-186-01 | |
| Stereomicroscope | Leica | S9 E | |
| Tabletop centrifuge | Oxford | Benchmate C8 | |
| Terramycin oxytetracycline/polymyxin B antibiotic ophthalmic ointment | Zoetisus | NA | For use after intravitreal injection |
| ThermoRack cooling system | Solid State Cooling Systems | ThermoRack 401 | Set to 20 °C |
| Ultrafast Ti:Sapphire laser | Spectra-Physics | Mai Tai DeepSee | |
| Vgat-Cre transgenic mice (Slc32a1tm2(cre)Lowl/J) | The Jackson Laboratory | 016962 | |
| VGlut2-Cre transgenic mice (Slc17a6tm2(cre)Lowl/J) | The Jackson Laboratory | 016963 | |
| VivoScope for In Vivo Imaging | Scientifica | S-MPVS-1200-00P | |
| White petrolatum-mineral oil lubricant eye ointment | Stye | NA | For use after imaging |
| xylazine HCl (20 mg/mL) | Akorn | NDC 59399-110-20 |
References
- Smith, C. A., Chauhan, B. C. In vivo imaging of adeno-associated viral vector labelled retinal ganglion cells. Scientific Reports. 8 (1), 1490(2018).
- Liu, H., Ding, C. Establishment of an experimental glaucoma animal model: A comparison of microbead injection with or without hydroxypropyl methylcellulose. Experimental and Therapeutic Medicine. 14 (3), 1953-1960 (2017).
- Chauhan, B. C., et al. Longitudinal in vivo imaging of retinal ganglion cells and retinal thickness changes following optic nerve injury in mice. PLoS One. 7 (6), 40352(2012).
- Leung, C. K., et al. Longitudinal profile of retinal ganglion cell damage after optic nerve crush with blue-light confocal scanning laser ophthalmoscopy. Investigative Ophthalmology & Visual Science. 49 (11), 4898-4902 (2008).
- Murata, H., et al. Imaging mouse retinal ganglion cells and their loss in vivo by a fundus camera in the normal and ischemia-reperfusion model. Investigative Ophthalmology & Visual Science. 49 (12), 5546-5552 (2008).
- Bosco, A., Romero, C. O., Ambati, B. K., Vetter, M. L. In vivo dynamics of retinal microglial activation during neurodegeneration: confocal ophthalmoscopic imaging and cell morphometry in mouse glaucoma. Journal of Visualized Experiments. (99), e52731(2015).
- Bremer, D., et al. Longitudinal Intravital Imaging of the Retina Reveals Long-term Dynamics of Immune Infiltration and Its Effects on the Glial Network in Experimental Autoimmune Uveoretinitis, without Evident Signs of Neuronal Dysfunction in the Ganglion Cell Layer. Frontiers in Immunology. 7, 642(2016).
- Qin, Z., et al. Adaptive optics two-photon microscopy enables near-diffraction-limited and functional retinal imaging in vivo. Light: Science & Applications. 9, 79(2020).
- Schallek, J., Geng, Y., Nguyen, H., Williams, D. R. Morphology and topography of retinal pericytes in the living mouse retina using in vivo adaptive optics imaging and ex vivo characterization. Investigative Ophthalmology & Visual Science. 54 (13), 8237-8250 (2013).
- Williams, D. R. Imaging single cells in the living retina. Vision Research. 51 (13), 1379-1396 (2011).
- Carroll, J., Neitz, M., Hofer, H., Neitz, J., Williams, D. R. Functional photoreceptor loss revealed with adaptive optics: an alternate cause of color blindness. Proceedings of the National Academy of Sciences of the United States of America. 101 (22), 8461-8466 (2004).
- Rossi, E. A., et al. Imaging retinal mosaics in the living eye. Eye. 25 (3), 301-308 (2011).
- Rossi, E. A., et al. In vivo imaging of retinal pigment epithelium cells in age related macular degeneration. Biomedical Optics Express. 4 (11), 2527-2539 (2013).
- Geng, Y., et al. Adaptive optics retinal imaging in the living mouse eye. Biomedical Optics Express. 3 (4), 715-734 (2012).
- Thestrup, T., et al. Optimized ratiometric calcium sensors for functional in vivo imaging of neurons and T lymphocytes. Nature Methods. 11 (2), 175-182 (2014).
- Takeda, A., et al. Microglia mediate non-cell-autonomous cell death of retinal ganglion cells. Glia. 66 (11), 2366-2384 (2018).
- Ikeda, W., Nakatani, T., Uemura, A. Cataract-preventing contact lens for in vivo imaging of mouse retina. Biotechniques. 65 (2), 101-104 (2018).
- Palczewska, G., Kern, T. S., Palczewski, K. Noninvasive two-photon microscopy imaging of mouse retina and retinal pigment epithelium. Retinal Degeneration. Methods in Molecular Biology. Weber, B. H. F., Langmann, T. 1834, Humana. New York, NY, USA. 333-343 (2019).
- Wahl, D. J., Jian, Y., Bonora, S., Zawadzki, R. J., Sarunic, M. V. Wavefront sensorless adaptive optics fluorescence biomicroscope for in vivo retinal imaging in mice. Biomedical Optics Express. 7 (1), 1-12 (2016).
- Park, S. W., Kim, J. H., Park, W. J., Kim, J. H. Limbal approach-subretinal injection of viral vectors for gene therapy in mice retinal pigment epithelium. Journal of Visualized Experiments. (102), e53030(2015).
- Biss, D. P., et al. In vivo fluorescent imaging of the mouse retina using adaptive optics. Optics Letters. 32 (6), 659-661 (2007).
- Shah, R. S., Soetikno, B. T., Lajko, M., Fawzi, A. A. A mouse model for laser-induced choroidal neovascularization. Journal of Visualized Experiments. (106), e53502(2015).
- Palczewska, G., et al. Human infrared vision is triggered by two-photon chromophore isomerization. Proceedings of the National Academy of Sciences of the United States of America. 111 (50), 5445-5454 (2014).
- Euler, T., et al. Eyecup scope--optical recordings of light stimulus-evoked fluorescence signals in the retina. Pflügers Archive-European Journal of Physiology. 457 (6), 1393-1414 (2009).
- Zhang, Y., et al. Elevating Growth Factor Responsiveness and Axon Regeneration by Modulating Presynaptic Inputs. Neuron. 103 (1), 39-51 (2019).
- Ivanova, E., Hwang, G. S., Pan, Z. H. Characterization of transgenic mouse lines expressing Cre recombinase in the retina. Neuroscience. 165 (1), 233-243 (2010).
- Morgan, J. L., Dhingra, A., Vardi, N., Wong, R. O. Axons and dendrites originate from neuroepithelial-like processes of retinal bipolar cells. Nature Neuroscience. 9 (1), 85-92 (2006).
- Akimoto, M., et al. Transgenic mice expressing Cre-recombinase specifically in M- or S-cone photoreceptors. Investigative Ophthalmology & Visual Science. 45 (1), 42-47 (2004).
- Brightman, D. S., Razafsky, D., Potter, C., Hodzic, D., Chen, S. Nrl-Cre transgenic mouse mediates loxP recombination in developing rod photoreceptors. Genesis. 54 (3), 129-135 (2016).
- Duan, X., et al. Subtype-specific regeneration of retinal ganglion cells following axotomy: effects of osteopontin and mTOR signaling. Neuron. 85 (6), 1244-1256 (2015).
- Ecker, J. L., et al. Melanopsin-expressing retinal ganglion-cell photoreceptors: cellular diversity and role in pattern vision. Neuron. 67 (1), 49-60 (2010).
- Kim, I. J., Zhang, Y., Yamagata, M., Meister, M., Sanes, J. R. Molecular identification of a retinal cell type that responds to upward motion. Nature. 452 (7186), 478-482 (2008).
- Akrouh, A., Kerschensteiner, D. Morphology and function of three VIP-expressing amacrine cell types in the mouse retina. Journal of Neurophysiology. 114 (4), 2431-2438 (2015).
- Zhu, Y., Xu, J., Hauswirth, W. W., DeVries, S. H. Genetically targeted binary labeling of retinal neurons. Journal of Neuroscience. 34 (23), 7845-7861 (2014).
- Lu, Q., et al. AAV-mediated transduction and targeting of retinal bipolar cells with improved mGluR6 promoters in rodents and primates. Gene Therapy. 23 (8-9), 680-689 (2016).
- Surace, E. M., Auricchio, A. Versatility of AAV vectors for retinal gene transfer. Vision Research. 48 (3), 353-359 (2008).
- Yao, K., et al. Wnt regulates proliferation and neurogenic potential of Muller glial cells via a Lin28/let-7 miRNA-dependent pathway in adult mammalian retinas. Cell Reports. 17 (1), 165-178 (2016).
- Williams, P. R., et al. A recoverable state of axon injury persists for hours after spinal cord contusion in vivo. Nature Communications. 5, 5683(2014).
- Cheung, C. Y., et al. Microvascular network alterations in the retina of patients with Alzheimer's disease. Alzheimer's & Dementia. 10 (2), 135-142 (2014).
- Kerrison, J. B., Flynn, T., Green, W. R. Retinal pathologic changes in multiple sclerosis. Retina. 14 (5), 445-451 (1994).
- Sung, M. S., et al. Inner retinal thinning as a biomarker for cognitive impairment in de novo Parkinson's disease. Scientific Reports. 9 (1), 11832(2019).
Reprints and Permissions
