This article presents and describes an outpatient treatment for prostate cancer using focal laser ablation. Laser catheter placement is guided by MRI-ultrasound fusion imaging in a fashion similar to prostate needle biopsy. Treatment is monitored in real-time with a thermal probe, placed adjacent to the laser fiber.
Method Article
Focal Laser Ablation of Prostate Cancer: An Office Procedure
In This Article
Summary
Abstract
In this article, we describe and illustrate an outpatient procedure for focal laser ablation (FLA) of prostate cancer (PCa). The procedure is conceptually similar to a fusion biopsy and is performed under local anesthesia in a clinic setting; treatment time is usually less than one hour. Laser insertion is guided by ultrasound; lesion targeting is via magnetic resonance imaging-ultrasound (MRI/US) fusion, as in targeted prostate biopsy. Real-time ablation monitoring is achieved utilizing a thermal probe adjacent to the laser fiber. The video demonstrates procedure planning, patient preparation, various steps during the procedure, and treatment monitoring. Safety, feasibility, and efficacy of this approach have been established during a previous trial. Outpatient FLA under local anesthesia is an option for management of intermediate risk prostate cancer.
Introduction
Prostate cancer (PCa) is the most common internal malignancy in U.S. men1. Approximately 190,000 new cases and 33,000 deaths are expected during 2020, making it the second most common cause of cancer death in men2. Most cases of PCa are curable if treated while localized to the prostate. However, identifying cancer within the prostate is often not possible with conventional ultrasound (US) imaging; thus, treatment has traditionally involved surgery or radiation of the whole gland. The 'whole-gland' paradigm has been altered with the introduction of magnetic resonance imaging (MRI), which, in contrast to US, enables localization of PCa and targeted biopsy3,4,5,6. While MRI likely underestimates the multifocality of PCa7, and may miss small lesions8, it can reliably identify the index lesion, which is almost always the driver of metastatic disease9, 10.
Reliable MRI identification of index lesions has provided a path for focal treatment of PCa (i.e., partial gland ablation (PGA)). The aim of PGA is to destroy the index lesion while preserving the organ and thus minimizing side effects. Focal laser ablation (FLA), which employs light energy to destroy tissue through coagulative necrosis11, 12, is one form of PGA. The effectiveness of laser energy to ablate prostate tissue was established in 199313, suggesting the placement of laser fibers into prostate cancers for that purpose. Using MRI for guidance of fiber placement and MRI thermography for treatment monitoring (i.e., in-bore treatment), near-term success rates of FLA appear to approach those of surgery or radiation5, 6, 12, 14,15,16,17,18,19. However, laser procedures performed in-bore, or within an MRI tube, are often cumbersome, expensive, time-consuming, and resource-intensive. And in-bore procedures are only performed by sub-specialty trained radiologists.
As an alternative to in-bore FLA, the feasibility of performing FLA in a clinic setting---using MRI/US fusion for guidance and an interstitial temperature probe for treatment monitoring--- has been under study at UCLA since 201419, 20. The FLA procedure in a clinic setting has proven to be similar to that of targeted biopsy, substituting a laser fiber for a biopsy needle. In comparison with HIFU and cryotherapy, which are the other currently available methods of PGA, the laser method described here is quick and inexpensive, without need for an operating room or general anesthesia.
This article aims to describe and demonstrate outpatient FLA under local anesthesia in a urology clinic. Urologists who are familiar with MRI/US fusion for targeted biopsy will appreciate the similarities of FLA to the biopsy procedure. Secondary objectives include describing technical elements that facilitate ease of use and describing benefits of focal therapy.
Protocol
NOTE: The methods described here are those used at UCLA for performing FLA of the prostate. The research project, including the protocol, were approved by the UCLA institutional review board (IRB). All patients have had targeted biopsy of the prostate, in which the MRI has been interpreted by an experienced uro-radiologist. Lesions visible on MRI were biopsied within the region of interest (ROI) and outside the ROI using a systematic template. The positive biopsies and MRI region of interest are used to plan treatment with laser ablation in order to treat the index lesion and create a margin of treated tissue around the tumor, given that MRI underestimates the size of the tumor.21 Only patients with intermediate risk prostate cancer (GG2-3 PSA < 20, Stage < T2), a single index ROI and no contralateral clinically significant prostate cancer are considered eligible for treatment. Patients with bleeding diathesis or inability to tolerate treatment without sedation are considered ineligible.
1. Treatment Planning
- Prior to treatment, plan ablations targets using input from the MRI and biopsy coordinates.
- Perform treatment planning with the provided software.
2. Procedural Room Preparation
- Display a laser warning sign outside of the procedure room.
- Position the workstation for comfortable access.
- Power on the workstation, fusion device and transrectal ultrasound.
- Enter login credential and select the desired patient from the default work list containing unexecuted plans.
NOTE: New treatment plans can be added via a USB or internet connection as detailed in the user manual. - Hang a bag of saline from the designated hook on the workstation; a waste saline return bag is also attached.
- Prime the saline tubing by allowing gravity flow of fluid prior to locking the tubing. The saline is then connected to the peristaltic pump and hung for later use during the procedure.
3. TRUS probe preparation
- Apply ultrasound jelly directly to a clean TRUS probe.
NOTE: At UCLA, all TRUS probes are disinfected via an automated system with vaporized hydrogen peroxide solution. - Fit a condom over the ultrasound jelly onto the TRUS probe and secure it at the base using a rubber band.
NOTE: Per standard practice attempt to remove air bubbles trapped under the condom. - Place a multi-channel guide over the condom and lock it in place using the metal clamp. A second condom with internal ultrasound jelly can be placed over the multi-channel guide to augment patient comfort.
4. Patient preparation
- Direct the patient to cleanse their rectal vault with and enema on the morning of the biopsy.
- Ensure that the patient has obtained prophylactic antibiotics 60 minutes prior to the procedure22.
NOTE: At UCLA, 1 g of Ertapenem is administered intramuscularly 60 minutes prior to the procedure. This decision was made based on the UCLA antibiogram and had prevented post-biopsy septic episodes over the last 1500 transrectal biopsies.23 Given this success, we elected to also use it for transrectal laser ablation. - Provide patients with Acetaminophen 1000 mg PO, Ketorolac 30 mg IM, and optionally but recommended Diazepam 10 mg PO, 60 minutes prior to the procedure.
NOTE: Patients may experience a moderate desire to void or pressure in the penis during the procedure. In our experience, no narcotics are beneficial. - Patients may find it useful to bring personal music and headphones as an additional anxiolytic.
- Place the patient in the left lateral decubitus position as for transrectal biopsy.
- Record patient vital signs prior to beginning the procedure and at 30-minute intervals.
5. Administration of prostatic nerve block
- Insert the lubricated TRUS probe until the center of the prostate is clearly visible.
- Optimize the ultrasound gain, time gain compensation (TGC sliders on the right of most ultrasounds), depth and focus so that the prostate is centered within the ultrasound viewing monitor.
NOTE: The optimal gain results in a medium-gray image within the peripheral zone. The TGC sliders are best set at a gradually sloping angle to compensate for wave attenuation of distant tissues. The ultrasound depth and focus will depend on prostate size. The focus should be set to the peripheral zone to optimize visualization of acoustic markers on the laser catheter. - Activate the on-screen biopsy guide and place a 22 gauge spinal needle through the center of the multichannel guide to anesthetize the prostate.
NOTE: At UCLA we anesthetize the prostate in the sagittal plane by placing 10-20 mL of Lidocaine/Marcaine at the junction of the prostate and seminal vesicles. Correct infiltration will cause a separation of the seminal vesicles and prostate from the rectal wall.
6. MRI-US fusion
- Position the imaging fusion system and workstation close enough to the patient in order to visualize the workstation screens while also observing the patient.
- If using the Artemis, use a technique for docking and image registration previously described.24
7. Target acquisition
- Navigate the ultrasound to the center of the first ablation site using digital targets supplied by the fusion device. This process is similar to guiding the ultrasound to a MRI region of interest during fusion biopsy.
NOTE: Each ablation site is determined from the MRI region of interest and positive biopsy cores (Figure 1). The patient's treatment plan should be transferred to the workstation and fusion device during procedure room preparation described above. - Select the current ablation zone.
8. Placement of laser catheter and temperature probe
- Place the 14-gauge laser catheter into the center chamber of the multichannel guide.
NOTE: The multichannel guide is curved to provide slight friction thus preventing treatment elements from slipping backwards during ablation. Overcome this friction by rotating back and forth while advancing the laser catheter into the prostate. - Advance the laser catheter until four echogenic bands are visualized and aligned with the on-screen depth marker. For a peripheral zone ablation, the markers will be several mm outside the prostate capsule (Figure 2).
NOTE: In the case of a fibrous posterior capsule, the laser catheter may deflect rather than traversing the prostate capsule. Any deflection will be visible on the ultrasound during the insertion. Should deflection occur, remove the laser catheter and insert a leader, such as the sturdy thermal probe, to create a pilot opening in the capsule. The laser catheter can then be advanced as planned. - Insert the thermal probe to the left or right of the laser catheter depending on the treatment plan. At the correct depth, the thermal probe interlocks with the laser catheter handle, allowing it align in the correct orientation.
NOTE: After placement, check that the slot on the thermal probe seated into the handle of the laser catheter. The thermal probe will magnetically lock in place and prevent rotation during treatment. - Connect primed intravenous tubing from the saline bag to the proximal inflow port on the laser catheter.
- Connect the returning saline from the distal outflow port to a clear drainage bag so that returning fluid can be visualized.
NOTE: Circulating saline around the laser catheter will cool the fiber during treatment
9. Perform the Safety Checklist
- While on the treatment monitoring screen, select the desired ablation site. Once the appropriate ablation is selected, press 'CONFIRM SELECTION.' A safety checklist will now occupy the left side of the workstation monitor.
NOTE: This step will begin circulating saline through the laser catheter. Small bubbles introduced when connecting the intravenous tubes are initially visible on ultrasound around the laser. This can act as an additional check for the laser catheter position. - Follow the safety checklist, ticking off the boxes once complete.
- Ensure that all individuals in the room don laser safety goggles including the patient.
- The workstation computer system will automatically check the thermal probe to ensure that all thermocouples are reading uniform body temperatures between 30 - 40 °C.
- Confirm that the laser catheters' four echogenic bands are located at the prostate capsule, as placement of the thermal probe may push the prostate away from the laser catheter.
NOTE: The ablation zone begins 5 mm distal to the echogenic markers and extends another 27 mm in length and 18 mm in diameter (maximal).
10. Performing the Laser Tissue Ablation
- Once the safety checklist is complete press 'START LASER' to begin the ablation.
- Monitor treatment progress in real-time using temperature readings, timer, and damage map.
NOTE: Evaluate tissue temperature utilizing the multi-line graph to the left of the prostate model. The rectal temperature is marked in white and should not exceed 42 °C. Temperature at the tip of the laser catheter is marked in blue (Figure 3). The laser will automatically shut off if the laser tip exceeds 75 °C or the rectal wall exceeds 42°C.
NOTE: Once the laser is active, monitor treatment time at each ablation site using the red bar at the top of the screen. A damage map gives a 3D representation of treated tissue based on temperature and time.
NOTE: Note changes on B-mode ultrasound. Prostate tissue usually does not change in appearance during laser ablation. With serial treatments the tissue may take on a hypoechoic appearance, but US visualization primarily serves for positioning of the laser.
NOTE: Monitor for concerning ultrasound features as follows:- Swirling micro bubbles forming beyond the echogenic laser catheter bands may indicate a leak in circulating saline due to super-heating. While this has no safety impact, treatment progress may be slowed.
- An increase in hyperechoic nature or 'whitening' of the rectal fat may occur if the laser catheter is inadvertently pulled back, causing heating of the perirectal fat.
- If either of these ultrasound findings are observed laser treatment should be stopped.
- The laser automatically stops once the timer runs out, but a practitioner can elect to end the ablation manually by pressing 'STOP THE LASER.' Saline will continue to flow, cooling the laser tip.
NOTE: Consider stopping the ablation early if temperatures plateau above 55 °C for greater than 60 seconds. - Keep the laser catheter and thermal probe in place until the temperature of the laser catheter has dropped below 42 °C, thus preventing rectal wall heating during withdrawal of the laser catheter.
11. Subsequent ablations
- Position the ultrasound at the next ablation site using the digital targets supplied by the fusion device.
- Assess whether the live ultrasound images remain registered to the prostate MRI, and perform a motion compensation if needed.
NOTE: If using the Artemis, the technique for motion compensation is described in the previously referenced video.24 - On the treatment monitoring screen, the initial ablation site will now be greyed out; however it can be treated again if deemed necessary.
- Select the next ablation site from the left side of the screen and repeat the process described in steps 8 - 10.
12. Conclude Treatment Session
- Once all ablation sites have been treated, a 'FINISH TREATMENT' button will appear. Pressing this button will display a treatment review screen that displays quantitative metrics for the treatment session.
- Remove the TRUS probe from the patient's rectum. Manual pressure may be applied to the rectal wall overlying the prostate to facilitate hemostasis.
Results
The published results of FLA are shown in Table 2. A variety of methods and technologies are included. More than 400 patients who have undergone various forms of FLA for treatment of PCa are found within the SEER database.25 To quantify the number and characteristics of FLA reported in the literature we performed a systematic review of Medline and the Cochrane Library. Our search was performed using whole-field search terms including "focal laser ablation" and "prostate cancer." In total, 247 titles and abstracts were reviewed. Only cases reporting focal laser ablation, MRI, and oncologic outcomes were included. 13 peer-reviewed publications qualified for inclusion, representing 333 total patients (Table 1).
Treatment was performed with a 980 nm diode laser in all but 2 studies.26, 27 Treatment parameters consisted of power levels between 6 - 18 Watts and treatment times spanning 1 - 4 minutes per ablation site (Table 1). Treatment temperature monitoring was supplied by MRI thermometry in 9 studies and by direct temperature probe measurements in 3 studies (Table 1). All studies were performed in-bore, except those by Lindner and the later study by Natarajan.20, 26, 27
Median baseline PSA for the cohort was 5.7 (range 1.1 - 14.8). Following FLA, median PSA at 3, 6, 12 and 24 months was 3.9, 5.5, 3.8, and 3.9 respectively. Median baseline IPSS for the cohort was 6. Following FLA, median IPSS at 3, 6, 12 and 24 months was 5, 5.5, 7.3 and 11.5 respectively. Median baseline SHIM for the cohort was 20. Following FLA, median SHIM at 3, 6, 12 and 24 months was 19, 18, 20, and 19 respectively.
Across all studies, complications were inconsistently reported; however there was only one complication classified by the authors as Grade III (a urinary tract infection).16 The authors did not specify the features that classified this as a grade III event. Two recto-urethral fistulas, both closing spontaneously after prolonged catheterization,16 were reported as grade II adverse events.
Oncologic follow up was grouped by follow-up period: less than 6 months, one year, and two years (Table 2). Follow up biopsy was performed by MRI guided in-bore biopsy in 4 studies, and MRI-US fusion biopsy in 6 studies. Two studies utilized systematic biopsy and two studies performed 'treat-and-resect' investigations where the prostatectomy specimen was evaluated. Treatment success was defined according to a Delphi consensus protocol.28 In-field success was defined as the absence of ≥ GG2 PCa within the prior ablation site. Out of field failure was defines as ≥ GG2 outside the area of prior ablation. Among patients with follow up biopsy results, overall in-field success following treatment at 6 months (N=83), 1 year (N=64) and 2 years (N=39) was 83%, 83%, and 59% respectively (Table 2).
At UCLA, FLA of the prostate has been performed in three successive clinical trials starting in 2014.29-31 18 men with intermediate risk prostate cancer have undergone FLA, eight in-bore and 10 in clinic, without any grade III adverse events. Currently, an additional 10 men are undergoing FLA using the demonstrated device.31 All patients were evaluated before FLA with a 3T MRI (body coil), and MRI-US fusion biopsy with sampling from the ROI and systematic biopsy within 6 months of treatment. Both baseline and follow up biopsies were performed under MRI/US fusion guidance using the Artemis fusion system with tracking of all biopsy sites.
Table 1. Reported studies of focal laser ablation.
| Reference Number | Author | Year | N | Median Age (Range) | Laser Power | Rx Time (sec) | Planned Margin | In-Bore Procedure | Temperature Monitoring | Baseline Gleason | ||||
| 3+3 | 3+4 | 4+3 | 4+4 | |||||||||||
| 26 | Lindner | 2009 | 12 | 56.5 (51-52) | - | 120 | - | No | Temperature probe | 12 | 0 | 0 | 0 | |
| 27 | Lindner | 2010 | 4 | 66 (61-73) | - | 120 | - | No | Temperature probe | 2 | 0 | 1 | 1 | |
| 5 | Oto | 2013 | 9 | 61 (52-77) | 6 - 15 W | - | - | Yes | MRI Thermometry | 8 | 1 | 0 | 0 | |
| 12 | Lee | 2014 | 23 | - | 8 W | 30-60 | - | Yes | MRI Thermometry | - | - | - | - | |
| 6 | Lepor | 2015 | 25 | 66 (49-84) | - | - | - | Yes | MRI Thermometry | 11 | 13 | 1 | 0 | |
| 18 | Al Barqawi | 2015 | 7 | 61 (56-69) | - | 90 | - | Yes | MRI Thermometry | 7 | 0 | 0 | 0 | |
| 15 | Bomers | 2016 | 5 | 66 (58-70) | - | - | 9 mm | Yes | MRI Thermometry | 2 | 2 | 1 | 0 | |
| 14 | Eggener | 2016 | 27 | 62 (-) | 6 - 15 W | 60-120 | 0 -7.5mm | Yes | MRI Thermometry | 23 | 3 | 1 | 0 | |
| 19 | Natarajan | 2016 | 8 | 63 (54-72) | 11 - 14 W | 180 | Custom* | Yes | Temperature probe # | 1 | 7 | 0 | 0 | |
| 20 | Natarajan | 2017 | 10 | 65 (52-74) | 13.75 W | 180 | Custom* | No | Temperature probe | 2 | 8 | 0 | 0 | |
| 35 | Chao | 2018 | 34 | 69 (52-88) | - | - | - | Yes | MRI Thermometry | 16 | 16 | 2 | 0 | |
| 17 | Al Hakeem | 2019 | 49 | 63 (51-73) | 10 - 15 W | 120 | 9 mm | Yes | MRI Thermometry | 13 | 29 | 7 | 0 | |
| 16 | Walser | 2019 | 120 | 60 (45-86) | 17 - 18 W | 180-240 | 5 mm | Yes | MRI Thermometry | 37 | 56 | 27 | 0 | |
Table 1: Dash (-) indicates information not available within the published manuscript. * indicates each margin was planned individually. # indicates monitoring was performed with both a temperature probe and MRI thermometry.
Table 2. Outcomes of focal laser ablation.
| Reference Number | First Author | Follow Up Biopsy Method | Follow up Biopsy | ≤ 6 Months | 12 Months | 24 Months | Adverse Events | ||||||
| Success | Failure | Success | Failure | Success | Failure | I | II | III | |||||
| 26 | Lindner | MRI Guided Bx | 12 | 12 | 0 | - | - | - | - | 2 | 0 | 0 | |
| 27 | Lindner | Prostatectomy | 4 | 2 | 2 | - | - | - | - | - | - | - | |
| 5 | Oto | MRI/US Bx | 9 | 9 | 0 | - | - | - | - | 1 | 1 | 0 | |
| 12 | Lee | MRI/US Bx | 13 | - | - | 12 | 1 | - | - | - | - | - | |
| 6 | Lepor | MRI Guided Bx | 21 | 20 | 1 | - | - | - | - | 0 | 0 | 0 | |
| 18 | Al Barqawi | Systematic Bx | 5 | - | - | 5 | 00 | - | - | - | 1 | 0 | |
| 15 | Bomers | Prostatectomy | 5 | 1 | 4 | - | - | - | - | - | - | - | |
| 14 | Eggener | MRI Guided Bx # | 27 | 27 | - | 7 | 31 | - | - | 7 | 2 | 0 | |
| 19 | Natarajan | MRI/US Bx | 8 | 6 | 53 | - | - | - | - | 23 | 7 | 0 | |
| 20 | Natarajan | MRI/US Bx | 10 | 6 | 40 | - | - | - | - | 38 | 6 | 0 | |
| 35 | Chao | MRI/US Bx | 22 | - | - | - | - | 13 | 9 | - | - | - | |
| 17 | Al Hakeem | MRI/US Bx | 49 | - | - | 40 | 91 | - | - | 34 | 11 | 0 | |
| 16 | Walser | MRI Guided Bx | 44* | - | - | - | - | 26 | 18 | 8 | 8 | 1 | |
Footnotes Table 2. Success = absence of ≥ GG2 prostate cancer within the ablation zone. Failure = presence of ≥ GG2 prostate cancer: total and out-of-field (subscript number). # indicates MRI guided biopsy was used for 6 months biopsy but only systematic biopsy was used for 12-month biopsy. * indicates that only patients with a PSA reduction of < 50% and positive post ablation MRI underwent biopsy; 76 patients did not undergo biopsy.

Figure 1: Treatment Planning and Assessment, shown via overlays on transverse MRI (top row) and in 3D (bottom row). Column A shows the delineation of treatment margins, which are expanded around the cancer-positive MRI target and bounded by nearby negative systematic biopsy cores (blue). Column B shows planning of ablation locations such that the treatment margins are overlapped to prevent 'skip' areas. Column C shows perfusion-weighted imaging collected 2 hours post-treatment, demonstrating correspondence between the planned and observed ablation extent. Please click here to view a larger version of this figure.

Figure 2: Axial ultrasound with prostate outlined in gold. Corner cube reflectors (echogenic bands), indicated by dotted arrows, are etched into the laser catheter 5 mm from the diffuser (white). Temperature probe is inserted to the same depth as the laser fiber, then locked into place and remains parallel to the laser 8 mm apart, out of the US plane of view. Eight thermal sensors, which are within the probe 4 mm apart, provide temperature recordings at points from the base of the echogenic bands to the tip of the laser catheter. Temperature measurements closest to the rectal wall are provided by thermal measurements at the base of the temperature probe (positions 6-8). Please click here to view a larger version of this figure.
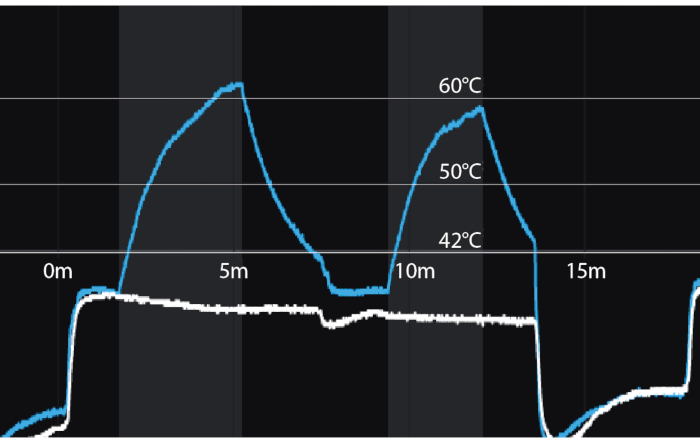
Figure 3: Temperature recordings during focal laser ablation for two successive ablations. Y-axis = temperature in Celsius. X-axis = time in minutes. Vertical shaded bars = periods of laser activation. Blue line = temperature 8mm from tip of laser fiber (distal thermocouple). White line = temperature 8 mm from proximal thermocouple nearest the rectal wall. A temperature of 60 degrees Celsius, achieved even briefly, assures coagulation necrosis. Please click here to view a larger version of this figure.
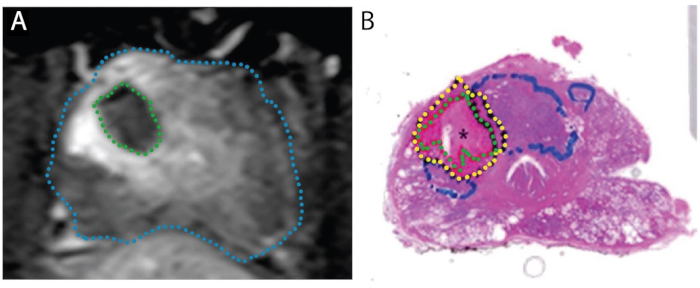
Figure 4: Images demonstrating concordance of ablation zone on post-treatment MRI (A) with actual necrotic zone on whole-mount specimen (B). Patient is 67-year-old male with PCa in right transition zone, Gleason score 3 + 4 = 7, participating in a 'treat and resect' trial. A. Post-ablation axial T1-weighted contrast-enhanced image, showing perfusion defect caused by laser treatment (green). B. Whole-mount H&E stain of the prostate. The necrotic tissue is delineated in green, the peri-necrotic tissue in yellow, and intact tumor (untreated) in blue. Reproduced under a Creative Commons license from Bomers et al, World Journal of Urology.15 Please click here to view a larger version of this figure.
Discussion
The purpose of the present work is to describe and illustrate a method for performing focal laser ablation (FLA) of prostate cancer (PCa). The method differs from other focal therapy methods, as it is intended to be performed under local anesthesia in a clinic setting. The FLA method shown here was introduced in 2017,20 and has been continuously refined since that time. Thus, the procedure described in this paper may be of value to future investigators.
Laser treatment of prostate tissue appears to date from the research of McNicholas and colleagues, working at University College London, who demonstrated in 1993 that focal coagulation necrosis could be produced in canine prostates with a Nd:YAG device.32 Foreshadowing the future, these authors postulated that the technique "…may prove of value…for the destruction of small focal prostatic tumors." Subsequently, laser ablation of PCa in man was described in 2009 by Lindner et al from the University of Toronto.26 In that pioneering effort, Lindner combined the emerging modality of prostate MRI with early image-fusion software and conventional thermal probes to successfully target cancer and monitor laser ablation in 12 men.
Since most important PCa can be visualized with contemporary multi-parametric MRI, in-bore targeting and treatment of visible lesions might be a straightforward extension of the diagnostic procedure. In-bore targeting of the lesion is direct, and MR thermometry allows remote monitoring of ablation. Raz et al reported two such treatments in 2010.33 A series of in-bore FLA treatments (N=9) was reported by Oto and colleagues in 2013.5 Adoption of in-bore FLA has been facilitated by hardware developed for that purpose, as reported by Natarajan et al in 2016.19 A number of radiologists, using a water-cooled laser fiber to prevent charring have adopted the in-bore method; and hundreds of in-bore FLA treatments have now been reported (Walser, Feller, Sperling/Lepor).6, 16, 34, 35
While short term oncologic outcomes of in-bore FLA may be favorable (Table 1), the procedure is not likely to become widely adopted, because of limiting factors described in the introduction. Moreover, MR thermometry for treatment monitoring exhibits a number of important limitations.19 Building on a decade-long experience with MRI/US fusion biopsy procedures (N~4000), we theorized that a laser fiber could be targeted into a cancer lesion, similarly to inserting a biopsy needle, and that monitoring of treatment could be accomplished directly with thermal probes. Thus, following the in-bore experience, ten patients underwent out-of-bore FLA in the UCLA urology clinic, using only local anesthesia, MRI/US fusion guidance, and thermal-probe monitoring.20 Not only was safety and feasibility of the new method demonstrated, but among the latter patients treated, no evidence of PCa could be found at subsequent biopsy.
The tissue effect of FLA has been clarified in two studies, where planned radical prostatectomy was performed 1-3 weeks after the laser procedure (N=9), i.e., a 'treat-and-resect' model (Figure 4).15, 27 In all 9 patients, the volume of necrotic tissue found in the prostate approximated the volume estimated by the MRI obtained after completion of treatment. When the whole prostates were sectioned, an abrupt transition was seen between necrosis and intact cells 1-5 mm outside of the area of laser ablation (Figure 1). The crisp margins and precision of the ablation zones have important implications for the accuracy of MRI/US registration and treatment planning.
A major part of the Avenda system is the treatment planning software. For effective FLA, the planning needs to include not only the location of the lesion, but also the volume of tissue necessary for complete tumor destruction. The ablation volume cannot simply be the MRI-lesion volume, because the actual tumor volume exceeds that of the MRI-visible lesion by an average of 3-fold.21 Moreover, cancer often extends in irregular finger-like projections, which would make unreliable any uniform safety margin based solely on imaging (e.g., 1 cm beyond boundary of MRI-visible lesion). The Avenda system includes treatment planning software that utilizes not only the MRI-visible lesion, but also 3D tracking of biopsy sites (positive and negative) to provide accurate placement of the minimal ablation volume that will fully encompass the cancer. An example of such treatment planning is seen in Figure 3.
In conclusion, FLA is a safe, feasible method for eradicating prostate cancer in a clinic setting under local anesthesia. Steps of the procedure are shown in the accompanying video. Accurate placement of the laser fiber into an MRI-visible lesion is accomplished using MRI/US fusion, much as biopsy needles are place into such lesions. Realtime treatment monitoring is accomplished via a thermal probe adjacent to the laser fiber. Treatment planning software, which employs lesion volumes from MRI and tracked biopsy site locations to help the operator determine treatment margins, is an important part of the system. In-clinic FLA as described and illustrated in this article appears to provide an attractive focal therapy option not previously available.
Disclosures
Dr. Marks and Dr. Natarajan are co-founders of Avenda Health.
Materials
| Name | Company | Catalog Number | Comments |
|---|---|---|---|
| Fusion Guidance System | NA | Artemis Displayed in Video | |
| Laser Catheter | Avenda Health | ||
| Orion Workstation | Avenda Health | ||
| Thermal Probe | Avenda Health | ||
| Transrectal Probe | NA | Not Platform Dependent | |
| Ultrasound | NA | Not Platform Dependent |
References
- Cooperberg, M. R., Carroll, P. R. Trends in management for patients with localized prostate cancer, 1990-2013. JAMA - Journal of the American Medical Association. 314 (1), 80-82 (2015).
- Siegel, R. L., Miller, K. D., Jemal, A. Cancer statistics, 2020. CA: A Cancer Journal for Clinicians. 70 (1), 7-30 (2020).
- Connor, M. J., Gorin, M. A., Ahmed, H. U., Nigam, R. Focal therapy for localized prostate cancer in the era of routine multi-parametric MRI. Prostate Cancer and Prostatic Diseases. , 1-12 (2020).
- Ahmed, H. U., et al. Focal Therapy for Localized Prostate Cancer: A Phase I/II Trial. The Journal of Urology. 185, 1246-1255 (2011).
- Oto, A., et al. MR imaging-guided focal laser ablation for prostate cancer: Phase I trial. Radiology. 267 (3), 932-940 (2013).
- Lepor, H., Llukani, E., Sperling, D., Fütterer, J. J. Complications, Recovery, and Early Functional Outcomes and Oncologic Control Following In-bore Focal Laser Ablation of Prostate Cancer. European Urology. 68 (6), 924-926 (2015).
- Johnson, D. C., et al. Detection of Individual Prostate Cancer Foci via Multiparametric Magnetic Resonance Imaging. European Urology. 75 (5), 712-720 (2019).
- Johnson, D. C., et al. Do contemporary imaging and biopsy techniques reliably identify unilateral prostate cancer? Implications for hemiablation patient selection. Cancer. 125 (17), 2955-2964 (2019).
- Liu, W., et al. Copy number analysis indicates monoclonal origin of lethal metastatic prostate cancer. Nature Medicine. 15 (5), 559-565 (2009).
- Ahmed, H. U. The Index Lesion and the Origin of Prostate Cancer. New England Journal of Medicine. 361 (17), 1704-1706 (2009).
- Stafford, R. J., et al. Magnetic resonance guided, focal laser induced interstitial thermal therapy in a canine prostate model. Journal of Urology. 184 (4), 1514-1520 (2010).
- Lee, T., Mendhiratta, N., Sperling, D., Lepor, H. Focal laser ablation for localized prostate cancer: principles, clinical trials, and our initial experience. Reviews in urology. 16 (2), 55-66 (2014).
- Johnson, D. E., Cromeens, D. M., Price, R. E. Interstitial laser prostatectomy. Lasers in Surgery and Medicine. 14 (4), 299-305 (1994).
- Eggener, S. E., Yousuf, A., Watson, S., Wang, S., Oto, A. Phase II Evaluation of Magnetic Resonance Imaging Guided Focal Laser Ablation of Prostate Cancer. Journal of Urology. 196 (6), 1670-1675 (2016).
- Bomers, J. G. R. R., et al. MRI-guided focal laser ablation for prostate cancer followed by radical prostatectomy: correlation of treatment effects with imaging. World Journal of Urology. 35 (5), 703-711 (2017).
- Walser, E., et al. Focal Laser Ablation of Prostate Cancer: Results in 120 Patients with Low- to Intermediate-Risk Disease. Journal of Vascular and Interventional Radiology. 30 (3), 401-409 (2019).
- Al-Hakeem, Y., Raz, O., Gacs, Z., Maclean, F., Varol, C. Magnetic resonance image-guided focal laser ablation in clinically localized prostate cancer: safety and efficacy. ANZ Journal of Surgery. 89 (12), 1610-1614 (2019).
- Barqawi, A., Krughoff, K., Li, H., Patel, N. U. Initial Experience of Targeted Focal Interstitial Laser Ablation of Prostate Cancer with MRI Guidance. Current Urology. 8 (4), 199-207 (2014).
- Natarajan, S., et al. Focal Laser Ablation of Prostate Cancer: Phase I Clinical Trial. Journal of Urology. 196 (1), 68-75 (2016).
- Natarajan, S., et al. Focal Laser Ablation of Prostate Cancer: Feasibility of Magnetic Resonance Imaging-Ultrasound Fusion for Guidance. Journal of Urology. 198 (4), 839-847 (2017).
- Priester, A., et al. Magnetic Resonance Imaging Underestimation of Prostate Cancer Geometry: Use of Patient Specific Molds to Correlate Images with Whole Mount Pathology. Journal of Urology. 197 (2), 320-326 (2017).
- Lightner, D. J., Wymer, K., Sanchez, J., Kavoussi, L. Best Practice Statement on Urologic Procedures and Antimicrobial Prophylaxis. Journal of Urology. 203 (2), 351-356 (2020).
- Jones, T. A., Radtke, J. P., Hadaschik, B., Marks, L. S. Optimizing safety and accuracy of prostate biopsy. Current Opinion in Urology. 26 (5), 472-480 (2016).
- Jayadevan, R., Zhou, S., Priester, A. M., Delfin, M., Marks, L. S. Use of MRI-ultrasound fusion to achieve targeted prostate biopsy. Journal of Visualized Experiments. (146), e59231(2019).
- Zheng, X., et al. Focal Laser Ablation Versus Radical Prostatectomy for Localized Prostate Cancer: Survival Outcomes From a Matched Cohort. Clinical Genitourinary Cancer. 17 (6), 464-469 (2019).
- Lindner, U., et al. Image Guided Photothermal Focal Therapy for Localized Prostate Cancer: Phase I Trial. Journal of Urology. 182, 4 SUPPL 1371-1377 (2009).
- Lindner, U., et al. Focal Laser Ablation for Prostate Cancer Followed by Radical Prostatectomy: Validation of Focal Therapy and Imaging Accuracy. European Urology. 57 (6), 1111-1114 (2010).
- van Luijtelaar, A., et al. Focal laser ablation as clinical treatment of prostate cancer: report from a Delphi consensus project. World Journal of Urology. 37, 2147-2153 (2019).
- Use of Laser Interstitial Thermal Therapy in the Focal Treatment of Localized Prostate Cancer - NCT02224911. , Available from: https://clinicaltrials.gov/ct2/show/NCT02224911 (2020).
- Focal Laser Ablation of Prostate Tissue - NCT02357121. , Available from: https://clinicaltrials.gov/ct2/show/NCT02357121 (2020).
- Focal Laser Ablation of Prostate Cancer -NCT04305925. , Available from: https://clinicaltrials.gov/ct2/show/NCT04305925 (2020).
- McNICHOLAS, T. A., STEGER, A. C., BOWN, S. G. Interstitial Laser Coagulation of the Prostate An Experimental Study. British Journal of Urology. 71 (4), 439-444 (1993).
- Raz, O., et al. Real-Time Magnetic Resonance Imaging-Guided Focal Laser Therapy in Patients with Low-Risk Prostate Cancer. European Urology. 58 (1), 173-177 (2010).
- Greenwood, B., Feller, J., Jones, W., Rob, T. Transrectally delivered, outpatient MRI-guided laser focal therapy of prostate cancer: 9.5 year interim results of NCT #02243033, Presentation at the AdMeTech 4th Global Summit on Precision Diagnosis and Treatment of Prostate Cancer. , Available from: https://www.admetech.org/wp-content/uploads/2019/08/DMI-FOCAL-Tx-2019-NCT-02243033.FINAL_.pdf (2020).
- Chao, B., Llukani, E., Lepor, H. Two-year Outcomes Following Focal Laser Ablation of Localized Prostate Cancer. European Urology Oncology. 1 (2), 129-133 (2018).
Reprints and Permissions
