The baroreflex is a heart-rate regulation mechanism by the autonomic nervous system in response to blood-pressure changes. We describe a surgical technique to implant telemetry transmitters for continuous and simultaneous measurement of electrocardiogram and blood pressure in mice. This can determine spontaneous baroreflex sensitivity, an important prognostic marker for cardiovascular disease.
Method Article
Implantation of Combined Telemetric ECG and Blood Pressure Transmitters to Determine Spontaneous Baroreflex Sensitivity in Conscious Mice
In This Article
Summary
Abstract
Blood pressure (BP) and heart rate (HR) are both controlled by the autonomic nervous system (ANS) and are closely intertwined due to reflex mechanisms. The baroreflex is a key homeostatic mechanism to counteract acute, short-term changes in arterial BP and to maintain BP in a relatively narrow physiological range. BP is sensed by baroreceptors located in the aortic arch and carotid sinus. When BP changes, signals are transmitted to the central nervous system and are then communicated to the parasympathetic and sympathetic branches of the autonomic nervous system to adjust HR. A rise in BP causes a reflex decrease in HR, a drop in BP causes a reflex increase in HR.
Baroreflex sensitivity (BRS) is the quantitative relationship between changes in arterial BP and corresponding changes in HR. Cardiovascular diseases are often associated with impaired baroreflex function. In various studies reduced BRS has been reported in e.g., heart failure, myocardial infarction, or coronary artery disease.
Determination of BRS requires information from both BP and HR, which can be recorded simultaneously using telemetric devices. The surgical procedure is described beginning with the insertion of the pressure sensor into the left carotid artery and positioning of its tip in the aortic arch to monitor arterial pressure followed by the subcutaneous placement of the transmitter and ECG electrodes. We also describe postoperative intensive care and analgesic management. After a two-week period of post-surgery recovery long-term ECG and BP recordings are performed in conscious and unrestrained mice. Finally, we include examples of high-quality recordings and the analysis of spontaneous baroreceptor sensitivity using the sequence method.
Introduction
The arterial baroreceptor reflex is the major feedback control system in humans which provides a short-term - and possibly also longer term1,2 - control of arterial blood pressure (ABP). This reflex buffers perturbations in BP that occur in response to physiological or environmental triggers. It provides prompt reflex changes in heart rate, stroke volume, and total peripheral arterial resistance. The reflex originates in sensory nerve endings in the aortic arch and carotid sinuses. These nerve terminals make up the arterial baroreceptors. The somata of nerve terminals in the aortic arch are located in the nodose ganglion while those of nerve terminals in the carotid sinus are located in the petrosal ganglion. The reflex is triggered by an increase in blood pressure, which stretches and activates the baroreceptor nerve terminals (Figure 1A). Activation results in action potential volleys which are transmitted centrally via the afferent aortic depressor and carotid sinus nerves to cardiovascular brain stem nuclei such as the nucleus tractus solitarii and the dorsal nucleus of the vagal nerve. Changes in afferent nerve activity in turn modulate the autonomic efferent activity. Increased activity of baroreceptor nerves decreases sympathetic and increases parasympathetic nerve activity. Thus, the consequences of activation of baroreceptors are a reduction in heart rate, cardiac output, and vascular resistance which together counteract and buffer the increase in blood pressure3. By contrast, decreased activity of baroreceptor nerves increases sympathetic and decreases parasympathetic nerve activity, which increases heart rate, cardiac output, and vascular resistance and thus counteract the decrease in blood pressure.
Numerous studies in humans and animals have demonstrated that the baroreceptor reflex can be adjusted under physiological conditions such as exercise4, sleep5, heat stress6, or pregnancy7. Additionally, there is evidence that the baroreflex is chronically impaired in cardiovascular diseases, such as hypertension, heart failure, myocardial infarction, and stroke. In fact, baroreflex dysfunction is also utilized as a prognostic marker in several cardiovascular diseases8,9,10. Furthermore, dysfunction of the baroreflex is also present in disorders of the ANS. Given the importance of the baroreceptor reflex for health and disease states, in vivo estimation of this reflex is an important component of autonomic and cardiovascular research with certain serious clinical implications.
Genetic mouse lines are essential tools in cardiovascular research. In vivo studies of such mouse lines provide valuable insights into cardiovascular physiology and pathophysiology and in many cases serve as preclinical model systems for cardiovascular diseases. Here we provide a protocol for telemetric in vivo ECG and BP recording in conscious, unrestrained, freely moving mice and describe how baroreflex sensitivity can be determined from these recordings using the sequence method (Figure 1B). The applied method is called the sequence method, because the beat-to-beat series of systolic BP (SBP) and RR intervals are screened for short sequences of three or more beats during spontaneous increase or decrease in SBP with reflex adaption of the HR. This method is the gold-standard for baroreflex sensitivity determination since only spontaneous reflex mechanisms are investigated. The technique is superior to older techniques that involved invasive procedures such as injection of vasoactive drugs to induce BP changes.

Figure 1: Schematic representation of the baroreflex and baroreflex sensitivity assessment using the sequence method. (A) Course of the baroreflex during an acute increase in blood pressure. A short-term rise in ABP is sensed by baroreceptors located in the aortic arch and carotid sinus. This information is transmitted to the central nervous system and induces a decrease in sympathetic nerve activity in parallel with an increase in parasympathetic activity. Release of acetylcholine from nerve endings located in the sinoatrial node region induces a decrease of the second messenger cAMP in sinoatrial node pacemaker cells and hence a reduction in heart rate. A short-term decrease in blood pressure has the opposite effect. (B) Schematic BP traces during an up sequence (upper left panel) and down sequence (upper right panel) of three consecutive beats. An up sequence is associated with a parallel increase in RR intervals (lower left panel) which is equivalent to a decrease in HR. A down sequence is associated with a parallel decrease in RR intervals (lower right panel) which is equivalent to an increase in HR. Please click here to view a larger version of this figure.
Protocol
Perform all animal studies in compliance with local institutional guidelines and national laws on animal experimentation. For this experiment, the studies were approved by the Regierung von Oberbayern and were in accordance with German laws on animal experimentation. WT animals (C57BL/6J background) and animals of a sick sinus syndrome mouse model displaying increased BRS sensitivity (Hcn4tm3(Y527F;R669E;T670A)Biel)11 (mixed C57BL/6N and 129/SvJ background) were used for this study.
1. Equipment setup
- Remove a telemetric transmitter from its sterile package and shorten the ECG leads to the length appropriate for the size of the mouse. For a 12-week-old male black six mouse (C57BL/6J), weighing ~30 g, shorten the positive lead (red) to a length of ~45 mm and the negative lead (colorless) to a length of ~40 mm using scissors.
NOTE: These values are given as orientation and must be adapted as necessary (Figure 2). - Remove approximately 6 mm of the ECG lead´s silicone tubing using a scalpel to expose the wire. Cover the tips of the wire with excessive tubing leaving a ~2 mm portion of ECG wire uncovered to record electrical signals. Secure the silicone tubing with non-absorbable 5-0 silk suture material (Figure 2A).
- Write down the transmitter serial number into the operation protocol (Supplemental File 1).
- Hydrate the transmitter in warm, sterile 0.9 % NaCl solution.
- Weigh the mouse and record its weight.
- Autoclave all surgical instruments prior to the surgery. Sterilize them during surgery and between operating different animals by dry heat using a hot glass bead sterilizer.
NOTE: Surgical instruments must cool down to room temperature before use to prevent skin burns. - Disinfect the work bench to assure aseptic conditions.
2. Surgical implantation of telemetric transmitters for combined ECG and blood pressure measurements
- Dissection of the left common carotid artery.
- Anesthetize a mouse by intraperitoneal injection of anesthesia mix (100 mg/kg ketamine; 15 mg/kg xylazine; 1 mg/kg acepromazine). Perform a toe pinch test to ensure that the mouse is fully anesthetized before commencing surgery.
- Use a trimmer to shave the surgical area from below the chin towards the transversal pectoral muscles.
- Place the mouse in a supine position on a temperature-controlled surgery plate set to 37 °C. Secure the limbs with surgical tape and continuously monitor body temperature with a rectal thermometer (Figure 2C). If body temperature drops below 37 °C cover the animal´s body with sterile cotton gauze during surgery.
- Apply eye ointment to protect the animal´s eyes during anesthesia.
- Apply depilatory cream to the previously shaved surgical area. Remove hair and depilatory cream using a cotton pad and warm water after 3-4 min. Make sure that the skin is clean and free of any residual hair and depilatory cream, so that the wound will not be contaminated during the operation.
- Disinfect the skin with several alternating rounds of povidone-iodine or chlorhexidine scrub followed by alcohol.
- Position the animal under a dissecting microscope and place a sterile drape around the surgical area.
- Make a 1-1.5 cm midline incision through the skin of the neck, starting immediately below the chin. Take effort to make the incision as straight as possible. (Figure 2D).
NOTE: During the following steps, the surgical area must be kept moist by regular application of sterile, warm (37 °C) 0.9 % NaCl. - Create a subcutaneous space at both sides of the incision by separating the skin from underlying connective tissue with blunt dissection scissors. Be careful not to pinch the skin too strongly with the forceps, as this can cause necrosis and lead to impaired wound healing after surgery.
- Separate the parotid and submandibular glands using cotton tip applicators to expose the musculature overlying the trachea.
- Retract the left salivary gland with curved dissection forceps to identify the left carotid artery located laterally to the trachea (Figure 2E).
- Carefully dissect the carotid artery from adjacent tissue using curved forceps. Be very careful not to injure the vagal nerve that is running along the vessel. Continue blunt dissection to expose the left carotid artery to about 10 mm in length and fully separate it from vascular fascia and the vagus nerve (Figure 2F).
- Pass a non-absorbable, 5-0 silk suture underneath the isolated portion of the carotid artery while slightly lifting the blood vessel with curved forceps to reduce friction between the suture and the carotid artery, as this could easily damage the vascular wall.
- Place the suture cranially, just proximally to the bifurcation of the carotid artery, form a knot and tie it to permanently ligate the vessel (Figure 2G). Fix both ends of the cranial occlusion suture to the surgery table with surgical tape.
- Pass a second occlusion suture underneath the carotid artery and place it caudally at ~5 mm distance to the cranial suture (Figure 2H). It is needed for temporary occlusion of blood flow during cannulation of the artery. Therefore, tie a loose knot and fix both suture ends with surgical tape.
- Position a third suture (secure suture) between the cranial and caudal occlusion suture and make a loose knot (Figure 2I). This suture is needed to keep the catheter in place while cannulating the artery. Tape one end of the suture to the surgery table.
- Cannulation of the left common carotid artery.
NOTE: The sensor area of the blood pressure catheter is located 4 mm from the distal end and consists of a tube containing a non-compressible fluid and a biocompatible gel (Figure 2B). Since this area is very sensitive, make sure it is free of air bubbles and do not touch it at any time during the procedure.- Bend the tip of a 24 G needle to an angle of ~100° to use it as a catheter introducer.
- Gently pull the caudal occlusion suture and fix it with tension to temporarily stop blood flow and to slightly lift the artery.
- Carefully penetrate the artery proximal to the cranial occlusion suture with the bent needle (Figure 2J). Grip the catheter with vessel cannulation forceps, introduce it into the small puncture and let it slide slowly into the vessel. Gently pull back the bent needle simultaneously (Figure 2K).
- When the catheter reaches the caudal occlusion suture slightly tighten the secure suture to keep the catheter in place (Figure 2L).
- Loosen the caudal occlusion suture so that the catheter can be further moved until its tip is positioned in the aortic arch.
NOTE: Be sure to determine the correct insertion length of the catheter, as this depends on the size of the mouse. For male mice with a C57BL/6J background at 12 weeks of age and ~30 g body weight, we recommend inserting the catheter until the integrated notch reaches the cranial occlusion suture. The correct insertion depth and placement of the catheter for the specific mouse line can be verified after euthanasia of the animal. - Once positioned properly, secure the catheter with all three sutures and cut the ends as short as possible. Do not pull the knots too tight as this could damage the fragile blood pressure catheter.
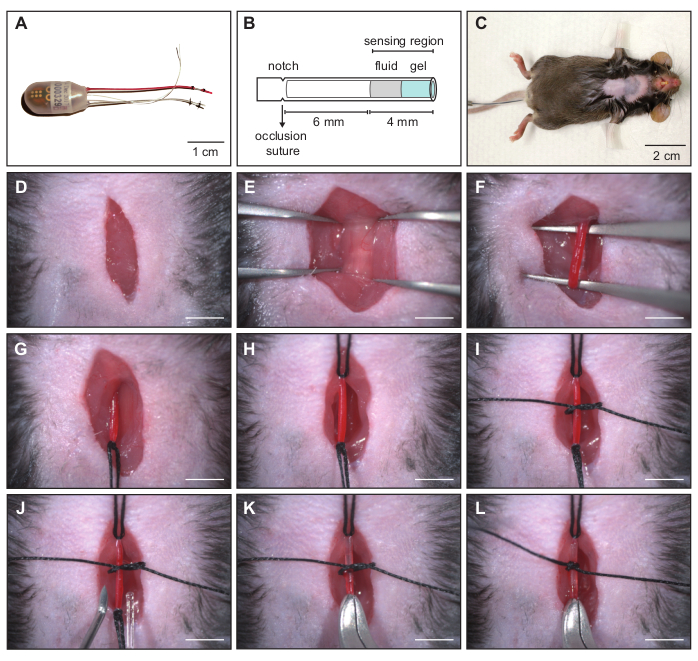
Figure 2: Implantation of a combined ECG and blood pressure transmitter - cannulation of the left carotid artery. (A) The telemetry transmitter is composed of a pressure catheter, two biopotential electrodes and the device body. (B) Schematic representation of the pressure catheter. The sensor area consists of a non-compressible fluid and a biocompatible gel. The catheter must be inserted into the carotid artery until the notch is at the level of the cranial occlusion suture to ensure proper position in the blood vessel. (C) Anesthetized C57BL/6J mouse prepared for surgical transmitter implantation. (D-L) Image sequence showing surgical procedure for cannulation of the left carotid artery. (D) Cervical skin incision. (E) Exposed trachea to identify the left carotid artery located laterally to the trachea. (F) Blunt dissection to isolate the artery from adjacent tissue and the vagus nerve. (G) Permanent ligation of the left carotid artery with cranial occlusion suture. (H) Tension applied to caudal occlusion suture to temporarily stop blood flow. (I) Secure suture to keep the catheter in place during cannulation. (J) Cannula with curved tip for insertion of the catheter into the blood vessel. (K) Pressure catheter is inserted into the carotid artery. (L) The catheter tip is positioned in the aortic arch and the catheter secured with the middle suture. Scale bar in D - L shows 4 mm. Reprinted from16. Please click here to view a larger version of this figure.
- Placement of the telemetry device body in a subcutaneous pocket on the left flank of the mouse (Figure 3).
- Form a subcutaneous tunnel from the neck directed towards the left flank of the animal and form a small pouch using small, blunt dissecting scissors (Figure 3B).
- Irrigate the tunnel with a 1 mL syringe filled with warm, sterile 0.9% NaCl solution and introduce ~300 µL of the solution into the pouch (Figure 3C).
- Carefully lift the skin with blunt forceps and introduce the transmitter device body into the pouch (Figure 3D). During this step, be very careful not to pull the blood pressure catheter out of the carotid artery.
- Placement of the ECG leads in Einthoven II configuration.
- Form a thin tunnel to the right pectoral muscle with blunt dissecting scissors and place the negative (colorless) lead into the tunnel using blunt forceps. Fix the terminal end of the lead with a stitch to the pectoral muscle using 6-0 absorbable suture material (Figure 3E).
- Form a loop in the positive (red) lead, position its tip at the left caudal rib region and secure its position with a suture using 6-0 absorbable suture material.
NOTE: It is important that both leads lie flat against the body for their whole length to avoid tissue irritation (Figure 3F). - Close the skin with single knots using 5-0 non-absorbable suture material (Figure 3H). Additionally, apply a small amount of tissue adhesive on every knot to keep the animal from biting the suture and prevent dehiscence.
- Apply povidone-iodine hydrogel 10% to the wound to prevent wound infection during the recovery phase.
- For preemptive pain relief inject 5 mg/kg carprofen in 0.9 % NaCl subcutaneously while the mouse is still under anesthesia.
- Set a heating platform to 39 ± 1 °C and place the mouse in a separate housing cage. Position one half of the cage on the platform for 12 h after surgery and transfer the mouse in the warm area. When the animal awakens from anesthesia, it has the option of staying in the warm area or moving to the cooler part of the cage.
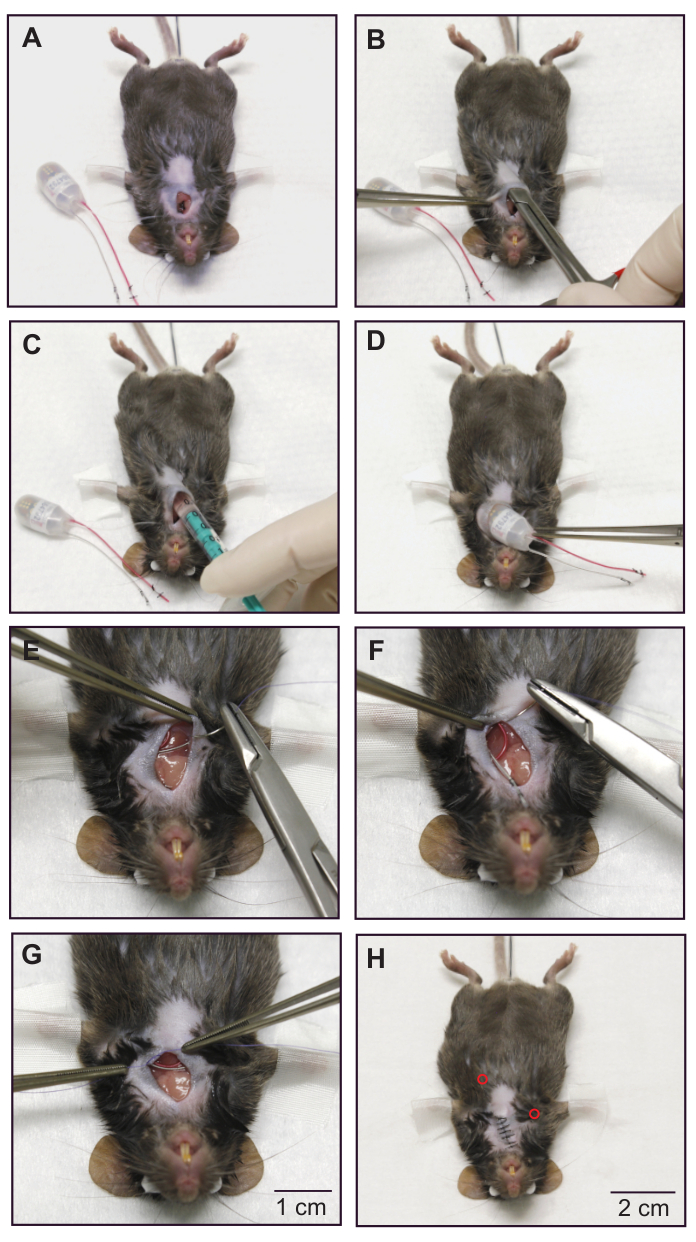
Figure 3: Implantation of a combined ECG and blood pressure transmitter - subcutaneous placement of the ECG electrodes and device body. (A) Mouse after insertion of the blood pressure catheter. Catheter position is secured by the occlusion sutures. (B) Forming a subcutaneous pocket on the left flank of the animal with blunt scissors. (C) The pouch is irrigated with ~300 μL of warm sterile saline. (D) The device body is placed in the subcutaneous pocket. (E) The terminal end of the negative electrode (colorless) is fixed to the right pectoral muscle with absorbable suture material. (F) Fixation of the positive electrode (red) to the left intercostal muscles. (G) Placement of a permanent suture on the chest muscle to secure the position of the ECG electrodes. (H) Mouse after skin closure. The subcutaneous positions of the ECG electrode tips are indicated by red circles. For demonstration purposes, a dead animal was used to take these images. Please follow sterile practices while using a live animal. Reprinted from16. Please click here to view a larger version of this figure.
- Post-operative care
- For post-operative pain relief inject 5 mg/kg carprofen in 0.9% NaCl subcutaneously every 12 h for 3-5 days until the wound has healed.
- Inject 10 µL/g of warm ringer-lactate solution intraperitoneally to protect the animal from dehydration.
- Let the mouse recover for 2-3 weeks before running the first telemetric measurements. Carefully monitor general health conditions, wound healing, body weight, and food and water intake during the recovery period.
- At the end of the experiment, euthanize the mouse by carbon dioxide (CO2) inhalation.
NOTE: Cervical dislocation or decapitation is not recommended as euthanasia method since this could damage parts of the ECG and BP transmitter device.
- Data acquisition.
- Take measures to avoid acoustic and electronic noise during data recording. Additionally, limit access of personnel during data recording and complete all husbandry procedures prior to the experiment.
- Place the animal´s cage on the telemetry receiver plate and turn on the telemetric transmitter by bringing a magnet close to the animal.
- Acquire continuous ECG, blood pressure and activity recordings over 72 h (12-h dark/light cycle) with data acquisition software (Figure 4).
- Analysis of the circadian rhythm of heart rate, blood pressure and activity.
- Check the presence of a regular circadian rhythm of HR, BP and activity using data acquisition software12 (Figure 5).
- Data analysis including determination of baroreceptor sensitivity using the sequence method with ECG and BP analysis software.
- Export BP and HR data from data acquisition software into ECG and BP analysis software (Supplemental File 2). Use the following sequence of commands: Open ECG and BP analysis software > File > Raw data from converter > Convert non-IOX raw data. In the new window click File > Load Dataquest ART4 data. Again, a new window will open, select data file for export > New window opens, select animal from "subjects" list and select ECG and BP from "waveforms list" and press OK. Choose animals from which data should be converted by clicking Convert data > Create IOX binary site file.
- Open IOX binary site file in ECG and BP analysis software by using the following sequence of commands: File > Load IOX data > Select BP and ECG trace > press the green checkmark.
NOTE: The following data processing parameters are optimized for data acquired from wildtype mice and should in principle fit all mouse models used in preclinical field. However, adaption of these parameters might be necessary when working with specific experimental models, e.g., mice with extremely high or low HR and/or BP values, or different rodent species. In any case, data processing parameters need to be carefully reviewed to assure that they fit the specific model under study. - For settings for ECG, BP and BRS analysis see Supplemental File 3,4. For BRS analysis in mice, adjust the BRS parameters to detect only sequences of three (or more) beats exhibiting a delay between SBP and RR of one beat, and set the threshold for SBP and RR change to 0.5 mmHg and 2 ms. Ensure that the correlation coefficient of the slope of the regression line from RR/SBP plots is larger than 0.75 and analyze only sections exhibiting stable sinus rhythm. Set parameters for ECG, BP and BRS analysis accordingly by using the following sequence of commands: Tune > analysis settings > new window opens
- ECG settings (right-click in the "ECG mode and signal filtering" window (Supplemental File 3)). Set the parameters as detailed here. Mode: ECG, RR-only, Filter mode: auto, according to set HR, Expected heart rate: bpm > 300, Baseline removal filter width (ms): 100.00, Noise removal filter width: 1.00 ms, Notch filter: 50.0 Hz, Spike removal filter: off, Drop-out detection mode: off, Max RR lengths (ms): 900.00, RR from adjusted R peaks: off, RR_only settings mode: Xsmall: mouse, R peak width (ms): 10.00, PR width (ms): 20.00, RT width (ms): 50.00, Max inter beat artefact (%): 50.00, R to other amplitude ratio: 3.00, R peak sign: positive, and Compute extra parameter: off
- For the blood pressure settings (BP, Pressure settings) right-click at the "BP analyzer" window (Supplemental File 4). Set the parameters as detailed here. Noise removal filter width (ms): 10.00, Derivative filter width (ms): 6.00, Notch filter: 50.0 Hz, Spike removal filter: off, Validation threshold (cal. unit): 12.00, Rejection threshold (cal. unit): 8.00, Derivative at begin upstroke (cal U/s): 10.00, Rejection limits: off, Delay from reference ecg: user defined window, Min delay from ecg Rpeak (ms): 10.00, Max delay from ecg Rpeak (ms): 250.00, Conduct_time_1 from mark: not computed, Conduct_time_2 from mark: not computed, BR (breathing rate): off, BRS (Baroreflex sensitivity): on, Minimum consecutive beat number: 3, Latency beat number: 1, Pressure value: SBP, Mark to compute pulse interval: R, Minimum pressure variation (caIU): 0.50, Minimum interval variation (ms): 2.00, Minimum correlation: 0.75
- Screen the activity signal for a 3-h sequence with low activity. Perform the BRS analysis in this time window since high activity of the animals interferes with BP and RR correlation.
- Perform a BP and RR analysis during this 3-h time window while subdividing the 3-h analysis into 10 min steps.
- Perform BRS analysis by using the following sequence of commands: Open BRS analysis window > View > BRS analysis. This opens the BRS analysis panel. Manually inspect every sequence displayed in the BRS analysis panel and exclude ectopic beats, sinus pauses, arrhythmic events or noisy data. Make sure to invalidate every single beat of such sequences to successfully exclude them from the analysis.
- Export the results of the BRS analysis into a spreadsheet file (Results File). Modify the parameters that are exported to the spreadsheet file by using the following sequence of commands (Supplemental Files 5-7):
- Tune > Parameters in list/to file > sections > txt (Supplemental File 5). Select the " beats" section and any other section containing information of interest except the invalidated beats section.
- Tune > Parameters in list/to file > steps > txt (Supplemental File 6). Choose step values to be exported.
- Tune > Parameters in list/to file > beats -> txt (Supplemental File 7).
- Make sure that the beats section of the file contains at least the following data for every single beat. ECG_RR, ECG_HR, BP_SBP, BP_BRS_deltaP, BP_BRS_# (=consecutive beat intervals of the sequence), BP_BRS_slope, BP_BRS_correl, BP_BRS_shiftl (=RR of the subsequent beat)
- Then click File > Save results file.
- Sort the exported data for up and down sequences using the filter function of Excel (Supplemental File 8). Calculate the number of sequences, mean BRS slope, standard deviation and standard error of BRS slope for up and down sequences separately. Also calculate the total amount of sequences per 1000 beats.
NOTE: A spreadsheet template (TemplateBRS) for automated sorting and analysis of up and down sequences is provided in the Supplement (Supplemental File 8) and facilitates the analysis. By adjusting the filter function, you can sort sequences by different beat numbers (e.g., three- or four-beat sequences). For further details see Supplemental files 9-13.- Open the Results File and the TemplateBRS Excel file (Supplemental File 8). Copy the data of the following columns from the Results File: (Pressure)_BRS_deltaP, (Pressure)_BRS_# and (Pressure)_BRS_slope (Supplemental File 9). Paste the data into the respective columns of the "Up sequences" and "Down sequences" spreadsheets in the TemplateBRS file (Supplemental File 10). Additionally, copy the data of the column (Pressure)_BRS_SBP from the Results File (Supplemental File 11) and paste it into the "All sequences" spreadsheet in the TemplateBRS file (Supplemental File 12).
NOTE: The number in the (Pressure)_BRS_# column is listed only at the last beat of a sequence and depicts the sequence length. Up and down sequences can be distinguished by the sign of the (Pressure)_deltaP value. Negative values for the second and third beat of a three-beat sequence indicate a down sequence. Positive values indicate an up sequence, respectively. - Filter the copied data with the default filter settings. Click on the filter icon of the (Pressure)_BRS_# column and press "ok" (Supplemental File 13). Apply this step to the "Up sequences" and "Down sequences" spreadsheets.
NOTE: The spreadsheet filters for three-beat sequences. If other sequence lengths are requested the setting of this column has to be changed in the drop-down menu. Calculations for number of sequences, mean BRS slope, standard deviation and standard error of BRS slope are displayed in the green boxes of the "Up sequences" and "Down sequences" spreadsheets. Calculations for the total number of sequences per 1000 beats appear in the green box of the "All sequences" spreadsheet.
- Open the Results File and the TemplateBRS Excel file (Supplemental File 8). Copy the data of the following columns from the Results File: (Pressure)_BRS_deltaP, (Pressure)_BRS_# and (Pressure)_BRS_slope (Supplemental File 9). Paste the data into the respective columns of the "Up sequences" and "Down sequences" spreadsheets in the TemplateBRS file (Supplemental File 10). Additionally, copy the data of the column (Pressure)_BRS_SBP from the Results File (Supplemental File 11) and paste it into the "All sequences" spreadsheet in the TemplateBRS file (Supplemental File 12).
Results
Positive results for ECG and BP raw data
Using this protocol high-quality ECG and BP data can be acquired (Figure 4 and Supplemental File 14), allowing not only for precise BRS analysis but also for analysis of a broad range of ECG or BP-derived parameters, e.g. ECG intervals (Figure 4B, upper panel), blood pressure parameters (Figure 4B, lower panel), heart rate and blood pressure variability, arrhythmia detection etc12,13,14,15.
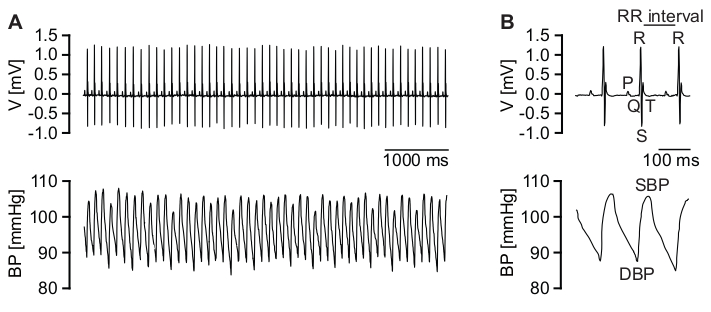
Figure 4: Telemetric ECG and BP recordings. (A) Representative, high-quality ECG trace (upper panel) and corresponding high-quality raw BP recordings (lower panel). (B) Magnification of ECG traces (upper panel). P wave, QRS complex, T wave and RR interval are indicated. Magnification of corresponding BP data (lower panel). Diastolic BP (DBP) and systolic BP (SBP) are indicated. Please click here to view a larger version of this figure.
Positive results for circadian rhythm
A healthy mouse that has sufficiently recovered from surgery shows a physiological increase of activity, HR and BP during the activity (dark) phase (Figure 5). Many different factors can disturb this regular circadian rhythm. These include psychological stress, acoustic or electric noise and pain. For example, an acute pain condition immediately after surgery would result in an increase in heart rate with a simultaneous decrease in activity. Therefore, the circadian rhythm is an important indicator for animal health and well-being and should be routinely checked before BRS analysis.

Figure 5: Analysis of long-term telemetry measurements to determine circadian rhythm variations. Circadian rhythm of heart rate (A), activity (B), systolic blood pressure (C) and diastolic blood pressure (D) averaged from 9 male wild-type C57BL/6J mice during 12 h light and dark cycles. Grey areas depict the activity (dark) phase and white areas depict the resting (light) phase of the animals. All parameters are physiologically elevated during the animal´s activity (dark) phase. Data are represented as mean +/- SEM. Please click here to view a larger version of this figure.
Positive results for BRS analysis
After performing the analysis as described in the protocol section 2.8 the software will detect up and down sequences, respectively. The method used is called sequence method since changes in SBP and RR intervals are examined on a beat-to-beat basis during short sequences of three or more beats with a spontaneous rise or fall in SBP (Figure 6). A continuous elevation in SBP over three heartbeats causes a reflex increase in parasympathetic activity and in consequence slows down HR, which is equivalent to longer RR intervals. The latency for the reflex HR adaption is one beat. Such a sequence is shown in Figure 6A and is defined as an up sequence. In contrast, a continuous decrease in SBP over three beats with parallel rise in HR (decrease in RR interval) is defined as a down sequence (Figure 6B). To evaluate the correlation between RR and SBP, both parameters are plotted against each other and the slope (ms/mmHg) of the linear regression line is calculated for each sequence (Figure 6A,B, lower panels). After sorting by up and down sequences the average number of sequences per 1000 beats (Figure 6C) and average gain of spontaneous BRS can be calculated for up and down sequences, respectively (Figure 6D,E). The gain of spontaneous BRS is reflected by the slope of the linear regression line calculated from the RR/SBP relation. The deviation from normal BRS values can have various causes. These include changes in ANS input or changes in the responsiveness of the sinoatrial node to autonomic nervous system input. In Figure 6 increased BRS in a mouse model for sick sinus syndrome (SSS) with exaggerated responsiveness of the sinoatrial node to vagal input is shown11.
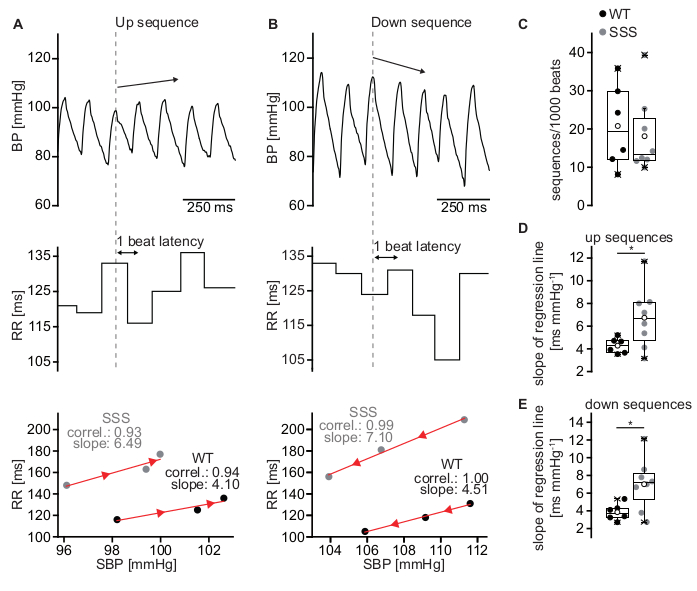
Figure 6: Estimation of BRS using the sequence method. (A) Representative BP trace of a wild-type C57BL/6J mouse during an up sequence of three consecutive beats (upper panel) associated with a parallel increase in RR interval (middle panel) which is equivalent to a decrease in HR. The RR intervals were plotted against the SBP (lower panel). The slope of the regression line (red line) for the up sequence depicted in the upper and middle panel (WT, black circles) was 4.10 ms/mmHg. A representative RR/SBP relationship of the sick sinus syndrome mouse model yielded an increased slope of 6.49 ms/mmHg indicating elevated BRS (SSS, grey circles). (B) Representative down sequence of a wild-type mouse with a drop in SBP (upper panel) and a subsequent decrease in RR interval (middle panel) which results in a BRS slope of 4.51 ms/mmHg (lower panel; WT, black circles). A representative RR/SBP relationship of the sick sinus syndrome mouse model (SSS, grey circles) with a slope of 7.10 ms/mmHg. The orientation of the red arrowheads indicates the direction of the sequences (up or down sequence). (C) Total amount of sequences per 1000 beats for WT and SSS mice. (D) Mean slope of the RR/SBP relationship for up sequences for WT and SSS mice. (E) Mean slope of the RR/SBP relationship for down sequences for WT and SSS mice. Statistics in (C-E) were performed from results of six male WT animals and eight male animals of the sick sinus syndrome mouse model. Boxplots show the median line, perc 25/75, and min/max value; open symbols represent the mean value. Please click here to view a larger version of this figure.
Negative result for raw data quality
Especially during phases of higher activity signal quality might decrease (Figure 7 and Supplemental Files 15,16). This can be caused by temporary displacement or incorrect position of either the BP catheter or ECG leads or both due to motion of the animal. Also, skeletal muscle activity might be detected from the ECG leads and induce noise (Figure 7B, upper panel). With the software settings described above, these low quality beats are not detected and are therefore excluded from analysis. Nevertheless, manual inspection of the analysed raw data is mandatory.
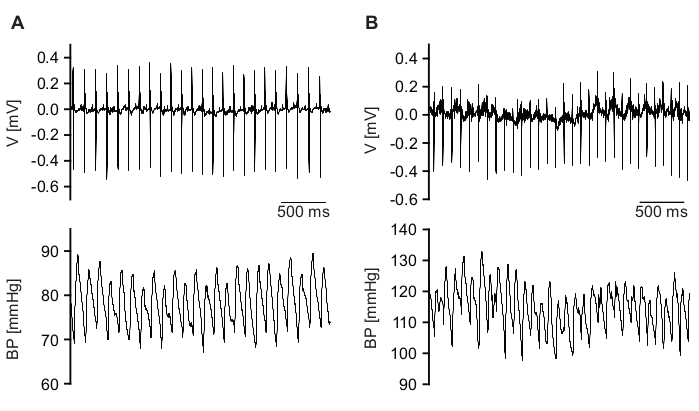
Figure 7: Examples of low-quality raw signals. (A) ECG signal (upper panel) is detected with good quality, but BP signal (lower panel) quality is low. (B) Qualities of ECG (upper panel) and BP (lower panel) signal are not sufficient. Please click here to view a larger version of this figure.
Negative results for BRS analysis
The BRS analysis settings listed in protocol section 2.8.3 are in general essential for fast and correct detection of up and down sequences. The minimum correlation coefficient for the regression line is set to 0.75. Setting too low values for the minimum correlation coefficient results in false detections of sequences that do not reflect baroreflex activity but rather result from arrhythmic beats (Figure 8). For BRS analysis only episodes with stable sinus rhythm must be analysed. Ectopic beats or other arrhythmic events, e.g., sinus pauses, can be found with the HRV option of ECG and BP analysis software and must be invalidated.
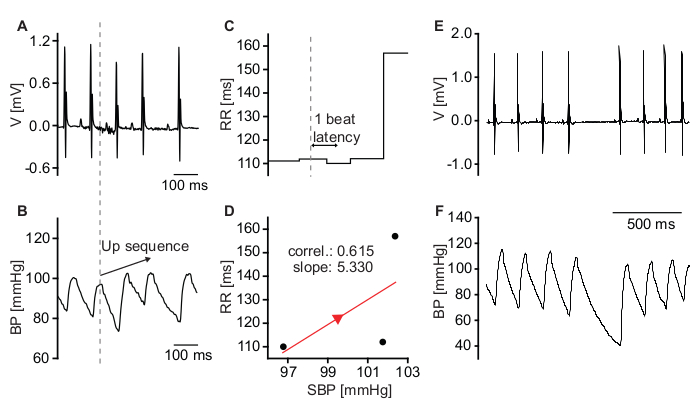
Figure 8: Sequences that do not reflect baroreflex activity. (A) ECG trace of a mouse with mild sinus dysrhythmia. (B) BP recording depicting a spontaneous increase in SBP. (C) Corresponding RR intervals indicate a decrease of HR upon the increase of BP. (D) Plot of SBP and corresponding RR intervals. The low correlation coefficient of the regression line indicates that HR reduction was not caused by activity of the baroreflex but rather by sinus dysrhythmia. (E) Raw ECG trace depicting a sinus pause. (F) Corresponding raw BP signal. The sinus pause causes a drop in diastolic blood pressure. Systolic blood pressure of the subsequent beat is almost unaffected. Please click here to view a larger version of this figure.
Supplemental File 1: Surgery protocol. Template for documentation of the surgical procedure and post-operative care. Please click here to download this File.
Supplemental File 2: Converting Dataquest A.R.T data into IOX data for analysis in ecgAUTO software. Select animals in the subjects list (left) and Pressure and ECG in the waveforms list (right). Press OK to convert data. Please click here to download this File.
Supplemental File 3: ECG settings for BRS analysis. Set parameters as listed, press ok and apply the configuration. Please click here to download this File.
Supplemental File 4: BP settings for BRS analysis. Set parameters as listed, press ok and apply the configuration. Save the configuration as a configuration file to be able to load the settings easily. Please click here to download this File.
Supplemental File 5: Parameters in list/to file window for "sections". Choose sections to be exported under the sections > txt header (selected) and press Apply!. Please click here to download this File.
Supplemental file 6: Parameters in list/to file window for "steps". Choose step data to be exported under the steps > txt header (selected) and press Apply!. Please click here to download this File.
Supplemental File 7: Parameters in list/to file window for "beats". Choose values to be exported under the beats > txt header (selected) and press Apply!. For BRS analysis the ticked parameters are necessary. Note the order of selection indicated by the numbers. Please click here to download this File.
Supplemental File 8: TemplateBRS spreadsheet file. Spreadsheet template for automated sorting and analysis of up and down sequences. Please click here to download this File.
Supplemental File 9: Copying relevant data from the Results File I. Copy the columns (Pressure)_BRS_deltaP, (Pressure)_BRS_# and (Pressure)_BRS_slope from the Results File. Please click here to download this File.
Supplemental File 10: Spreadsheet template file (TemplateBRS) for data sorting and analysis I. Paste the copied data into the respective columns of the "Up sequences" and "Down sequences" spreadsheet in the TemplateBRS spreadsheet file. Please click here to download this File.
Supplemental File 11: Copying relevant data from the Results File II. Copy the column (Pressure)_BRS_SBP from the Results File. Please click here to download this File.
Supplemental File 12: A spreadsheet template file (TemplateBRS) for data sorting and analysis II. Paste the copied SBP data into the "All sequences" spreadsheet in the TemplateBRS spreadsheet file to calculate the total number of sequences. Please click here to download this File.
Supplemental File 13: Filtering and analyzing the sequences. In the "Up sequences" spreadsheet of the TemplateBRS spreadsheet file, open the drop-down menu of the (Pressure)_BRS_# column filter and press OK without changing any parameters. This will automatically sort the data and update the calculations for sequences with 3 beats. Repeat this for the "Down sequences" spreadsheet. Please click here to download this File.
Supplemental File 14: Screenshot of a high-quality recording detected with ECG and BP analysis software. The upper trace (ECG) shows detection of each R-peak and the lower trace (BP) shows detection of each diastolic pressure (DP) and systolic pressure (SP) peak. Areas under successfully detected peaks are marked in red. Please click here to download this File.
Supplemental File 15: Screenshot of a low-quality BP recording where BP parameters are only partially detected. The upper trace (ECG) shows detection of each R-peak but the lower trace (BP) shows gaps between detected BP peaks. Detected peaks of diastolic pressure (DP) and systolic pressure (SP) are marked with red areas. Please click here to download this File.
Supplemental File 16: Screenshot of a low-quality ECG and BP recording where ECG and BP parameters could not be detected. The upper trace (ECG) shows a region (purple background) where ECG parameters could not be detected. BP detection (lower trace) also failed due to low signal quality. Please click here to download this File.
Discussion
Significance of the method with respect to alternative methods
In the present work, we present a detailed protocol to quantify spontaneous BRS using the sequence method. This approach utilizes spontaneous BP and reflex HR changes measured by ECG and BP telemetry. The advantage of this method is that both parameters can be recorded in conscious, freely moving, unrestrained animals without disturbing animals by walking into the room where the measurements are performed or even by physical interaction required for injection of drugs. This point is very important since it has been clearly shown that such disturbances severely interfere with HR and BP recordings. For example, the injection of drugs requires fixation of the mice, which causes a maximum stress response that increases HR up to 650-700 bpm. To circumvent these stress responses, BRS has been previously determined in anesthetized mice. However, standard anesthetics used in veterinary medicine such as ketamine/xylazine or isoflurane induce bradycardia and influence autonomic reflex responses, limiting the validity of these approaches and the interpretation of the results. To partially overcome these limitations implantable drug delivery devices, i.e., osmotic pumps, which can release drugs into the peritoneal cavity were used. However, with osmotic pumps it is not possible to apply a bolus of a defined dose of drug limiting the application of such devices. Alternatively, complex infusion catheters17 can be implanted into mice in order to administer drugs. However, these catheters are difficult to handle and require surgical skills comparable to those required for the implantation of telemetric devices, while producing less scientific outcome as compared to measurements of spontaneous BRS. Beside the technical issues associated with measuring BRS using injection of drugs, there are some limitations related to the drug action per se. Traditional approaches for determining BRS include bolus injections of vasoactive drugs. However, bolus injection of vasoconstrictors (e.g., phenylephrine) or vasodilators (e.g., sodium nitroprusside) have been considered an excessive and non-physiological stimulus for reflex HR adaption to changes in BP18. Spontaneous activity of the baroreceptor reflex can also be quantified using spectral methods. One of these methods assesses BRS in the frequency domain by calculation of the ratio between changes in HR and changes in blood pressure in a specific frequency band18,19. Other spectral methods involve the determination of the transfer function of BP and HR or the quantification of the coherence between BP and HR20,21. These methods also require telemetric acquisition of spontaneous BP and HR parameters and while they are appropriate for the determination of spontaneous BRS, they require intensive computational tools and are challenging to apply. Furthermore, all spectral methods suffer from the limitation that non-stationary signals preclude the application of spectral methods. In particular, spectral peaks induced by respiration rhythms can be reduced in human patients by asking the patient to stop breathing, while this is obviously not possible in mice. Therefore, the signal-to-noise ratio is frequently quite low in mice. Given the limitations of the methods discussed above, we favor the sequence method for determining BRS in mice. A considerable advantage of this method is the fact that it is a noninvasive technique that provides data on spontaneous BRS under real life conditions22. One further important point is that the duration of sequences analyzed using the sequence method are quite short, involving 3-5 beats. Reflex regulation of HR by the vagal nerve is very fast and well within the timeframe of these sequences. Therefore, the sequence method is well suited to evaluate the contribution of the vagal nerve to BRS. By contrast regulation by the sympathetic nervous system is much slower. In fact, during these short sequences activity of the sympathetic nervous system can be assumed to be almost constant. Therefore, the method is customized to selectively detect reflex changes of the HR driven by vagus nerve activity.
Interpretation of BRS data
For the interpretation of BRS dysfunction or BRS data per se it is important to consider the individual functional levels which are involved in the baroreceptor reflex. On the neuronal level, afferent, central or efferent components of the reflex might be affected23. On the cardiovascular level, reduced or exaggerated responsiveness of the sinoatrial node to ANS input might be present11,24. A change on each level could lead to changes in the BRS. In order to dissect whether neuronal and/or cardiac mechanisms are responsible for observed changes in BRS, cardiac or neuron specific gene deletion, knock down or gene editing approaches could be used.
Critical steps in the protocol
The most sophisticated and critical step in this protocol is the preparation and cannulation of the left carotid artery (Step 2.3). The tension of the caudal occlusion suture has to be sufficiently high to completely stop the blood flow before cannulation. Otherwise, even a small leakage of blood during cannulation can severely restrict visibility or even cause the mouse to bleed to death. Cannulation should be successful at the first attempt. However, upon failure of the first attempt, it is still possible to carefully retry cannulation.
The midline incision and subcutaneous tunnel from the neck to the left flank (Step 2.3) must be large enough to easily introduce the transmitter without force but must also be as small as possible to keep the transmitter in place. Otherwise, one will need to lock it into position with suture material or tissue adhesive. Since mice have a very delicate skin, necrosis of the skin can occur if the tunnel for the transmitter is too small.
If the ECG electrodes are too long to fit into the subcutaneous tunnel (Step 2.4), it is necessary to form a new tip by shortening the electrode to a proper length. The electrode must lie flat against the body over the entire length of the lead. Too long electrodes will disturb the animals and they will try to open the wound to remove the transmitter, resulting in risk of tissue irritation and wound dehiscence. Leads that are too short can of course not be extended and it may be that in this case the electrodes cannot be positioned in such a way that they correspond to Einthoven II configuration. We therefore recommend to determine the optimal length of the ECG leads on a dead mouse of the same sex, weight, and genetic background.
Mice should be given a longer recovery time after transmitter implantation if they do not have a normal circadian rhythm and this is not the phenotype of the mouse line under study (step 2.7). Another reason for disturbed circadian rhythms could be inadequate acoustic isolation of the animal facility or personnel entering the room during measurement.
ECG, BP and BRS data analysis is straight forward (Step 2.8). The most critical step is to exclude ectopic beats, sinus pauses, arrhythmic episodes or sections with low-quality signals from data analysis.
Acknowledgements
This work was supported by the German Research Foundation [FE 1929/1-1 and WA 2597/3-1]. We thank Sandra Dirschl for excellent technical assistance and Julia Rilling for veterinary advice.
Materials
| Name | Company | Catalog Number | Comments |
|---|---|---|---|
| Acepromazine maleate (Tranquisol KH) Solution Injectable 0.5 mg/mL | CP-Pharma, Germany | 1229 | anesthesia |
| B.Braun Injekt-F 1 mL syringe | Wolfram Droh GmbH, Germany | 9166017V | |
| Bepanthen eye and nose ointment | Bayer AG, Germany | ||
| Blunt dissecting scissors | Fine Science Tools GmbH, Germany | 14078-10 | |
| Carprofen (Carprosol) 50 mg/mL | CP-Pharma, Germany | 115 | preemptive and post-operative pain relief |
| Cutasept F skin desinfectant | BODE Chemie GmbH, Germany | 9803650 | |
| Cotton Tipped Applicator sterile | Paul Boettger GmbH & Co. KG, Germany | 09-119-9100 | |
| Forceps - Micro-Blunted Tips | Fine Science Tools GmbH, Germany | 11253-25 | |
| Forceps - straight | Fine Science Tools GmbH, Germany | 11008-13 | |
| Gauze swabs with cut edges, 7.5x7.5 cm, cotton | Paul Hartmann AG. Germany | 401723 | |
| HD?X11, Combined telemetric ECG and BP transmitters | Data Sciences International, United States | ||
| Homothermic blanket system with flexible probe | Harvard Apparatus, United States | ||
| Hot bead sterilizer | Fine Science Tools GmbH, Germany | 18000-45 | |
| Ketamine 10% | Ecuphar GmbH, Germany | 799-760 | anesthesia |
| Magnet | Data Sciences International, United States | transmitter turn on/off | |
| Needle holder, Olsen-Hegar with suture cutter | Fine Science Tools GmbH, Germany | 12502-12 | |
| Needle single use No. 17, 0.55 x 25 mm | Henke-Sass Wolf GmbH, Germany | 4710005525 | 24 G needle |
| Needle single use No. 20, 0.40 x 20 mm | Henke-Sass Wolf GmbH, Germany | 4710004020 | 27 G needle |
| Needle-suture combination, sterile, absorbable (6-0 USP, metric 0.7, braided) | Resorba Medical, Germany | PA10273 | lead fixation |
| Needle-suture combination, sterile, silk (5-0 USP, metric 1.5, braided) | Resorba Medical, Germany | 4023 | skin closure |
| OPMI 1FR pro, Dissecting microscope | Zeiss, Germany | ||
| Pilca depilatory mousse | Werner Schmidt Pharma GmbH, Germany | 6943151 | |
| PVP-Iodine hydrogel 10% | Ratiopharm, Germany | ||
| Ringer's lactate solution | B. Braun Melsungen AG, Germany | 401-951 | |
| Sensitive plasters, Leukosilk | BSN medical GmbH, Germany | 102100 | surgical tape |
| Sodium chloride solution 0.9% sterile Miniplasco Connect 5 ml | B. Braun Melsungen AG, Germany | ||
| Surgibond tissue adhesive | SMI, Belgium | ZG2 | |
| Suture, sterile, silk, non-needled (5-0 USP, metric 1 braided) | Resorba Medical, Germany | G2105 | lead preparation, ligation sutures |
| Trimmer, Wella Contura type 3HSG1 | Procter & Gamble | ||
| Vessel Cannulation Forceps | Fine Science Tools GmbH, Germany | 18403-11 | |
| Xylazine (Xylariem) 2% | Ecuphar GmbH, Germany | 797469 | anesthesia |
| Data acquisition and analysis | Source | ||
| DSI Data Exchange Matrix | Data Sciences International, United States | ||
| DSI Dataquest ART 4.33 | Data Sciences International, United States | data aquisition software | |
| DSI Ponemah | Data Sciences International, United States | data aquisition software | |
| DSI PhysioTel HDX-11 for mice | Data Sciences International, United States | ||
| DSI PhysioTel receivers RPC1 | Data Sciences International, United States | ||
| ecgAUTO v3.3.5.11 | EMKA Technologies | ECG and BP analysis software | |
| Microsoft Excel | Microsoft Corporation, United States |
References
- Landgren, S. On the excitation mechanism of the carotid baroceptors. Acta Physiologica Scandinavica. 26 (1), 1-34 (1952).
- Heyman, C., Neil, E. Reflexogenic areas of the cardiovascular system. British Journal of Surgery. 46 (195), J. & A. Churchill Ltd. London. 92(1958).
- Lu, Y., et al. The ion channel ASIC2 is required for baroreceptor and autonomic control of the circulation. Neuron. 64 (6), 885-897 (2009).
- Fadel, P. J., Raven, P. B. Human investigations into the arterial and cardiopulmonary baroreflexes during exercise. Experimental Physiology. 97 (1), 39-50 (2012).
- Nagura, S., Sakagami, T., Kakiichi, A., Yoshimoto, M., Miki, K. Acute shifts in baroreflex control of renal sympathetic nerve activity induced by REM sleep and grooming in rats. The Journal of Physiology. 558, Pt 3 975-983 (2004).
- Crandall, C. G., Cui, J., Wilson, T. E. Effects of heat stress on baroreflex function in humans. Acta Physiologica Scandinavica. 177 (3), 321-328 (2003).
- Crandall, M. E., Heesch, C. M. Baroreflex control of sympathetic outflow in pregnant rats: effects of captopril. The American Journal of Physiology. 258 (6), Pt 2 1417-1423 (1990).
- Mortara, A., et al. Arterial baroreflex modulation of heart rate in chronic heart failure: clinical and hemodynamic correlates and prognostic implications. Circulation. 96 (10), 3450-3458 (1997).
- La Rovere, M. T., Bigger, J. T., Marcus, F. I., Mortara, A., Schwartz, P. J. Baroreflex sensitivity and heart-rate variability in prediction of total cardiac mortality after myocardial infarction. ATRAMI (Autonomic Tone and Reflexes After Myocardial Infarction) Investigators. Lancet. 351 (9101), 478-484 (1998).
- Robinson, T. G., Dawson, S. L., Eames, P. J., Panerai, R. B., Potter, J. F. Cardiac baroreceptor sensitivity predicts long-term outcome after acute ischemic stroke. Stroke. 34 (3), 705-712 (2003).
- Fenske, S., et al. cAMP-dependent regulation of HCN4 controls the tonic entrainment process in sinoatrial node pacemaker cells. Nature Communications. 11 (1), 5555(2020).
- Fenske, S., et al. Comprehensive multilevel in vivo and in vitro analysis of heart rate fluctuations in mice by ECG telemetry and electrophysiology. Nature Protocols. 11 (1), 61-86 (2016).
- Thireau, J., Zhang, B. L., Poisson, D., Babuty, D. Heart rate variability in mice: a theoretical and practical guide. Experimental Physiology. 93 (1), 83-94 (2008).
- Cesarovic, N., Jirkof, P., Rettich, A., Arras, M. Implantation of radiotelemetry transmitters yielding data on ECG, heart rate, core body temperature and activity in free-moving laboratory Mice. Journal of Visualized Experiments. (57), e3260(2011).
- Alam, M. A., Parks, C., Mancarella, S. long-term blood pressure measurement in freely moving mice using telemetry. Journal of Visualized Experiments. (111), e53991(2016).
- Brox, V. Optical and electrophysiological approaches to examine the role of cAMP-dependent regulation of the sinoatrial pacemaker channel HCN4. Dissertation, LMU Munich. , Available from: https://edoc.ub.uni-muenchen.de/24431/1/Brox_Verena.pdf (2019).
- Just, A., Faulhaber, J., Ehmke, H. Autonomic cardiovascular control in conscious mice. American Journal of Physiology-Regulatory, Integrative and Comparative Physiology. 279 (6), 2214-2221 (2000).
- Parati, G., Di Rienzo, M., Mancia, G. How to measure baroreflex sensitivity: from the cardiovascular laboratory to daily life. Journal of Hypertension. 18 (1), 7-19 (2000).
- Robbe, H. W., et al. Assessment of baroreceptor reflex sensitivity by means of spectral analysis. Hypertension. 10 (5), 538-543 (1987).
- Pinna, G. D., Maestri, R., Raczak, G., La Rovere, M. T. Measuring baroreflex sensitivity from the gain function between arterial pressure and heart period. Clinical Science. 103 (1), 81-88 (2002).
- Pinna, G. D., Maestri, R. New criteria for estimating baroreflex sensitivity using the transfer function method. Medical and Biological Engineering and Computing. 40 (1), 79-84 (2002).
- Laude, D., Baudrie, V., Elghozi, J. L. Applicability of recent methods used to estimate spontaneous baroreflex sensitivity to resting mice. American Journal of Physiology-Regulatory, Integrative and Comparative Physiology. 294 (1), 142-150 (2008).
- Ma, X., Abboud, F. M., Chapleau, M. W. Analysis of afferent, central, and efferent components of the baroreceptor reflex in mice. American Journal of Physiology-Regulatory, Integrative and Comparative Physiology. 283 (5), 1033-1040 (2002).
- Fleming, S., et al. Impaired Baroreflex Function in Mice Overexpressing Alpha-Synuclein. Frontiers in Neurology. 4 (103), (2013).
Reprints and Permissions
