Experimental methods to harvest adult stem cells from canine intestinal and hepatic tissues to establish 3D organoid cultures are described. Furthermore, the laboratory techniques to ensure consistent growth and provide standard operating procedures to harvest, biobank, and revive canine intestinal and hepatic organoid cultures are discussed.
Method Article
Standardization and Maintenance of 3D Canine Hepatic and Intestinal Organoid Cultures for Use in Biomedical Research
In This Article
Summary
Abstract
Dogs develop complex multifactorial diseases analogous to humans, including inflammatory diseases, metabolic diseases, and cancer. Therefore, they represent relevant large animal models with the translational potential to human medicine. Organoids are 3-dimensional (3D), self-assembled structures derived from stem cells that mimic the microanatomy and physiology of their organ of origin. These translational in vitro models can be used for drug permeability and discovery applications, toxicology assessment, and to provide a mechanistic understanding of the pathophysiology of multifactorial chronic diseases. Furthermore, canine organoids can enhance the lives of companion dogs, providing input in various areas of veterinary research and facilitating personalized treatment applications in veterinary medicine. A small group of donors can create a biobank of organoid samples, reducing the need for continuous tissue harvesting, as organoid cell lines can be sub-cultured indefinitely. Herein, three protocols that focus on the culture of intestinal and hepatic canine organoids derived from adult stem cells are presented. The Canine Organoid Isolation Protocol outlines methods to process tissue and embedding of the cell isolate in a supportive matrix (solubilized extracellular membrane matrix). The Canine Organoid Maintenance Protocol describes organoid growth and maintenance, including cleaning and passaging along with appropriate timing for expansion. The Organoid Harvesting and Biobanking Protocol describes ways to extract, freeze, and preserve organoids for further analysis.
Introduction
Rodents are the most commonly utilized animal model for biomedical and translational research1. They are exceptionally useful for investigating basic molecular pathogenesis of the diseases, although their clinical relevance for chronic multifactorial diseases has recently been questioned2. The canine model exhibits several advantages in comparison to rodents3,4. Dogs and humans share similarities in metabolomics and intestinal microbiome that developed due to consumption of human diet throughout various periods of their domestication5,6,7. Similarities between canine and human gastrointestinal anatomy and physiology is another of the examples8.
Additionally, dogs often share similar environments and lifestyles with their owners9. The longer lifespan of dogs in comparison to rodents allows for the natural development of numerous chronic conditions10. Inflammatory bowel disease or metabolic syndrome are examples of multifactorial chronic diseases that share important similarities between humans and dogs11,12. Canine preclinical trials that involve dogs with naturally occurring diseases can generate more reliable data than those gained from rodent models13. However, to minimize the use of live animal research and comply with the principles of the 3Rs (Reduce, Refine, Replace)14, alternatives to in vivo testing using 3D in vitro canine organoids have emerged15.
Organoids are self-assembled 3D stem cell-derived structures that recapitulate the physiology and microanatomy of their original organs16,17. This technology was first described by Sato et al. in 200917 and allowed for more translatable in vitro studies in epithelial cell lines than were previously possible using 2D cancer cell cultures18,19,20. Organoids are useful in vitro models in many biomedical disciplines such as in preclinical toxicological21,22,23, absorption, or metabolism studies24,25,26,27,28, as well as in personalized medical approaches29,30,31. The successful culture of canine intestinal organoids has been described for the first time in 201912, while hepatic organoids derived from a dog were first reported by Nantasanti et al. in 201532. Canine organoids have since been successfully used in studies investigating canine chronic enteropathies, gastrointestinal stromal tumors, colorectal adenocarcinoma12, and Wilson's Disease33,34.
While adult stem cells can be harvested via necropsies, the organoid technology does not always require sacrificing of the animals. Endoscopic and laparoscopic biopsies, or even fine-needle aspirates of organs35, are a viable source of adult stem cells for epithelial organoid isolation12. Widespread use of such non-invasive techniques in veterinary practice facilitates options for reverse translational research (translation of information from veterinary clinical practice to human clinical practice and vice versa)15. Further advancement of organoid technology can be ensured by the standardization of organoid culture and maintenance methods. The organoid protocol presented here is partially based on previously published work of Saxena et al. from 201536, and methods were adapted to fit specifics of canine intestinal and hepatic organoid culture. The overall workflow of the canine organoid protocols is depicted in Figure 1.
Canine Organoid Isolation Protocol introduces methods of obtaining samples from endoscopic, laparoscopic,and surgical biopsies, as well as necropsies. It outlines the initial pre-treatment of tissue samples and methodologies used for transport to the laboratory. Materials and reagents needed for organoid isolation are summarized in the 'Preparation for Isolation' section. The process of adult stem cell isolation from tissue samples is further described in detail. Finally, the process of plating organoids into dome-like structures using a solubilized extracellular membrane matrix is discussed.
The second protocol, Canine Organoid Maintenance Protocol, describes methods of documenting and culturing organoids. Media changes and their frequency are discussed in this section. Furthermore, the laboratory procedures such as passaging and cleaning the cell cultures, which are essential to ensure the successful maintenance of 3D canine organoids, are described. Appropriate passaging is a critical step of the protocol, and possible adjustments and troubleshooting of this step are discussed further in the manuscript.
The last protocol is Canine Organoid Harvesting and Biobanking Protocol containing methods for preparing full-grown organoids for paraffin-embedding and RNA preservation. Methods of biobanking organoid samples in liquid nitrogen storage are also described here. Finally, the ways to thaw frozen samples and support their growth are discussed.
In conclusion, this article aims to provide consistent canine organoid culture procedures through the standardization of inter-laboratory protocols. In doing so, the manuscript aims to facilitate the reproducibility of data derived from canine organoid models to increase their relevance in translational biomedical research.
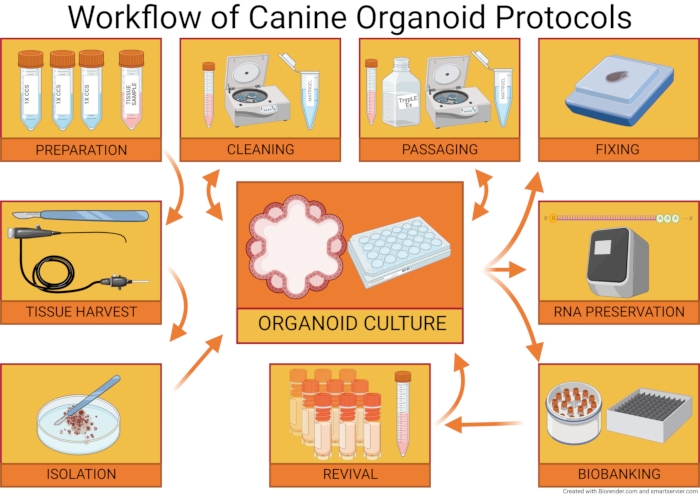
Figure 1: Workflow of canine organoid protocols. The Canine Organoid Isolation Protocol describes the preparation of the materials needed for organoid isolation, the harvesting of a tissue sample (through the means of necropsies, endoscopic, laparoscopic, and surgical biopsies), and guidance on cell dissociation and plating of the cellular population. The Canine Organoid Maintenance Protocol discusses cleaning and passaging of the organoid culture. The Organoid Harvesting and Biobanking Protocol discusses the preparation of organoid samples for paraffin-embedding and further organoid characterization. Methods to biobank organoid cultures and reviving them from storage in liquid nitrogen are also discussed. Please click here to view a larger version of this figure.
Protocol
The research was approved and performed in compliance with the Institutional Animal Care and Use Committee of Iowa State University (IACUC-19-337; IACUC-18-065; IACUC-19-017).
NOTE: The following section (steps 1-3) describes the Canine Organoid Isolation Protocol.
1. Preparation for isolation
- Transport tubes: Before organoid isolation (typically 24 h prior), fill a 50 mL conical tube with 10 mL of Dulbecco's Modified Eagle Medium/Nutrient Mixture F-12 (Advanced DMEM/F12) enriched with 0.2 mL of Pen Strep.
- For laparoscopic, incisional, or excisional biopsies, prepare three additional 50 mL conical tubes. Fill these tubes with 10 mL of complete chelating solution (1x CCS; see Table 1).
NOTE: For step 1.2, 2 mM N-Acetylcysteine (NAC) in Phosphate Buffered Saline (PBS) can also be used as a traditional solution used for stem cell harvesting. There were no differences observed when using 1x CCS or NAC in PBS. Both solutions are added to release cells in the solution. - Keep the tubes at 4 °C overnight and transport the tubes on ice for the remainder of the protocol.
- Prepare five 15 mL centrifuge tubes with 5 mL of 1x CCS, one 15 mL centrifuge tube with 3 mL of 1x CCS, one empty 15 mL centrifuge tube (supernatant tube), and one 15 mL centrifuge tube with 5 mL of 1x CCS and 2 mL of fetal bovine serum (FBS).
NOTE: The above can be prepared prior to the day of isolation if multiple samples will be processed. For illustration, see the isolation tube layout in Figure 2. - On the day of isolation, prepare a Petri dish, scalpel, ice bucket, and cold Advanced DMEM/F12 in the biosafety cabinet. Place the required number of 24-well cell culture plates in the incubator (37 °C; 5% CO2 atmosphere) to pre-warm.
- Place solubilized extracellular membrane matrix (ECM; see Table of Materials) on ice to begin thawing.
NOTE: Submersion in ice protects against rapid thawing and helps avoid solidification. A box of pipette tips can be placed in the freezer to assist in plating the solubilized ECM. - Prechill a centrifuge to 4 °C.
- Move Complete media with growth factors "CMGF+" or "organoid media" (see Table 1 for composition) from the freezer/refrigerator to a 37 °C water bath. Avoid direct light exposure when possible.
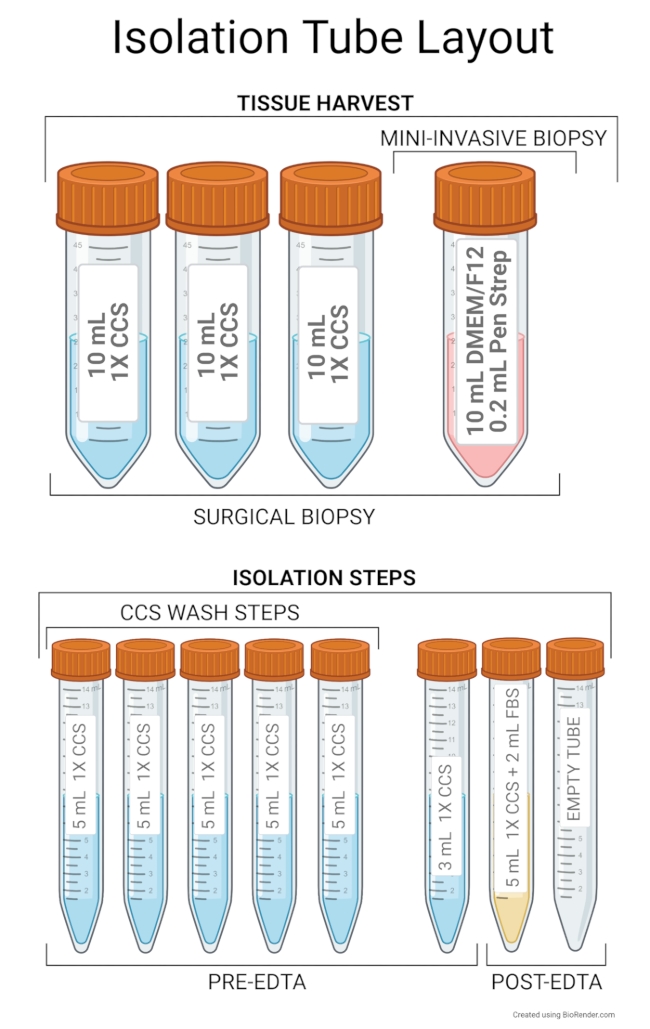
Figure 2: Isolation tube layout. Recommended setup for tissue harvesting includes 10 mL of Advanced DMEM/F12 and 0.2 mL of Pen Strep in a 50 mL centrifuge tube. Additionally, three 50 mL tubes filled with 10 mL of 1x CCS are required for surgical biopsies or necropsies. Recommended tube layout for isolation steps includes five tubes containing 5 mL of 1x CCS to be used during CCS wash steps. The first tube is used as a sample tube containing the minced tissue, and the remaining tubes serve as reservoirs of 1x CCS to be added to the first tube. The sixth tube contains 3 mL of 1x CCS for flushing the remaining tissue from the sample tube when transferring to a 6-well plate. These six tubes will be used before the EDTA incubation step. A tube with 5 mL of 1x CCS and 2 mL of FBS serves as a sample tube after EDTA incubation, and supernatant from this tube is transferred with stem cells into an empty tube for the rest of the isolation. Keep tubes at 4 °C before beginning isolation. Please click here to view a larger version of this figure.
2. Tissue harvesting
- Intestinal endoscopic, and laparoscopic biopsies (diameter 2.8 mm) can be acquired using large biopsy forceps. Harvest at least eight endoscopic samples per intestinal site.
- Collect samples directly into transport tubes and place them on ice.
- For surgical biopsies and necropsies, harvest tissue pieces with a size of 0.5 cm x 0.5 cm and place them in the first 1x CCS tube.
NOTE: For intestinal biopsies, remove any remaining intestinal content and scrape the mucosal layer with a scalpel to remove villi. If samples are plentiful, additional biopsies can be collected in cryovials containing RNA storage reagent (1 mL) or paraffin-embedded for future comparison between organoids and their tissue of origin.In the case of taking biopsies for TEM analysis, do not scrape the villi and store sample in preservative (3% paraformaldehyde and 3% glutaraldehyde in phosphate-buffered saline (PBS)) and store at 4 °C. - Shake the 1x CCS tube vigorously for ~30 s, and then transfer the sample to a new 1x CCS tube using forceps. Repeat this process twice.
- Transfer the sample from the last 1x CCS tube to the transport tube (Advanced DMEM/F12 + Pen Strep) and bring the sample back to the laboratory.
NOTE: Samples pre-treated this way can also be shipped overnight on ice (do not ship on dry ice).
3. Organoid isolation
NOTE: Perform isolation using aseptic techniques in a biosafety cabinet. See Figure 3 for canine organoid isolation workflow.
- Shake tissue sample in the transport tube for ~30 s and remove excessive supernatant until there is 0.5 mL left in the tube by slow pipetting near the fluid surface. Be sure not to discard any tissue.
- Transfer tissue and remaining supernatant to a sterile Petri dish. Using a disposable scalpel (or sterilized forceps and scissors), cut and mince the tissue into smaller pieces (size of 1 mm2) resembling a mash consistency for approximately 5 min.
- Pipet the minced tissue with liquid from the Petri dish to the first CCS tube. Add 2 mL of Advanced DMEM/F12 to the Petri dish, flush the remaining tissue, and transfer to the first CCS tube.
- Vortex the 1x CCS tube for 5 s approximately five times. Allow biopsies to settle to the bottom of the 15 mL tube (approximately 1 min) and remove the supernatant until there is 5 mL left in the tube. Transfer the 1x CCS from the new tube to the sample tube.
- Repeat the previous step for the next two tubes. On the final two washes, remove the supernatant down to 3 mL remaining in the tube.
- Transfer the biopsies and 1x CCS from the sample tube to one well of a 6-well plate. Then, add 3 mL of 1x CCS to the sample tube, gently swirl to collect any remaining tissue, and transfer to the same well of the plate.
- Add 150 µL of 0.5 M EDTA (to achieve a total volume of 6.15 mL in a well). Place the 6-well plate on a 20°, 24-rpm nutating mixer/rocker at 4 °C. Incubate the liver samples for 10 min and the intestinal samples for 1 h on the moving rocker.
- Transport the 6-well plate back to the biosafety cabinet. Transfer minced tissue and liquid to a 1x CCS/FBS tube and allow the tissues to settle. Transport the supernatant (this portion now includes free stem cells) and approximately 0.2 mL of the upper portion of the tissue to the empty tube.
- Spin down the tube containing the sample (700 x g for 5 min at 4 °C). Stem cells are now pelleted along with the minced tissue. Remove and discard the supernatant carefully to not disturb the pellet.
- Resuspend the pellet in Advanced DMEM/F12 and spin the tube again (700 x g for 5 min at 4 °C). Aspirate the supernatant and do not disturb the pellet.
- Calculate the volume of solubilized ECM needed for seeding the dissociated cells and tissue. Use 30 µL of solubilized ECM per well of a 24-well plate to achieve proper seeding density.
NOTE: Embed a sample post isolation in 4 to 6 wells of a 24-well plate (i.e., based on the amount of minced tissue in the sample). - Add the calculated volume of solubilized ECM to the sample tube and slowly pipette up and down to avoid the formation of bubbles. Seed the suspension in the middle of the wells so that the solubilized ECM can form a dome-like structure.
NOTE: Using pipette tips from a -20 °C freezer assists in plating solubilized ECM. If tissue chunks are larger than the P200 pipette tip, use wide cold tips or cut cold P1000 tips to assist in plating. Keep the sample with the solubilized ECM on ice whenever possible. - Transport the plate to an incubator (37 °C; 5% CO2 atmosphere) and allow the solubilized ECM to solidify for ~30 min.
- Mix ROCK inhibitor and GSK3β in CMGF+ (concentrations in Table 1). Add 500 µL of this solution (CMGF+ R/G) to every well. Place the plate in the incubator (37 °C; 5% CO2 atmosphere).

Figure 3: Canine organoid isolation workflow. The harvested tissue sample is transferred to a Petri dish and minced properly. The sample is then transferred to a 1x CCS tube, and wash steps are performed. For the EDTA incubation in a 6-well plate, the sample is then transferred to a tube containing 1x CCS and FBS. After the tissue settles, the supernatant with a small amount of tissue is transferred to an empty tube. The sample is consequently spun, the supernatant is removed, and the pellet is resuspended in Advanced DMEM/F12. The tube is spun again, and the supernatant is aspirated and discarded. Solubilized ECM is added to the tube, mixed, and the sample is plated in a 24-well plate. The plate is consequently incubated (37 °C; 5% CO2 atmosphere) for 30 min, and media is then added. Please click here to view a larger version of this figure.
NOTE: The following section (steps 4 and 5) describes the Canine Organoid Maintenance Protocol. Change media according to Table 2 and check the organoids daily for signs of apoptosis, contamination, overcrowding, and detachment of solubilized ECM. Daily notes must be taken according to Figure 4 to accurately monitor conditions and experimental effects on the cultures. See Supplementary Table 1 for a template allowing for accurate and reproducible organoid culture-related notetaking. For hepatic organoids, use CMGF+ enhanced with ROCK inhibitor and GSK3β.

Figure 4: Organoid sizing and density guide. (A) Organoid size chart for accurate tracking of organoid growth. The Sizing Guide includes extra-small (XS), small (S), medium (M), large (L), and extra-large (XL) categories. (B) The Density Guide consists of very low density (VLD), low density (LD), medium density (MD), high density (HD), and very high density categories (VHD). (C) Representative images of bacterial and fungal contamination of the organoid sample. (D) Representative images of organoid overcrowding and apoptosis. The objective magnification is indicated in every panel. Please click here to view a larger version of this figure.
| Media change recommendation | ||||||
| Monday | Tuesday | Wednesday | Thursday | Friday | Saturday | Sunday |
| 500 μL | N/A | 500 μL | N/A | 750 μL | N/A | N/A |
Table 2: Media change recommendation. A recommended timeline of weekly media change. Media (500 µL of CMGF+ for intestinal organoids, or 500 µL of CMGF+ R/G for hepatic organoids) is recommended to be changed every other day. To account for the extra hours on a weekend, 750 µL of media is added on Friday afternoons, with media being refreshed on Monday mornings.
4. Organoid cleaning
NOTE: Organoid cleaning or passaging must be performed regularly to upkeep the health of the organoid culture. Perform the cleaning procedure whenever apoptosis in the culture, presence of debris, overcrowding of the organoids, or detachment of solubilized ECM is noticed. Refer to Figure 4D.
- Remove the media from the wells while tilting the plate to avoid destruction of the solubilized ECM.
NOTE: If solubilized ECM detachment is considerable, it is advised to transfer the media to the 15 mL tube to avoid losing fragments of solubilized ECM containing the sample. - Add 0.5 mL of prechilled Advanced DMEM/F12 to each well to dissolve the matrix domes by repeated pipetting using a P1000 tip (avoid creating excessive bubbles). Transfer the organoid-containing dissolved matrix to a 15 mL centrifuge tube. Keep the tube on ice and if the volume is lower than 6 mL, slowly fill the tube with Advanced DMEM/F12 to reach a total volume of 6 mL.
- Spin the tube (700 x g for 5 min at 4 °C) and remove all the supernatant while making sure not to disturb the pellet.
- Add the required volume of solubilized ECM (30 µL per well to achieve proper seeding density) and slowly resuspend the pellet by pipette mixing. Plate the suspension in the middle of the 24-well plate to form a dome.
- Place the plate in an incubator (37 °C; 5% CO2 atmosphere) for ~30 min, and then add the appropriate volume of media (Table 2).
5. Organoid passaging
NOTE: Passaging is typically performed 5-7 days after initial culture to expand the organoid cell line. Organoid cultures can typically be expanded in a 1:3 ratio. Images of healthy cultures ready for passage can be seen in Figure 4. Organoids have to be at least medium in size.
- Perform steps 4.1 to 4.3.
- Remove the supernatant leaving 0.5 mL in the tube. Make sure not to disturb the pellet.
- Add 0.5 mL of trypsin-like protease (see Table of Materials), mix properly by aspirating with a pipette and incubate in the 37 °C water bath (incubate intestinal organoids for 8 min or hepatic organoids for 10 min). Continue to mix the solution by flicking the tube several times at the half-time point of the incubation.
- Move the tube containing the sample back to a biosafety cabinet and slowly add 6 mL of prechilled Advanced DMEM/F12 to inactivate trypsin-like protease and stop the dissociation of the cells.
- Spin the tube (700 x g for 5 min at 4 °C) and remove the supernatant. Make sure not to disturb the pellet.
- Perform steps 4.4. and 4.5.
NOTE: The following section (steps 6-9) describes Organoid Harvesting and Biobanking Protocol. Organoid cultures have to be free of tissue that has been removed during previous passages. Cultures should also be healthy, at least large in size, and medium to high in density. Images of healthy cultures ready for downstream applications can be seen in Figure 4. Moving downstream with preservation and harvesting of sub-optimal organoid cultures can negatively impact characterization results and the biobank's viability. Review the recommended 24-well plate layout in Figure 5.
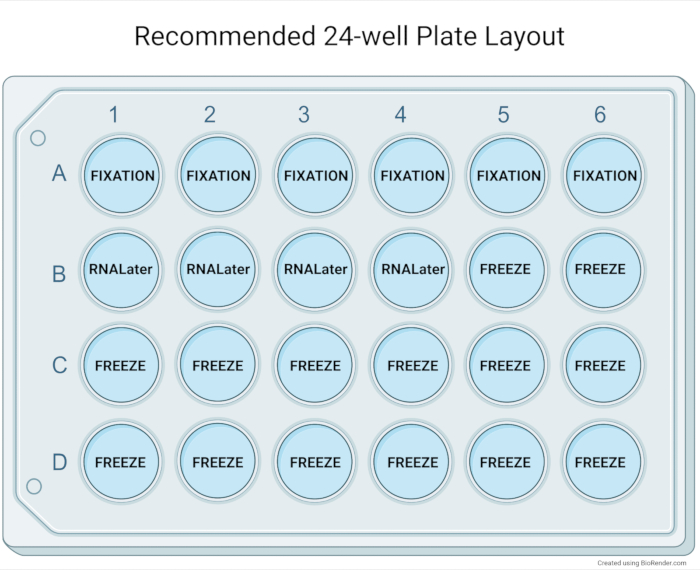
Figure 5: Recommended 24-well plate layout. The recommended layout of the 24-well plate for basic characterization after expansion of the organoid culture. Paraffin-embedding of six wells (medium to large organoids of medium to high density) will typically allow for a high concentration of organoids in a histology block. Four wells of organoids can be pooled to one cryovial with RNA storage reagent for downstream applications. Fourteen wells are used for biobanking the organoid samples and provide material for up to seven cryopreserved vials. Please click here to view a larger version of this figure.
6. Fixation of organoids
- Remove media from the well and make sure not to disturb the solubilized ECM dome.
- Add 500 µL of Formalin-Acetic Acid-Alcohol solution serving as a fixative (FAA; composition in Table 1).
- Store organoids at room temperature. After 24 h, aspirate FAA and fill the well with 70% ethanol. Wrap plates with a laboratory flexible film tape (see Table of Materials) to avoid rapid evaporation. The organoids are now ready for paraffin-embedding. The paraffin-embedding of the organoid culture is performed in traditional metal base molds.
7. RNA preservation
- Remove media from the wells and make sure not to disturb the solubilized ECM dome.
- Use 0.5 mL of prechilled Advanced DMEM/F12 per well to dissolve solubilized ECM domes by repeatedly pipetting up and down (avoid creating excessive bubbles). Transfer the organoids to a 15 mL centrifuge tube. Keep the tube on ice and if the volume is lower than 6 mL, slowly fill the tube with Advanced DMEM/F12 to reach 6 mL of total volume.
- Spin the tube (700 x g for 5 min at 4 °C) and remove all the supernatant. Make sure not to disturb the pellet.
- Add 100 µL of PBS to the sample tube and resuspend the pellet by gentle pipetting. Transfer the contents of the sample tube to a cryovial.
- Add 900 µL of RNA storage reagent (see Table of Materials) to the sample tube and mix to collect any remaining organoids. Transfer these residual organoids to the cryovial and store them at -80 °C (typically four wells pooled to one cryovial will be sufficient for downstream applications, including qPCR and RNA sequencing).
NOTE: One cryovial typically produces a total of 4,000 ng of RNA (measured via spectrophotometer analysis).
8. Organoid biobanking
NOTE: Biobanking usually occurs 3-4 days after passage. The signs of apoptosis should not be present in the culture to perform this method. Refer to Figure 4 for referencing size and density appropriate for freezing. Biobank medium to extra-large organoids at medium to very high densities. An emergency freeze step can be followed if an organoid cell line is especially rare or further viability is not guaranteed. Follow the same steps for normal organoid biobanking (steps 8.1 to 8.4). Emergency freezing is done with smaller and less dense cultures. Pool as many wells of growing organoids into one cryovial following steps 8.1 to 8.4. Keep in mind that a sufficient number of organoids must be kept alive in an attempt to expand the culture (emergency freezing is simply a backup procedure to protect against possible loss of culture via contamination or other unexpected occurrences).
- Follow steps 7.1 to 7.3.
- Add 1 mL of freezing media per cryovial (composition in Table 1) to the sample tube and gently resuspend the pellet by pipetting up and down.
- Transfer 1 mL of the solution to one cryovial (ratio of two wells/cryovial) and keep the cryovials on ice.
- Transfer the cryovials from ice to a freezing container (regularly refill the reservoir with isopropanol) and immediately transfer to -80 °C. Move the samples to liquid nitrogen (-196 °C) for long-term storage after 24 h.
NOTE: An alcohol-free cell freezing container can also be used instead of a traditional one. Make sure the samples do not thaw during transport from the -80 °C to the long-term liquid nitrogen storage. Repeated thawing decreases the viability of the cell culture.
9. Revival from liquid nitrogen storage
NOTE: When choosing to thaw an organoid line, a subset of the revived organoids must be refrozen and replaced in the biobank as quickly as possible with at least one (preferably more) cryovials.
- Place solubilized ECM on ice to slowly thaw, put a 24-well plate in the incubator (37 °C; 5% CO2 atmosphere), and prepare the required reagents such as a 15 mL tube and Advanced DMEM/F12.
- Recover a cryovial containing an organoid sample from liquid nitrogen storage and immediately transfer it to a heat bath (37 °C) for 2 min.
- Transfer contents of the cryovial to a 15 mL centrifuge tube in a biosafety cabinet. Slowly add prechilled Advanced DMEM/F12 to reach a total volume of 6 mL.
- Spin the tube (700 x g for 5 min at 4 °C). Remove the supernatant and make sure not to disturb the pellet.
- Add 180 µL (30 µL per well) of solubilized ECM to the pellet and plate this suspension in the pre-heated 24-well plate. One cryovial can be plated to six wells of a 24-well plate.
- Place the 24-well plate in the incubator (37 °C; 5% CO2 atmosphere) for ~30 min and add CMGF+ R/G (for intestinal organoids, switch to CMGF+ in 24 to 48 h).
NOTE: When a sample is plated and growing in the 24-well plate, it must be allowed to recover for at least 2 days before passaging to increase viability.
Results
The canine organoid protocol typically generates ~50,000 to ~150,000 intestinal or hepatic cells per well of a 24-well plate. Representative organoids can be seen in Figure 6.

Figure 6: Representative images of canine organoids. Images of organoids isolated using this protocol are depicted. (A,B) Intestinal organoids derived from the duodenum (taken at 10x and 5x objective magnification). Note the presence of older budded organoids and younger spheroids. (C,D) Canine enteroids from the lower portion of the jejunum (taken at 10x and 20x objective magnification). (E,F) Ileal enteroids (taken at 20x and 5x objective magnification), and (G,H) colonoids (taken at 10x objective magnification). (I) A representative image of hepatic organoids taken at 20x objective magnification. Most of the organoids are in their budding form. Younger hepatic spheroids can also be seen in the picture. (J) Representative image showing a rarehepatic organoid that forms a duct-like structure (taken at 10x objective magnification). Scale bar (500 µm) is present at the top-left corner of each image. Please click here to view a larger version of this figure.
Enteroids and colonoids derived using this protocol were characterized previously by Chandra et al. in 201912. Canine intestinal organoids are composed of a regular cellular population of the intestinal epithelium. Using RNA in situ hybridization, the expression of stem cell biomarkers (Leucine-Rich Repeat Containing G Protein-Coupled Receptor 5 - LGR5 and SRY-Box Transcription Factor 9 - SOX9), Paneth Cell Biomarker (Ephrin type-B receptor 2 - EPHB2), absorptive epithelial cell markers (Alkaline phosphatase - ALP) and enteroendocrine marker (Neurogenin-3 - Neuro G3)12 was confirmed. Alcian Blue staining was performed on paraffin-embedded slides to confirm the presence of Goblet cells. Additionally, functional assays such as optical metabolic imaging (OMI) or cystic fibrosis transmembrane conductance regulator (CFTR) swelling assay were performed to confirm the metabolic activity of the organoids. Canine organoids from dogs diagnosed with inflammatory bowel disease, gastrointestinal stromal tumors (GIST), or colorectal adenocarcinoma were also isolated using this protocol12.
After stem cell isolation, hepatic canine organoids start their life cycle as expanding spheroids, and after ~7 days, they turn into budding and differentiating organoids. Canine hepatic spheroids isolated and cultured according to this protocol were measured to quantify their growth and determine the ideal time for passage. Spheroids derived from laparoscopic hepatic biopsies of healthy adult dogs (n = 7) were measured during their first 7 days of culture. Representative images were taken, and the longitudinal (a) and diagonal (b) radius of the spheroids (n = 845) was measured throughout the culture. The volume (V), surface area (P), 2D ellipse area (A), and circumference (C) of the spheroids were calculated. The calculations and results of the experiment are summarized in Figure 7. 2D ellipse area and circumference were used to assess the organoid culture's health using light microscopy. These values can serve as a guide for culture maintenance decisions.
Briefly, spheroids rapidly expanded in volume, surface area, 2D ellipse area, and circumference. The measurement data from the seven beagles was averaged for the following calculations. The volume increased by 479% (±6%) from day 2 to 3. At the same timepoint, spheroid surface area and 2D ellipse area increased by 211% (±208%) and 209% (±198%), respectively. 2D ellipse circumference increased from day 2 to 3 by 73% (±57%). The increase in the overall volume of hepatic organoids from days 2-7 was more than 365 times, surface area and 2D ellipse area increased 49 times, and 2D ellipse circumference increased six times.
Next, spheroids derived from two adult canine samples were further grown post passage and collected every day (day 2-7) for RNA in situ hybridization (RNA ISH). Canine probes were designed (probe list is provided as Supplementary Table 2), and mRNA expression was evaluated for stem cell markers (LGR5), markers specific for cholangiocytes (cytokeratin 7 - KRT-7, and aquaporin 1 - AQP1), as well as hepatocyte markers (forkhead box protein A1 - FOXA1; and cytochrome P450 3A12 - CYP3A12). The expression of the markers was assessed in a semi-quantitative manner (representative pictures in Figure 8). Spheroids preferentially expressed the cholangiocyte marker KRT-7 ranging from 1% to 26% in signal area/total area of cells. AQP1 was not expressed in the organoid samples, arguably because its presence in canine hepatic samples is sparse. The stem cell marker expression (LGR5) ranged between 0.17% to 0.78%, while hepatocyte markers were expressed to a lower extent at 0.05%-0.34% for FOXA1 and 0.03%-0.28% for CYP3A12.
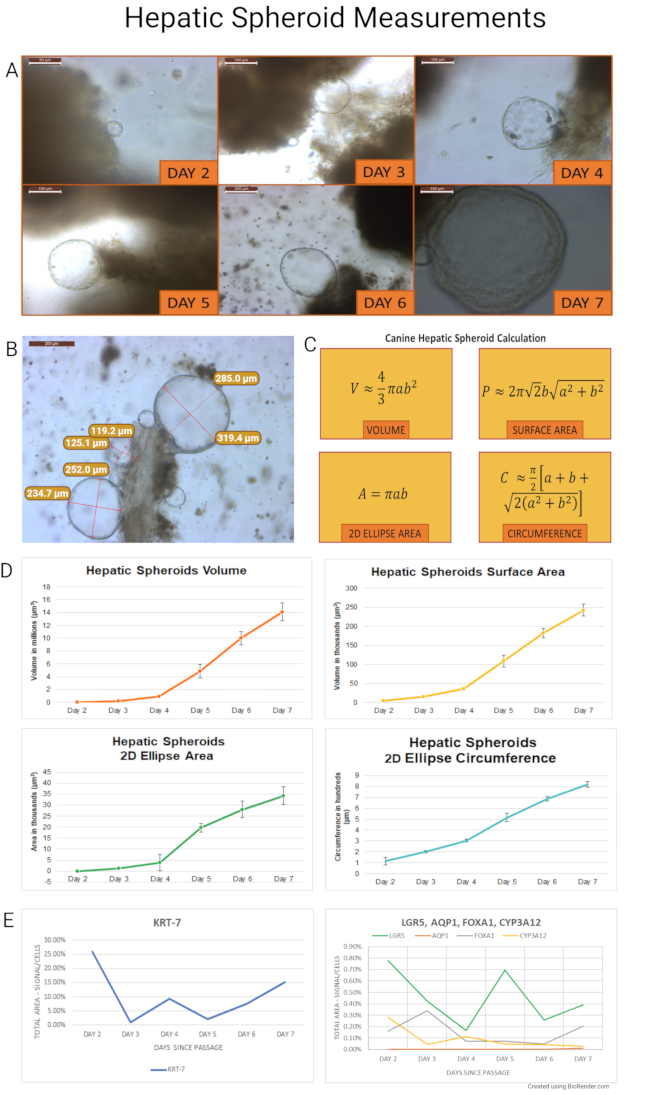
Figure 7: Hepatic spheroid measurements. (A) Hepatic spheroid growth was observed every day of cultures from day 2-7. Spheroids first formed on day 2, and the last spheroids started the budding process on day 7. A subsequent experiment used two canine organoid lines after passage to harvest spheroids every day for paraffin-embedding to perform RNA ISH (day 2 image was taken at 40x, day 6 image at 10x, and the rest of the images were taken at 20x magnification). (B) A hepatic spheroid cluster is shown attached to a tissue chunk embedded in solubilized ECM 4 days after isolation. Longitudinal and diagonal radii of the spheroids were measured (image taken at 10x). Panel (C) depicts the formula used for calculations to derive volume (V), surface area (P), 2D ellipse area (A), and circumference (C). For these calculations, it was presumed that canine hepatic spheroids are ideal spheroids. Results of measurements of hepatic spheroids' volume, surface area, 2D ellipse area, and 2D ellipse circumference for individual days of growth are depicted in panel (D). Error bars represent the standard error of the mean (SEM). (E) mRNA expression of KRT-7, LGR5, FOXA1, and CYP3A12 were measured in samples of canine hepatic spheroids after passage ofday 2 to day 7. AQP1 was not expressed in these samples. A scale bar (5x: 500 µm; 10x: 200 µm; 20x: 100 µm; 40x: 50 µm) is present at the top left of each image. Objective magnification noted. Please click here to view a larger version of this figure.
Organoids would rarely not break up during the passaging process following this standardized technique. If dissociation does not occur, passage times can be adjusted to achieve optimal cell cluster disintegration. However, prolonged exposure to trypsin-like protease can negatively impact the growth of the organoids. Hepatic organoids were used in a subsequent experiment to investigate the optimal dissociation time and establish a proper passaging method. Briefly, hepatic organoids from two healthy dogs (6 well replicates each) were passaged with trypsin-like protease for 12 min and 24 min. Samples were agitated every 6 min. At the end of the dissociation timepoint, 6 mL of ice-cold Advanced DMEM/F12 was added to the solution, and samples were spun (700 x g for 5 min at 4 °C). The supernatant (Advanced DMEM/F12 with diluted trypsin-like protease) was removed, and the pellets were embedded in solubilized ECM as described above (steps 4.4-4.5). After 12 h of culture in solubilized ECM and CMGF+ R/G, differences were observed in both samples. A 12 min incubation with trypsin-like protease did not inhibit organoid growth. However, the growth of organoids was negatively impacted (see Figure 9) using a 24 min incubation.
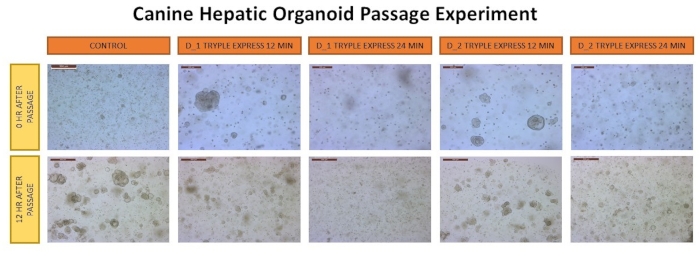
Figure 9: Canine hepatic organoid passage experiment. Representative images of organoids derived from two dogs (D_1 and D_2) passaged using the trypsin-like protease incubation method for 12 min or 24 min. Control samples were passaged with trypsin-like protease for 10 min. A scale bar (µm) is present at the top left of each image and represents 500 µm (5x objective magnification). Please click here to view a larger version of this figure.
Next, the investigation into the survivability of canine hepatic organoids derived from this protocol in an unfavorable environment (deprivation of structural support and nutrition) was performed. The investigation focused on determining the volume of organoid media and basement matrix needed for hepatic organoid's successful growth and survival and also establishing such conditions' influence on the organoid culture. Survivability was measured in a 96-well plate with a limited number of organoids. Organoids from two dogs were passaged as described above and embedded (12 replicates) in different volumes of solubilized ECM (10 µL or 15 µL). The cells were plated in a concentration of 400 cells/10 µL well and 600 cells/15 µL well corresponding to 40,000 cells/mL. Two media types (CMGF+, or CMGF+ R/G) were added in different volumes (25 µL, 30 µL, or 35 µL). The media was never changed, and no maintenance procedures were performed. The survivability of the organoids was monitored every day. Organoid death was defined as the dissolution of more than 50% of organoid structures. The survival rate of organoids in these conditions ranged from 12.9 (±2.3) days to 18 (±1.5) days, and the results are summarized in Table 3. The two samples that survived the longest were organoids derived from dogs embedded in 15 µL of solubilized ECM and 30 µL of CMGF+ media. Both samples were embedded in solubilized ECM (30 µL) and fresh media (500 µL) in a standard 24-well plate after 18 days of deprivation to ensure organoid expansion was still possible (Figure 10).
| Media Type | Mean (days survived) | Median | CV% | Mean (days survived) | Median | CV% | Mean (days survived) | Median | CV% | Mean (days survived) | Median | CV% | |
| Media (μL) | 30 | 25 | 35 | 30 | |||||||||
| ECM (μL) | 10 | 10 | 10 | 15 | |||||||||
| D_1 | CMGF+ R/G | 12.50 | 13 | 11.57 | 12.83 | 13 | 4.50 | 11.83 | 11.5 | 12.91 | 12.08 | 13 | 12.46 |
| CMGF+ | 17.08 | 17 | 16.26 | 18.50 | 19 | 4.89 | 18.42 | 19 | 14.54 | 17.82 | 19 | 8.99 | |
| D_2 | CMGF+ R/G | 13.67 | 14 | 13.36 | 13.00 | 13 | 12.70 | 14.00 | 14.5 | 17.23 | 13.08 | 13 | 8.90 |
| CMGF+ | 15.50 | 15 | 18.56 | 17.50 | 18 | 10.48 | 17.50 | 19 | 20.89 | 17.00 | 17 | 14.41 | |
| TOTAL | CMGF+ R/G | 13.08 | 13 | 13.13 | 12.92 | 13 | 9.39 | 12.92 | 13 | 17.52 | 12.58 | 13 | 11.22 |
| CMGF+ | 16.29 | 16.5 | 17.69 | 18.00 | 18.5 | 8.35 | 17.96 | 19 | 17.65 | 17.43 | 17 | 11.70 | |
| death= more than 50% of organoid mass are unviable | |||||||||||||
Table 3: Survivability experiment results. The experiment was based on deprivation of structural support or nutrition of two organoid cultures. The results include the mean, median, and standard deviation (CV%) of individual concentrations of solubilized ECM and media in individual dogs.
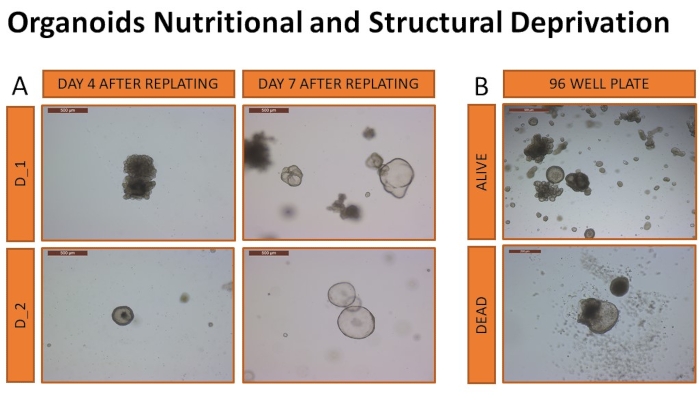
Figure 10: Organoids nutritional and structural deprivation. Organoids were replated in 24-well plates to confirm the ability for expansion post-deprivation (A). Representative images from day 4 and day 7 after the replating show the expansion of the organoids, confirming the ability to identify viable organoids visually (images are taken at 5x objective magnification). Representative images of organoids considered alive, or dead are seen in (B). Images are taken at 5x objective magnification. Please click here to view a larger version of this figure.
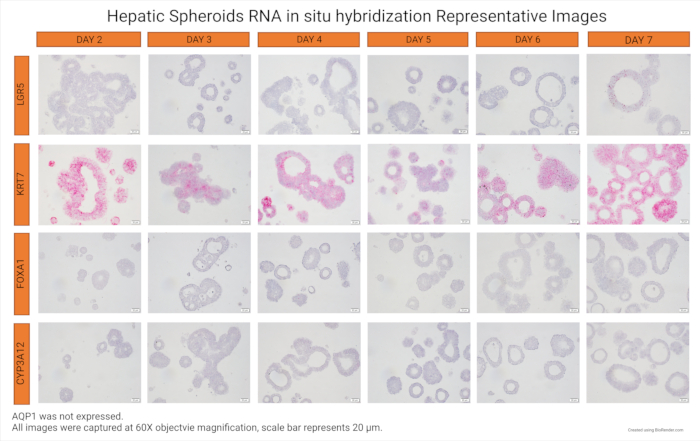
Figure 8: Hepatic spheroids RNA in situ hybridization representative images. Representative images of LGR5, KRT7, FOXA1, and CYP3A12 markers were taken at 60x objective magnification of samples from day 2-7 post passage. Positive mRNA molecules stain red. AQP1 was not expressed in the samples. Please click here to view a larger version of this figure.
| Incomplete chelating solution (ICS) composition | Final concentration |
| 500 mL H2O | NA |
| 2.49 g Na2HPO4-2H2O | 4.98 mg/mL |
| 2.7 g KH2PO4 | 5.4 mg/mL |
| 14 g NaCl | 28 mg/mL |
| 0.3 g KCl | 0.6 mg/mL |
| 37.5 g Sucrose | 75 mg/mL |
| 25 g D-Sorbitol | 50 mg/mL |
| Complete chelating solution (CCS) composition | V/V % or final concentration |
| Incomplete chelation solution | 20% |
| Sterile H2O | 80% |
| DTT | 520 μM |
| Pen Strep | Pen: 196 U/mL; Strep 196 ug/mL |
| Organoid media composition | Final concentration |
| Advanced DMEM/F12 | NA |
| FBS | 8% |
| Glutamax | 2 mM |
| HEPES | 10 mM |
| Primocin | 100 µg/mL |
| B27 supplement | 1x |
| N2 supplement | 1x |
| N-Acetyl-L-cysteine | 1 mM |
| Murine EGF | 50 ng/mL |
| Murine Noggin | 100 ng/mL |
| Human R-Spondin-1 | 500 ng/mL |
| Murine Wnt-3a | 100 ng/mL |
| [Leu15]-Gastrin I human | 10 nM |
| Nicotinamide | 10 mM |
| A-83-01 | 500 nM |
| SB202190 (P38 inhibitor) | 10 µM |
| TMS (trimethoprim sulfamethoxazole) | 10 µg/mL |
| Additional components | Final concentration |
| ROCK inhibitor (Y-27632) | 10 µM |
| Stemolecule CHIR99021 (GSK3β) | 2.5 µM |
| Freezing media composition | V/V percent |
| Organoid media and ROCK inhibitor | 50% |
| FBS | 40% |
| Dimethyl Sulfoxide (DMSO) | 10% |
| FAA composition | V/V percent |
| Ethanol (100%) | 50% |
| Acetic Acid, Glacial | 5% |
| Formaldehyde (37%) | 10% |
| Distilled water | 35% |
Table 1: Composition of solutions and media. A list of components and concentrations of incomplete and complete chelating solutions, CMGF+ (organoid media), freezing media, and FAA.
Supplementary Table 1: Organoid care template. This template allows for accurate and reproducible organoid notetaking for each day. Please click here to download this Table.
Supplementary Table 2: RNA in situ hybridization probes. List of probes specifically designed for canine mRNA targets by a manufacturer of the technology to perform RNA in situ hybridization technique. Information on the significance of individual markers, the name of a probe, its reference number, and target region are listed. Please click here to download this Table.
Discussion
There is currently a lack of standardized protocols available for the isolation and maintenance of canine hepatic and intestinal organoids. Establishing standard operating procedures for organoid cultures is warranted for this model to be applicable in different laboratory settings. Specifically, providing standardized operating protocols for the culture of these canine organoid models is key to characterizing organoids' normal growth during culture and passaging to derive optimal timepoints for expansion and maintenance. Canine intestinal organoids cultured using the protocol have been previously characterized by Chandra et al.12.
One of the most critical steps of the protocol is the passaging of organoids. The optimal time for the first passage of hepatic spheroids was determined to be on day 7 after isolation based on the hepatic spheroid measurements. The maximum volume of spheroids was achieved by day 7, and at the same time, spheroids began to bud and formed hepatic organoids. The increase in overall organoid volume from day 2-7 after isolation was more than 365 times, suggesting the optimal passage time is longer than the canine intestinal organoid culture. After 7 days in culture, no gross signs of cellular apoptosis in the hepatic spheroid were observed, even without cleaning or passaging (Figure 7). Passaging the intestinal and hepatic organoids can be challenging as the procedure can lead to the loss of cells and altered viability. The results indicate that prolonged incubation of hepatic organoids with trypsin-like protease (up to 12 min) does not negatively influence the subculture. Incubating the organoids in trypsin-like protease for longer than 24 min can be detrimental to the subsequent subculture of the organoids.
In case of suboptimal breakage in the cell clusters with the organoid passage, mechanical dissociation instead of prolonged incubation with trypsin-like protease might be more beneficial. If problems are encountered with proper dissociation of the organoids, brief vortexing of the samples may be attempted to enhance the passage yield. On the other hand, vortexing has the potential to ruin a culture and damage cells, so it should only be used when other procedures have failed repeatedly. Breaking hepatic organoids into single cells lowers the growth rate of the organoids, while breaking them into clusters of cells can greatly improve their viability. Ten minutes was chosen as the incubation time for the organoid protocol. A 12 min incubation timepoint was deemed not cytotoxic compared to a 24 min incubation in the trypsin-like protease experiment.
The survivability experiment confirmed that canine hepatic organoids could survive for up to 19.5 days in unfavorable conditions (structural and nutritional depletion). Organoids that survived these conditions the longest were cultured with CMGF+ media. This observation might have been caused by the slower growth of hepatic organoids in media not supplemented with Rock inhibitor and GSK3β. Organoid cultures with CMGF+ R/G grew faster and may have depleted their resources faster. This experiment opens possibilities of miniaturizing the canine organoid culture to achieve a high-throughput system conversion. Such a technology shows the potential to facilitate drug discovery or toxicology studies at a substantially reduced cost.
Some common problems encountered during canine organoid culture maintenance are improper sample solidification when plating, culture contamination, and establishing the proper density and size of the organoids. If solubilized ECM solidifies prematurely during plating, immediately place it on ice for 10 min. If solubilized ECM does not form dome-like structures, it is likely that not enough media was removed from the sample. If this is the case, dilute the sample with a more solubilized ECM until domes form.
When fungal or bacterial contamination is found in an entire plate (see Figure 4), the best solution is to discard the plate. Treatment with antifungal or antibiotic drugs can be attempted, but the success of such an attempt is extremely low. If a single well is contaminated in a plate, viable and unaffected wells can be cleaned (follow steps 4.1 to 4.5) to a new plate and monitored closely. If the sample has already been Emergency Frozen, it is advisable to discard the entire sample, as thawing the sample exposes the incubator to additional contamination risk.
Healthy organoid culture should be at least in the medium size and medium density category or larger. Optimal density is crucial for organoid culture growth. Lower density must be corrected by cleaning the organoids to medium density. If the situation of extreme density occurs (overcrowding), the organoids should be expanded to more wells. Gross signs of cellular apoptosis often accompany both overcrowding and low density of the organoid culture. If these issues are not corrected in time, the whole organoid culture will turn apoptotic in a matter of days. If organoids achieve extra large size or very high density, the culture should be used for an experiment, freezing, or fixation.
The organoid media currently contains 17 components, and the addition of growth factors needed for organoid maintenance and expansion can therefore be expensive. This problem can be solved by growing 2D cell cultures that synthesize the growth factors to produce conditioned CMGF+. Cell culture L-WRN produces Wnt-3a, R-Spondin-3, and Noggin growth factors37. The cell colony uses 90% DMEM/F12 and 10% FBS culture media. When the culture achieves 90 percent confluency, media is harvested every day for 1 week. The harvested media is then mixed with 2x CMGF+ (without these growth factors). While 2D cultures can produce the needed growth factors at a fraction of the cost, the added time and preparation to produce the media must be expected. Concentrations of growth factors between conditioned media batches can also differ37,38.
Canine adult stem-cell-derived organoid cultures are a unique biomedical model that can help achieve the goals of the One Health Initiative39. The organoid technology can be used in many basic and biomedical research areas, spanning from developmental biology, pathophysiology, drug discovery and testing, toxicology to the study of infectious diseases and regenerative medicine40. Translational and reverse translational research are both areas where canine organoids are applicable15. Dogs have been used for centuries in translational experimental settings, and their companion animal status has also facilitated their position as one of the most explored species in veterinary medicine.
In conclusion, this manuscript provides standardized operating protocols for isolation, maintenance, harvesting, and biobanking of canine hepatic and intestinal organoids to facilitate the application of this model in various biomedical fields. This model is uniquely suitable to promote reverse translational research as a tool of the One Health Initiative to promote the inter and intradisciplinary sharing of knowledge.
Disclosures
K. Allenspach is a co-founder of LifEngine Animal Health and 3D Health Solutions. She serves as a consultant for Ceva Animal Health, Bioiberica, LifeDiagnostics, Antech Diagnostics, Deerland Probiotics, and Mars. J. P. Mochel is a co-founder of LifEngine Animal Health and 3D Health Solutions. Dr. Mochel serves as a consultant for Ceva Animal Health and Ethos Animal Health. Other authors do not have any conflicts of interest to declare.
Acknowledgements
The authors want to express gratitude to the Veterinary Diagnostic Laboratory of Iowa State University employees, namely, Haley M. Lambert, Emily Rahe, Rosalyn M. Branaman, Victoria J. Green, and Jennifer M. Groeltz-Thrush, for the timely processing of the samples provided. The authors wish to acknowledge support from the Faculty Startup, ISU VPR Miller Award, ISU VPR Miller Award, and NSF SBIR sub-award to ISU # 1912948.
Materials
| Name | Company | Catalog Number | Comments |
|---|---|---|---|
| Chelating solution | |||
| D-Sorbitol | Fisher Chemical | BP439-500 | |
| DTT | Promega | V3151 | |
| KCl | Fisher Chemical | P217-500 | |
| KH2PO4 | Sigma | P5655-100G | |
| Na2HPO4-2H2O | Sigma | S5136-100G | |
| NaCl | Fisher Chemical | S271-500 | |
| Pen Strep | Gibco | 15140-122 | |
| Sucrose | Fisher Chemical | S5-500 | |
| Organoid media | |||
| [Leu15]-Gastrin I human | Sigma | G9145-.5MG | |
| A-83-01 | PeproTech | 9094360 | |
| Advanced DMEM/F12 | Gibco | 12634-010 | |
| B27 supplement | Gibco | 17504-044 | |
| FBS | Corning | 35-010-CV | |
| Glutamax | Gibco | 35050-061 | |
| HEPES | VWR Life Science | J848-500ML | |
| Human R-Spondin-1 | PeproTech | 120-38-500UG | |
| Murine EGF | PeproTech | 315-09-1MG | |
| Murine Noggin | PeproTech | 250-38-250UG | |
| Murine Wnt-3a | PeproTech | 315-20-10UG | |
| N2 supplement | Gibco | 17502-048 | |
| N-Acetyl-L-cysteine | Sigma | A9165-25G | |
| Nicotinamide | Sigma | N0636-100G | |
| Primocin | InvivoGen | ant-pm-1 | |
| ROCK inhibitor (Y-27632) | EMD Millipore Corp. | SCM 075 | |
| SB202190 (P38 inhibitor) | Sigma | S7067-25MG | |
| Stemolecule CHIR99021 (GSK3β) | Reprocell | 04-0004-base | |
| Trimethoprim | Sigma | T7883-5G | |
| Sulfamethoxazole | Sigma-Aldrich | S7507-10G | |
| Reagents | |||
| Acetic Acid, Glacial | Fisher Chemical | A38-500 | |
| Dimethyl Sulfoxide (DMSO) | Fisher Chemicals | D128-500 | |
| EDTA, pH 8.0, 0.5 M | Invitrogen | 15575-038 | |
| Formaldehyde (37%) | Fisher Chemical | F79P-4 | |
| Glutaraldehyde solution | Sigma | G5882 | |
| Matrigel Matrix For Organoid Culture | Corning | 356255 | Extracellular Membrane Matrix |
| Paraformaldehyde, 97% | Alfa Aesar | A11313 | |
| PBS, 1X (Phosphate-Buffered Saline) | Corning | 21-040-CM | |
| PBS, 1X (Phosphate-Buffered Saline) | Corning | 21-040-CM | |
| RNAlater Soln. | Invitrogen | AM7021 | RNA Storage Reagent |
| TrypLE Express | Gibco | 12604-021 | Trypsin-like Protease |
| Other | |||
| 6 Well Cell Culture Plate | Corning | 3516 | |
| ACD Hybez II Hybridization System | ACD a biotechne brand | 321710 | |
| Centrifuge Tube, 15 mL | Corning | 430766 | |
| CoolCell LX | Corning | BCS-405MC | |
| Cryogenic Vials | Corning | 430488 | |
| Disposable Centrifuge Tube (50 mL) | Fisherbrand | 05-539-13 | |
| GyroMini Nutating mixer (Rocker) | Labnet | S0500-230V-EU | |
| Heat Bath | Lab-Line Instruments | 3000 | |
| Mr. Frosty Freezing Container | ThermoFisher Scientific | 5100-0001 | |
| NanoDrop 2000 | ThermoFisher Scientific | ND2000CLAPTOP | SpectrophotometerAnalysis |
| Panasonic incubator | Panasonic | MCO-170ML-PA | |
| Parafilm M Wrapping Film | Bemis Company Inc | PM996/EMD | Laboratory Flexible Film Tape |
| Protected Disposable Scalpels | Bard-Parker | 239844 | |
| RNAscope 2.5 HD Assay – RED | ACD a biotechne brand | 322350 | |
| RNAscope H2O2 & Protease Plus Reagents | ACD a biotechne brand | 322330 | |
| RNAscope Target Retrieval Reagents | ACD a biotechne brand | 322000 | |
| RNAscope Wash Buffer Reagents | ACD a biotechne brand | 310091 | |
| Tissue Culture Dish | Dot Scientific | 6676621 | |
| Tissue Culture Plate 24 wells | Fisherbrand | FB012929 |
References
- Hickman, D. L., Johnson, J., Vemulapalli, T. H., Crisler, J. R., Shepherd, R. Commonly used animal models. Principles of Animal Research for Graduate and Undergraduate Students. , 117-175 (2017).
- De Jong, M., Maina, T. Of mice and humans: Are they the same? - Implications in cancer translational research. Journal of Nuclear Medicine. 51 (4), 501-504 (2010).
- Cannarozzi, G., Schneider, A., Gonnet, G. A phylogenomic study of human, dog, and mouse. PLoS Computational Biology. 3 (1), 0009-0014 (2007).
- Jacob, J. A. Researchers turn to canine clinical trials to advance cancer therapies. JAMA - Journal of the American Medical Association. 315 (15), 1550-1552 (2016).
- Ziegler, A., Gonzalez, L., Blikslager, A. Large animal models: The key to translational discovery in digestive disease research. Cellular and Molecular Gastroenterology and Hepatology. 2 (6), 716-724 (2016).
- Swanson, K. S., et al. Phylogenetic and gene-centric metagenomics of the canine intestinal microbiome reveals similarities with humans and mice. ISME Journal. 5 (4), 639-649 (2011).
- Coelho, L. P., et al. Similarity of the dog and human gut microbiomes in gene content and response to diet. Microbiome. 6 (1), 72(2018).
- Nguyen, T. L. A., Vieira-Silva, S., Liston, A., Raes, J. How informative is the mouse for human gut microbiota research. DMM Disease Models and Mechanisms. 8 (1), 1-16 (2015).
- Bontempo, V. Nutrition and health of dogs and cats: Evolution of petfood. Veterinary Research Communications. 29, 45-50 (2005).
- Allenspach, K., Gaschen, F. Canine chronic enteropathies: A review. Schweizer Archiv fur Tierheilkunde. 145 (5), 209-222 (2003).
- Tribuddharatana, T., Kongpiromchean, Y., Sribhen, K., Sribhen, C. Biochemical alterations and their relationships with the metabolic syndrome components in canine obesity. Kasetsart Journal - Natural Science. 45 (4), 622-628 (2011).
- Chandra, L., et al. Derivation of adult canine intestinal organoids for translational research in gastroenterology. BMC Biology. 17 (1), 33(2019).
- Schaefer, K., Rensing, S., Hillen, H., Burkhardt, J. E., Germann, P. G. Is Science the only driver in species selection? An internal study to evaluate compound requirements in the minipig compared to the dog in preclinical studies. Toxicologic Pathology. 44 (3), 474-479 (2016).
- MacArthur Clark, J. The 3Rs in research: A contemporary approach to replacement, reduction and refinement. British Journal of Nutrition. 120, 1-7 (2018).
- Schneider, B., et al. Model-based reverse translation between veterinary and human medicine: The one health initiative. CPT: Pharmacometrics and Systems Pharmacology. 7 (2), 65-68 (2018).
- Lehmann, R., et al. Human organoids: A new dimension in cell biology. Molecular Biology of the Cell. 30 (10), 1129-1137 (2019).
- Sato, T., et al. Single Lgr5 stem cells build crypt-villus structures in vitro without a mesenchymal niche. Nature. 459 (7244), 262-265 (2009).
- Kim, J., Koo, B. K., Knoblich, J. A. Human organoids: model systems for human biology and medicine. Nature Reviews Molecular Cell Biology. 21 (10), 571-584 (2020).
- Jensen, C., Teng, Y. Is it time to start transitioning from 2D to 3D cell culture. Frontiers in Molecular Biosciences. 7, 33(2020).
- Ho, B. X., Pek, N. M. Q., Soh, B. S. Disease modeling using 3D organoids derived from human induced pluripotent stem cells. International Journal of Molecular Sciences. 19 (4), 936(2018).
- Truskey, G. A. Human microphysiological systems and organoids as in vitro models for toxicological studies. Frontiers in Public Health. 6, 185(2018).
- Caipa Garcia, A. L., Arlt, V. M., Phillips, D. H. Organoids for toxicology and genetic toxicology: applications with drugs and prospects for environmental carcinogenesis. Mutagenesis. , (2021).
- Augustyniak, J., et al. Organoids are promising tools for species-specific in vitro toxicological studies. Journal of Applied Toxicology. 39 (12), 1610-1622 (2019).
- Zietek, T., et al. Organoids to study intestinal nutrient transport, drug uptake and metabolism - Update to the human model and expansion of applications. Frontiers in Bioengineering and Biotechnology. 8, 577656(2020).
- Zietek, T., Rath, E., Haller, D., Daniel, H. Intestinal organoids for assessing nutrient transport, sensing and incretin secretion. Scientific Reports. 5 (1), 1-10 (2015).
- Kar, S. K., et al. Organoids: a promising new in vitro platform in livestock and veterinary research. Veterinary Research. 52 (1), 1-17 (2021).
- Borcherding, D. C., et al. Sa1976 polyphenols reverse the pathologic effects of palmitic acid and high fat diet in canine enteroids. Gastroenterology. 158 (6), 486(2020).
- Ambrosini, Y. M., et al. Recapitulation of the accessible interface of biopsy-derived canine intestinal organoids to study epithelial-luminal interactions. PLoS ONE. 15 (4), 0231423(2020).
- Zdyrski, C., et al. Su124 homology directed repair in canine duodenal enteroids to mimic the wild-type P-glycoprotein mutation. Gastroenterology. 160 (6), 625(2021).
- Li, Y., Tang, P., Cai, S., Peng, J., Hua, G. Organoid based personalized medicine: from bench to bedside. Cell Regeneration. 9 (1), 21(2020).
- Kurr, L. A., Allenspach, K., Jergens, A., Mochel, J. P. Harnessing the biology of intestinal organoids to accelerate drug discovery in inflammatory bowel disease: A one health approach. The FASEB Journal. 34, 1(2020).
- Nantasanti, S., et al. Disease modeling and gene therapy of copper storage disease in canine hepatic organoids. Stem Cell Reports. 5 (5), 895-907 (2015).
- Favier, R. P., et al. COMMD1-Deficient dogs accumulate copper in hepatocytes and provide a good model for chronic hepatitis and fibrosis. PLoS ONE. 7 (8), 42158(2012).
- Kruitwagen, H. S., et al. Long-term survival of transplanted autologous canine liver organoids in a COMMD1-deficient dog model of metabolic liver disease. Cells. 9 (2), 410(2020).
- Vilgelm, A. E., et al. Fine-needle aspiration-based patient-derived cancer organoids. iScience. 23 (8), 101408(2020).
- Saxena, K., et al. Human intestinal enteroids: A new model to study human rotavirus infection, host restriction, and pathophysiology. Journal of Virology. 90 (1), 43-56 (2016).
- VanDussen, K. L., Sonnek, N. M., Stappenbeck, T. S. L-WRN conditioned medium for gastrointestinal epithelial stem cell culture shows replicable batch-to-batch activity levels across multiple research teams. Stem Cell Research. 37, 101430(2019).
- Powell, R. H., Behnke, M. S. WRN conditioned media is sufficient for in vitro propagation of intestinal organoids from large farm and small companion animals. Biology Open. 6 (5), 698-705 (2017).
- Mackenzie, J. S., Jeggo, M. The one health approach-why is it so important. Tropical Medicine and Infectious Disease. 4 (2), 88(2019).
- Artegiani, B., Clevers, H. Use and application of 3D-organoid technology. Human Molecular Genetics. 27 (2), 99-107 (2018).
Reprints and Permissions
