Autoimmune encephalitis is a new category of antibody-mediated diseases of the central nervous system. Hippocampal neurons can be used to discover and characterize these antibodies. This article provides a protocol for primary cell culture and immunostaining to determine autoantibodies in the serum and cerebrospinal fluid of patients.
Method Article
Hippocampal Neuronal Cultures to Detect and Study New Pathogenic Antibodies Involved in Autoimmune Encephalitis
In This Article
Summary
Abstract
Over the last 15 years, a new category of antibody-mediated diseases of the central nervous system (CNS) has been characterized and is now defined as "autoimmune encephalitis" (AE). There are currently 17 known AE syndromes, and all are associated with antibodies against the neuronal cell surface or synaptic proteins. The clinical syndromes are complex and vary according to the type of associated antibody. The best-known of these diseases is anti-N-methyl D-aspartate receptor (NMDAR) encephalitis, which is a prominent neuropsychiatric disorder associated with severe memory and behavioral impairments. The associated antibodies react with the GluN1 subunit of the NMDAR at the N-terminal domain. The approach most frequently used for the discovery and characterization of AE antibodies includes the culture of dissociated, fetal, rodent hippocampal neurons. During the process of antibody characterization, live neurons in culture are exposed to patients' serum or CSF, and the detection of reactivity indicates that the serum or CSF samples of the patient contain antibodies against neuronal surface antigens. Hippocampal cultures can also be used to determine whether the antibodies in patients are potentially pathogenic by examining if they cause structural or functional alterations of the neurons. The level of success of these studies depends on the quality of the cultures and on the protocols used to obtain and detect the reactivity of patient samples. This article provides an optimized protocol for primary cell culture of fetal rat hippocampal neurons combined with immunostaining to determine the presence of antibodies in the serum or CSF of patients. An example of how to examine the potential pathogenic effects of NMDAR antibodies using cultured neurons and calcium imaging is also presented.
Introduction
Autoimmune encephalitis (AE) is a recently discovered category of diseases of the central nervous system (CNS) mediated by antibodies that target neuronal surface or synaptic proteins1,2. The clinical features vary according to the antibody but commonly include impaired memory and cognition, altered behavior and psychiatric symptoms, abnormal movements, sleep dysfunction, decreased level of consciousness, and seizures. These disorders can affect individuals of all ages, with some types of AE predominantly affecting children and young adults2.
Over the last 15 years, 17 AE syndromes with antibodies against specific neuronal surface/synaptic proteins have been described (Table 1). A few examples of the neuronal targets include the synaptic excitatory receptors NMDAR3,4 and AMPAR5, the synaptic inhibitory receptor GABAbR6, the neuronal secreted protein LGI17, and the cell adhesion molecule IgLON58. For most of these AE, studies have shown that the antibodies disrupt the structure or function of their target antigen, strongly supporting a pathogenic role. For example, in anti-NMDAR encephalitis, the antibodies react with the N-terminal domain of the GluN1 subunit of the NMDAR, producing a selective and reversible internalization of these receptors that results in prominent neuropsychiatric alterations4,9,10,11.Thus,the identification of any of the 17 known antibodies in the serum or CSF of a patient can also be used as a diagnostic test that establishes the diagnosis of a specific AE.
One of the techniques more frequently used for the identification and characterization of these antibodies includes the use of cultures of dissociated, fetal, rodent hippocampal neurons. These cultures are useful for several reasons: embryonic brain is easy to dissociate and contains a low level of glial cells, the major source of contamination in neuronal cultures12; the cell population of the hippocampus is relatively homogeneous compared to most other regions of the CNS, with pyramidal cells representing the vast majority13,14; cultures are prepared from late-stage embryos when the generation of pyramidal neurons is complete but granule cells have not yet developed, further adding to the homogeneity of the culture; when cultured, pyramidal neurons express most of their main phenotypic features, are able to form well-developed dendrites, and establish synaptically connected networks that can be used for structural and electrophysiological investigations12,13; as antibodies cannot penetrate live neurons, the use of live cultures allows for the identification of antigenic targets that reside on the cell surface; and immunoprecipitation of the antibody-antigen complex from neuronal cultures allows for identification of the target antigen5.
The success of studies using neuronal cultures is highly dependent on the quality of the cultures and the protocols used to assess the immunoreactivity of a patient's serum or cerebrospinal fluid (CSF). Variables that can affect the cultures include the procedures for isolation of the hippocampus prior to culture development, the dissociation of the tissue, the plating density, the growth surface used, and the composition of the media13,15,16. This article provides an optimized protocol for primary cell culture of fetal rat hippocampal neurons combined with fluorescent immunostaining that can be used to determine the presence of antibodies against known AE antigens and potentially novel surface targets. It also provides an example of how to examine the pathogenic effects of NMDAR antibodies by live-cell imaging techniques using cultured hippocampal neurons expressing a genetically encoded calcium indicator (GECI) from the GCaMP family, GCaMP5G.
| Target protein | Protein function | Cell compartment | Main syndrome |
| NMDAR | Ion Chanel | Synaptic protein | Anti-NMDAR encephalitis |
| AMPAR | Ion Chanel | Synaptic protein | Limbic encephalitis |
| GluK2 | Ion Chanel | Synaptic protein | Encephalitis |
| GABAaR | Ion Chanel | Synaptic protein | Encephalitis |
| GABAbR | Metabotropic receptor | Synaptic protein | Limbic encephalitis |
| mGluR1 | Metabotropic receptor | Synaptic protein | Encephalitis |
| mGluR2 | Metabotropic receptor | Synaptic protein | Encephalitis |
| mGluR5 | Metabotropic receptor | Synaptic protein | Encephalitis |
| D2R | Metabotropic receptor | Synaptic protein | Basal ganglia encephalitis |
| LGI1 | Adhesion molecule | Cell surface protein | Limbic encephalitis |
| CASPR2 | Adhesion molecule | Cell surface protein | Limbic encephalitis |
| IgLON5 | Adhesion molecule | Cell surface protein | Anti-IgLON5 disease |
| Neurexin-3α | Adhesion molecule | Cell surface protein | Encephalitis |
| DNER (Tr) | Transmembrane protein | Cell surface protein | Encephalitis |
| SEZ6L | Transmembrane protein | Cell surface protein | Encephalitis |
| Amphiphysin | Structural molecule | Cell surface protein | Limbic encephalitis |
| DPPX | Peptidase | Cell surface protein | Encephalitis |
Table 1: Antibodies to the neuronal cell surface and synaptic proteins.
Protocol
All procedures were approved by the local ethics committee of the University of Barcelona following European (2010/63/UE) regulations about the use and care of experimental animals. Written informed consent was obtained from patients, and the study was approved by the local institutional review board for the use of human samples (Hospital Clínic, HCB/2018/0192).
NOTE: There are three parts in the current protocol. The first one is for establishing the neuronal cultures, the second one is for the detection of surface antibodies using live cultures of neurons, and the third one is to determine the pathogenicity of these antibodies.
PART 1: Establishment of dissociated, fetal, rodent hippocampal neuronal cultures
1. Preparative steps
- Poly-L-Lysine coating of the plating surfaces (3 days before dissection)
- Prepare the borate buffer by adding 2.38 g of boric acid and 1.27 g of borax to 500 mL of distilled water and stirring for 15 min until dissolved. Under a hood, sterilize the buffer solution by filtering (0.2 µm pore size), label, and store at room temperature (RT).
NOTE: This solution is stable and can be used for 6 months.
CAUTION: When preparing borate buffer, wear recommended personal protective equipment. - Prepare the Poly-L-Lysine (PLL) stock solution (100 mg/mL) by adding 1 g of PLL to 10 mL of distilled water and stirring until dissolved. Prepare 500 µL aliquots of PLL stock solution. To reach a final concentration of 1 mg/mL, add 500 µL of PLL aliquot to 50 mL of borate buffer and swirl until dissolved, and sterilize the solution by filtering (0.2 µm pore size).
NOTE: This solution is stable and can be used for 6 months. - Prepare the surfaces for coating. Use 12 mm diameter coverslips for immunostaining procedures and glass-bottom dishes for studies that will include the imaging of live neurons. If using coverslips, autoclave and then place five coverslips in each dish (3.5 cm diameter).
NOTE: The thickness of the coverslip affects the quality and intensity of the signal of the images acquired. Most microscope objectives are designed for #1.5 coverslips. Choose the appropriate coverslips according to the imaging setup and techniques. - Under a hood, add 1.5 mL of PLL solution to each dish (glass-bottom dish or 3.5 cm dish with five coverslips). Make sure all the coverslips are submerged and stored at RT for 24 h.
- 2 days before dissection, aspirate the PLL solution and wash with sterile endotoxin-free water, making sure the coverslips are submerged. Keep water in the dishes and store at RT for 24 h.
- 1 day before dissection, aspirate the water and replace it with NB + B27 culture media (see below), and place the dishes in an incubator at 37 °C for 24 h.
- Prepare the borate buffer by adding 2.38 g of boric acid and 1.27 g of borax to 500 mL of distilled water and stirring for 15 min until dissolved. Under a hood, sterilize the buffer solution by filtering (0.2 µm pore size), label, and store at room temperature (RT).
- Preparation of culture media and stock solution (1 day before dissection)
- Dulbecco's Modified Eagle Medium (DMEM): To 500 mL of DMEM High Glucose (4.5 g/L) without L-Glutamine and phenol red, add 50 mL of horse serum, 50 mL of fetal bovine serum (FBS), 10 mL of L-glutamine (200 mM), 10 mL of sodium pyruvate (100 mM), 10 mL of penicillin-streptomycin (10,000 U/mL). Filter (0.2 µm pore size) and store in 5 mL aliquots at 4 ᵒC with a tightly closed cap.
NOTE: This solution is stable and can be used for 1 month. - Neurobasal (NB) medium supplemented with B27 (NB + B27): To 50 mL of NB medium without phenol red, add 1 mL of B27 supplement.
- Hibernate-E medium supplemented with B27 (Hibernate + B27): To 50 mL of Hibernate-E medium, add 1 mL of B27 supplement.
- Extracellular Physiological Solution (EPS): To 1 L of sterile water, add the following at the specified final concentrations: NaCl (140 mM), KCl (3.5 mM), HEPES (10 mM), glucose (20 mM), and CaCl2 (2 mM). Stir until dissolved and adjust the pH to 7.4 by adding NaOH (0.5 M) or HCl (0.5 M). Under the hood, sterilize by filtering (0.2 µm pore size) and store at 4 ᵒC.
- Dulbecco's Modified Eagle Medium (DMEM): To 500 mL of DMEM High Glucose (4.5 g/L) without L-Glutamine and phenol red, add 50 mL of horse serum, 50 mL of fetal bovine serum (FBS), 10 mL of L-glutamine (200 mM), 10 mL of sodium pyruvate (100 mM), 10 mL of penicillin-streptomycin (10,000 U/mL). Filter (0.2 µm pore size) and store in 5 mL aliquots at 4 ᵒC with a tightly closed cap.
- Equipment and other laboratory materials (day of dissection)
- Set a water bath to 37 °C. Heat the following aliquots: 50 mL of HBSS, and 5 mL of DMEM.
- Sterilize the following tools by immersing in a beaker containing absolute ethanol (Figure 1B): forceps, curved forceps, scissors, fine-curved forceps, fine-straight forceps, surgery scissors, fine-angled forceps, and precision spring scissors.
NOTE: To protect the tools, place a soft material (e.g., science precision wipes) at the bottom of the beaker. - Fill two trays with ice and place the following items.
- Ice tray 1 (Figure 1C): Place surgical tools in the beaker with absolute ethanol, a beaker with HBSS for rinsing the surgical tools, a 10 cm dish with HBSS to place the embryos, a 6 cm dish with HBSS to place the heads of the embryos, and a 6 cm dish with Hibernate + B27 to place the brains of the embryos.
- Ice tray 2: Place a 1 mL aliquot of trypsin 2.5% and a 3.5 cm dish with Hibernate + B27 for the dissected hippocampus.
NOTE: The time needed for this procedure depends on the investigator's experience and the number of embryos to be dissected. Therefore, the ice must remain frozen for the needed amount of time. Polystyrene trays are recommended for this purpose.
2. Dissection and seeding (Figure 1)
- Hippocampal isolation
NOTE: Pregnant rats with embryos at E18 are euthanized immediately before the protocol starts in accordance with the local ethics committee of the University of Barcelona, following European (2010/63/UE) regulations about the use and care of experimental animals. In this protocol, carbon dioxide (CO2) inhalation was used as the method of euthanasia.- Dissect the rat at the level of the abdominal peritoneum using forceps and scissors. Extract the uterus with the E18 embryos and place it in a 10 cm dish that has been chilled on ice.
NOTE: It is important to avoid the rat hairs attaching to the embryos. It is recommended to use copious amounts of 70% ethanol to sterilize the abdomen. From this step onward, work inside the hood on ice tray 1. - Open the embryonic sacs and transfer the embryos to the 10 cm dish with HBSS, making sure the embryos are fully immersed.
- Remove the embryo head with scissors and place it in the 6 cm dish with HBSS. Repeat this process with all the embryos.
NOTE: To avoid contamination, all tissue except for the embryo heads should be discarded in a container with a screw cap. - Hold the embryo head with fine-curved forceps and pierce the orbits with a pair of fine-straight forceps, entering at a 45° angle, and then release the fine-curved forceps.
NOTE: The forceps must not go through the brain, so it is important to maintain the angle when entering. - Dissect the skin and skull with the surgery scissors, starting from the occipital bone to the frontal bone. Remove the brain with a pair of fine-curved forceps and place it in the 6 cm dish with Hibernate + B27. Repeat this process until all the brains are recovered.
- Sagittally separate the telencephalons with the fine-straight forceps.
NOTE: From this step onward, the dissection of the hippocampus is carried out under a stereomicroscope. It is recommended to use articulated lamps so that the light illuminates the dissection surface from the sides. It is also recommended to use a black background as this provides more contrast, allowing to better distinguish the hippocampus. - Prepare a 10 cm dish by placing drops of Hibernate + B27 at 1 cm distances (e.g., in a circle). Place one telencephalon per drop of Hibernate + B27 and visualize through the dissecting scope (1.25x objective magnification is recommended).
- Carefully peel the meninges and remove the thalamus to better visualize the hippocampus.
- Dissect the hippocampus with the precision spring scissors and place it in the 3.5 cm dish with Hibernate + B27 in ice tray 2. Repeat for every telencephalon until all the hippocampi are collected.
- Carefully collect all the hippocampi with a Pasteur pipette and transfer them to a 50 mL tube.
NOTE: Take the minimum volume of Hibernate + B27 when collecting the hippocampi so as not to dilute the trypsin.
- Dissect the rat at the level of the abdominal peritoneum using forceps and scissors. Extract the uterus with the E18 embryos and place it in a 10 cm dish that has been chilled on ice.
- Cell dissociation
- Enzymatic dissociation of the hippocampus
- In the 50 mL tube containing the hippocampi, add 1 mL of 2.5% trypsin and bring it to a 5 mL volume with HBSS. Incubate for 15 min in the water bath at 37 °C.
- To dilute the trypsin, add 10 mL of pre-heated HBSS and incubate for 5 min in the water bath at 37 °C.
- Transfer the hippocampi that now appear as a mucus mass to a 50 mL tube with a 1,000 µL micropipette, add 6 mL of pre-heated HBSS, and incubate for 5 min in the water bath at 37 °C.
- Mechanical dissociation of the hippocampus
- Transfer the mass to a 2 mL tube with conical bottom, taking the minimal volume. Add 1 mL of pre-heated DMEM media. Homogenize the pellet with a 1,000 µL micropipette by gently aspirating up and down.
NOTE: It is critical to avoid generating bubbles when aspirating as bubbles may lyse the cells. - Repeat the up and down aspiration with a pre-pulled glass pipette (10x-20x), with its tip in contact with the conical bottom of the tube. Avoid generating bubbles. At the end of this step, the mixture must be translucent.
- Once homogenously mixed such that the mixture is translucent, transfer the mixture to a tube containing 4 mL of DMEM media at 37 °C and homogenize with a glass pipette by pipetting up and down.
- Transfer the mass to a 2 mL tube with conical bottom, taking the minimal volume. Add 1 mL of pre-heated DMEM media. Homogenize the pellet with a 1,000 µL micropipette by gently aspirating up and down.
- Enzymatic dissociation of the hippocampus
- Cell seeding
- Count the cells. The number of neurons in the solution can be counted according to standard laboratory procedures.
NOTE: In imaging experiments for antibody detection and calcium activity, a concentration of 50,000 cells per 3.5 cm dish is optimal. - Keeping the cells suspended, withdraw the calculated volume, and plate in 3.5 cm dishes containing PLL-coated coverslips or in the PLL-coated glass-bottom dishes.
- Evenly distribute the cells on the dishes by softly shaking in crossed movements (back and forth, then side to side; repeat as needed) and place the dishes in the CO2 (5%) incubator.
NOTE: It is important to use crossed movements to avoid the cells settling in the periphery of the dish. - Every week, add approximately 1 mL of NB + B27, so the culture does not dry.
NOTE: After 2 weeks (14 days in vitro [div]), the neurons are mature and express all factors to be used for experimentation. The total average number of neurons obtained using this protocol is approximately 2.5 x 10⁶ neurons coming from an average of 12 E18 embryos per pregnant rat.
- Count the cells. The number of neurons in the solution can be counted according to standard laboratory procedures.
PART 2: Using hippocampal neuronal cultures for antibody detection in neuronal cell surface proteins
NOTE: This part of the protocol demonstrates how hippocampal cultures are used to identify anti-NMDAR antibodies in the serum and/or CSF of patients with anti-NMDAR encephalitis. Fluorescent immunostaining is used to visualize the reactivity in the live neurons, but other visualization methods could also be used. An appropriate control for this experiment would be serum or CSF from a healthy individual. When using human samples, keep in mind that approval from the institutional ethical committee may be required.
3. Live fluorescent immunostaining
- Use 14 div cells that have been grown on coverslips (50,000 cells per 3.5 cm dish containing five coverslips).
- Inside the hood, rinse the coverslips with NB pre-heated to 37 °C.
- Add the sample that in this case contains anti-NMDAR antibodies (used as a primary antibody) diluted in NB media at 1:200 for serum or 1:2 for CSF and incubate 1 h at 37 °C (inside the CO2 (5%) incubator).
- Rinse carefully with PBS 3x at RT.
- Add fixation solution (4% formaldehyde in PBS) and incubate at RT for 5 min.
CAUTION: When handling 4% formaldehyde, work inside the hood and wear recommended personal protective equipment. - Wash 3x with PBS for 5 min each.
- Add secondary antibody Goat anti-Human AF488 at 1:1000 dilution and incubate at RT for 1 h.
NOTE: During the incubation, protect from light exposure by covering with aluminum foil. - Wash 3x with PBS for 5 min each. Rinse with distilled water
- Mount the coverslips with a liquid mounting medium (e.g., antifading mounting media with DAPI; approximately 7 µL), aspirate any remaining liquid and rinse with distilled water. The neurons are now ready for fluorescence imaging.
CAUTION: When handling mounting medium, wear the recommended personal protective equipment.
PART 3: Demonstration of antibody pathogenic effects using calcium imaging
NOTE: This part of the protocol demonstrates how to determine if the antibodies in patients have a functional effect on the cultures, which would suggest pathogenicity. In order to increase the significance of the effects, a pool of CSF from eight patients was used. Calcium activity of the live cultures was recorded upon chemical stimulation (NMDA + Glycine) using the GECI fluorescence calcium indicator (GCaMP5G). These studies require an inverted fluorescence microscope with a cell chamber that can maintain the required physiological conditions of the neurons.
4. Calcium imaging
- Use 14-18 div cells that have been grown on coverslips (50,000 cells per 3.5 cm dish with five coverslips)
- 1 week prior to imaging, add the viral vector pAAV2-CAG-GCaMP5G at 2.5 x 10¹⁰ GC/mL to the cells and incubate for 5-7 days.
NOTE: This commercially available, pre-packaged AAV serotype 2 vector over-expresses genetically encoded calcium indicator GCaMP5G under a CAG promoter. - 1 day prior to imaging, add the patient sample (in this example, a pool of CSF diluted 1:25 in NB + B27) and incubate for 24 h. Always filtrate human samples (0.2 µm pore size) prior to use to avoid contamination.
NOTE: For these studies, control CSF from healthy subjects needs to be run in parallel. - On the day of imaging, prepare the imaging setup and set the microscope cell chamber to 37 °C, fill the lane with distilled water, and infuse with 5% CO2 to maintain cell physiological conditions.
- In the hood, wash the cells from Step 3 with 3 mL of EPS pre-heated to 37 °C
- Cover the cells with 2.45 mL of EPS and transfer them to the microscope cell chamber. Add NBQX (10 µM) to block the AMPA and KA receptors to visualize exclusively the NMDA receptor response.
- In the inverted fluorescence microscope equipped with a mercury lamp and a FITC filter cube, acquire a 2 min movie with frames recorded every 100 ms (spontaneous activity).
NOTE: A 20x NA 0.75 air objective was used, and images (512 x 512 pixels, 16-bit grayscale) were taken every 100 ms with a sCMOS camera. - Acquire the second movie of 4 min with frames recorded every 100 ms. Shortly after starting the acquisition, add stimulation solution (NMDA [100 µM] + Glycine [1 µM]) to the dish.
NOTE: The addition of media into the dish will generate turbulence that could disrupt the imaging conditions (focus, fluorescence intensity, and/or unspecific background signal). Do not add more than 50 µL of solution into the filled 2.5 mL dish to decrease the probability of such alterations. - Using image processing software (ImageJ was used here), extract the fluorescence signal over time, obtained upon stimulation, from the cultures incubated with the patient and control CSF samples.
NOTE: The GCaMP probes, when binding to free calcium ions, undergo a conformational change causing them to become brighter. Therefore, the increase in fluorescence intensity correlates with a calcium influx due to neuronal depolarization. - Determine the regions of interest (ROI) to analyze. Manually segment the somas of neurons and add the ROIs to the ROI manager (Analyze > Tools > ROI Manager > Add). Save the ROI from the ROI Manager menu (More > Save).
- Set the measurements (Analyze > Set measurements) and select the Mean gray value. Extract the mean fluorescence intensity profile from the cell somas by clicking More > Multi Measure, and then save the table generated as a .xls spreadsheet.
- Perform statistical analyses to compare the fluorescence between groups (patients' CSF vs. control's CSF).
Results
Establishment of dissociated, fetal, rodent hippocampal neuronal cultures
The protocol presented here is based on the influential studies on nerve cell culturing performed by Banker and Goslin15. The protocol has been refined to obtain neuronal cultures with optimal morphology, density, and purity for performing neuronal surface antibody detection studies. The protocol of dissection and seeding is divided into three parts (Figure 1A). The first part, the hippocampal isolation, consists of the surgical extraction of the living tissue (Figure 1A, left panel). As indicated by the figure, pregnant Wistar rats with E18 embryos are the key starting material for a successful culture. Once the brain is extracted from the E18 embryos, microsurgery is carried out under a stereomicroscope. With appropriate tools (Figure 1B) and precise handling, it is possible to separate the hippocampus from the rest of the nerve tissue. The disposition of tissues in the specific media is depicted in Figure 1C. The second part of the protocol consists of the hippocampal cell dissociation. It is subdivided into two steps (Figure 1A, middle panel): enzymatic dissociation and mechanical dissociation of the hippocampus, which result in intact, dissociated, single cells. Using this methodology, it is possible to obtain cell cultures without cell aggregates, as represented in Figure 2A-D. The third part of the protocol consists of the cell seeding (Figure 1A, right panel). This part of the protocol is crucial in order to adjust the density and homogeneity of the neuronal culture in the plate. Counting the cells and seeding 50,000 neurons in an area of a 3.5 cm dish provides an optimal density to carry out not only experiments to determine the presence of antibodies to neuronal cell surface proteins (Figure 3) but also to analyze the pathogenicity of these antibodies with calcium imaging (Figure 4).

Figure 1: Visual protocol for primary cultures of hippocampal neurons. (A) Flowchart showing the three parts of the protocol for preparing dissociated-cell cultures of hippocampal neurons from embryonic rats at E18. The protocol is divided into 1. Hippocampal isolation, 2. Cell dissociation, and 3. Cell seeding. (B) Selection of recommended tools for hippocampal isolation grouped into three categories: (1- Forceps, 2- Curved forceps, 3- Scissors) for embryo collection, (4- Fine-curved forceps, 5- Fine-straight forceps, 6- Surgery scissors) for brain extraction, and (7- Fine-angled forceps, 8- Precision spring-scissors) for hippocampal isolation. (C) Schematic representation of ice tray 1 with plates and media needed for the hippocampus isolation. Embryos and heads are placed in HBSS, whereas brains are placed in Hibernate medium + B27. Please click here to view a larger version of this figure.
Cultures of hippocampal neurons at 18 div are mature, interconnected, and express structural and functional proteins
In the growth and maturation of neuronal cultures, two differentiated phases can be appreciated: the polarization phase of the neuron (Figure 2A,B) and the phase of dendritic development and construction of the synaptic network (Figure 2C,D). Cells on 1 div are evenly distributed and have adhered to the plate, developing a lamella around the cell body with minor neurites beginning to extend (Figure 2A). After some days in culture, the neurites extend a short distance. Cells show a significant polarization, but there is little net growth (Figure 2B). After this stage, synaptogenesis is prominent, and the neurons start to interconnect. The neuronal network keeps growing and becomes more complex (Figure 2C). At 18 div, neurons are mature and interconnected; the neuronal network is built (Figure 2D). Once the synaptic spines are formed and connected, neurons are fully polarized and express all functional and structural proteins. Of the many proteins expressed by mature cultured neurons, the neuronal receptor NMDA (Figure 2E) and the synaptic protein PSD95 (Figure 2F) have been chosen here as representative markers. Moreover, it is possible to selectively visualize axons by labeling neurofilament (NF) (Figure 2G) and visualizing dendrites by targeting the MAP2 protein (Figure 2H).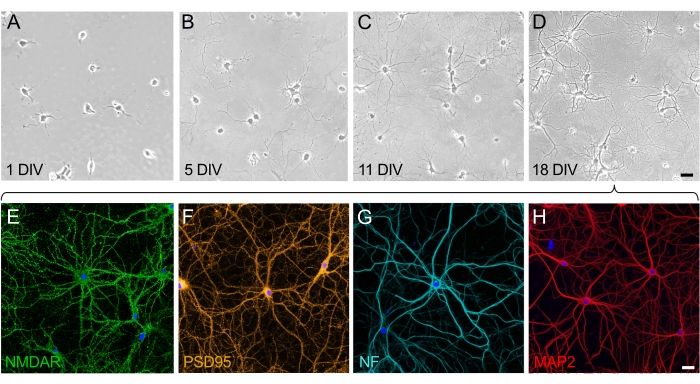
Figure 2: Time course of the maturation of dissociated-cell cultures of hippocampal neurons. (A-D) Phase-contrast images of hippocampal neurons during the first 18 days of culture. (A) Neurons at 1 div upon attachment to the PLL-coated substrate. (B) The emergence of small neurites in neurons at 5 div. (C) Neurons at 11 div have developed long neurites that elongate and acquire axonal characteristics. (D) Neurons at 18 div are mature and have formed a neural network. Scale bar (A-D) = 40 µm. (E-H) Representative fluorescent images taken by confocal laser scanning microscopy using selective markers to show mature neurons at 18 div. Neuronal cultures were fixed and immunostained with antibodies that selectively stain for (E) neuronal receptor (NMDAR), (F) synaptic marker (PSD95), (G) axonal marker (neurofilament, NF), and (H) dendritic marker (MAP2). Scale bar (E-H) = 20 µm. Please click here to view a larger version of this figure.
Antibodies in patient samples react with neuronal cell surface antigens
The samples (serum and CSF) obtained from patients that have anti-NMDAR encephalitis contain autoantibodies that recognize the NMDAR present on the surface of neurons. Incubation of the cultures with the patient samples produces an intense fluorescence signal on the cell surface and dendrites (Figure 3A,C). In contrast, control samples produce no fluorescence signal when administered to the neuronal cultures (Figure 3 B,D). These findings show how the cultures can be used to screen patient samples for antibodies and can lead to the identification of novel antibodies that target the neuronal cell surface.
CSF sample from the patient decreases the intracellular calcium concentration in NMDA-induced cultures of hippocampal neurons
To evaluate the effect of the patients' antibodies on the neural activity (after 24 h treatment), intracellular calcium transients were optically monitored from the cultured neurons in real-time upon NMDA-mediated stimulation. The application of NMDA generates an increase in the fluorescence intensity, as indicated by a change in the intracellular green fluorescence (Figure 4A and Supplemental Video 1). Neurons treated with the control CSF sample showed a higher difference in fluorescence intensity (56%) when the stimulator was applied in comparison to the cells treated with the patient CSF sample. The differences in fluorescence intensity were measured, and the NMDA-mediated stimulation curves from the data extracted from the soma of the cells were compared (Figure 4B,C). The stimulation curves show that there was an intracellular influx of calcium in both scenarios, but the cultures treated with the patients' CSF (gray line) showed a lower response than the control-treated cultures (black line). These results demonstrate that the antibodies present in the patients' CSF decrease the cellular activity due to the interaction of the antibodies with the NMDAR, and thus cause a pathogenic effect.
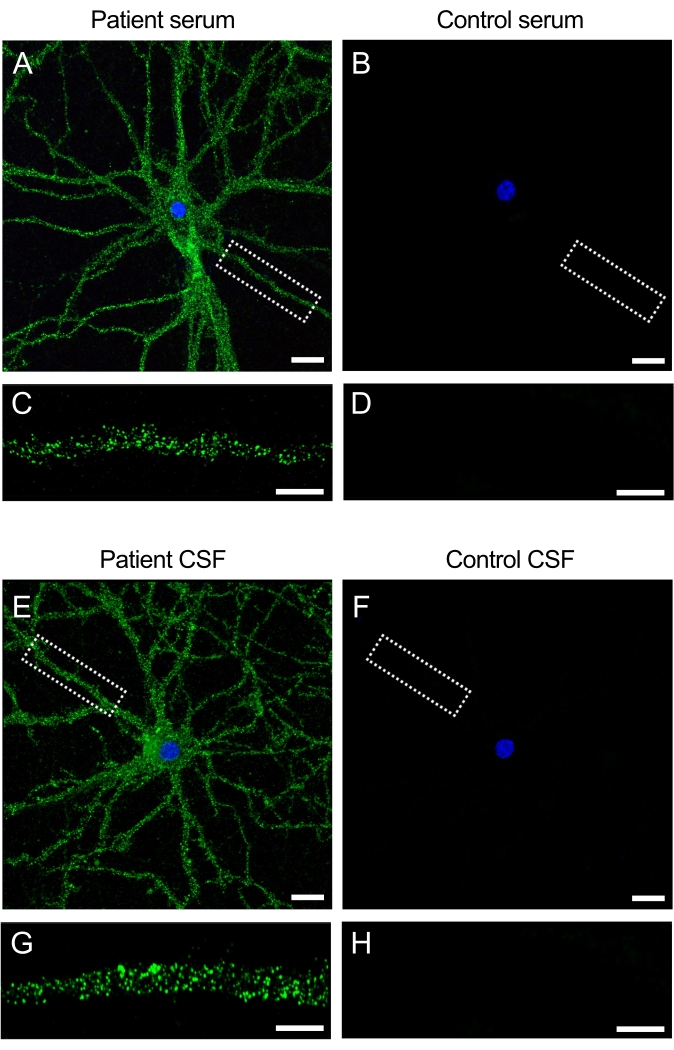
Figure 3: Patient antibodies react with the surface of neuronal cultures. (A,E) Serum and CSF from patients with anti-NMDAR encephalitis react with the cell surface of live rat hippocampal neurons, (B,F) whereas the serum and CSF from control subjects show no reactivity. Scale bar (A,B,E,F) = 20 µm. Higher magnification image of a dendrite (63x) showing the typical surface pattern of reactivity for (C,G) the patient's serum and CSF and (D,H) negative for controls. Images were taken by confocal laser scanning microscopy. Scale bar = 10 µm. Please click here to view a larger version of this figure.
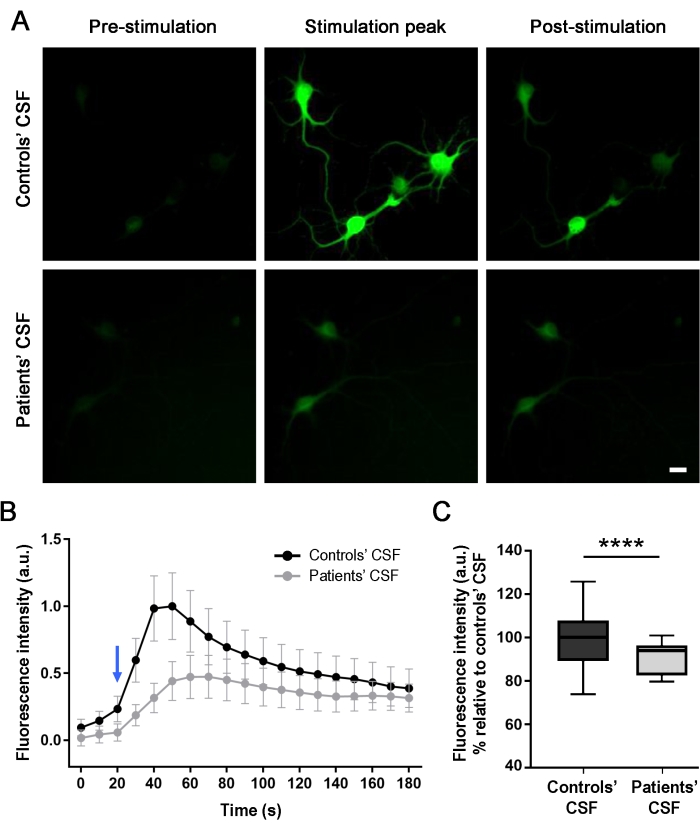
Figure 4: Patient antibodies reduce the calcium influx in rat neurons expressing GCaMP5G. (A) Administration of stimulation solution (NMDA [100 μM] + Glycine [1 μM]) in cultures of neurons triggered a calcium influx, as indicated by increasing intracellular green fluorescence (stimulation peak), compared with the image taken before the stimulation (pre-stimulation). After 120 s, the fluorescence intensity decreases and stabilizes (post-stimulation). Cultures treated with the patients' CSF showed a significant reduction (56%) in the NMDA-mediated calcium increase in comparison with the control's CSF. Images were taken by fluorescence microscopy. Scale bar = 20 μm. (B) A plot of one of the three independent experiments representing the fluorescence intensity over time (180 s) for the cultures treated with control's CSF (black line) and patients' CSF (gray line) upon NMDA stimulation (blue arrow). n(Controls' CSF) = 20 cells; n(Patients' CSF) = 28 cells. Data are represented as mean ± SEM. (C) Box plots show the median, 25th , and 75th percentiles. Whiskers indicate the minimum and maximum values. Assessment of significance was performed by two-way analysis of variance (ANOVA; p < 0.0001) and Mann-Whitney U tests (p < 0.0001). A value of p < 0.05 was considered statistically significant. Please click here to view a larger version of this figure.
Supplemental Video 1: Video showing two hippocampal neurons expressing GCaMP5G side by side: neuron treated with control's CSF (left) vs. neuron treated with patients' CSF (right). The application of NMDAR (stimulation) generates an increase in intracellular fluorescence intensity in both cases, but with a significantly higher level in the neuron treated with the control's CSF over the one treated with the patients' CSF. Images were taken by fluorescence microscopy and edited with ImageJ applying the lookup table (LUT) Fire. 1700 frames (170 s); accelerated 5 times. Scale bar = 10 µm. Please click here to download this File.
Discussion
The growing field of antibody-mediated autoimmunity has opened a window of opportunity for the identification of neuronal autoantibodies that can be used to improve the diagnosis and treatment of patients. Cultures of hippocampal neurons are an essential tool for antibody identification; therefore, it is important to perform a standardized protocol to obtain reliable and reproducible results. The most important steps to consider, limitations, and troubleshooting, are discussed here.
The critical steps of this protocol can be grouped into three categories depending on whether they affect the purity, the homogeneity, or the viability of the hippocampal neurons.
Purity - To obtain optimal primary cell cultures, the investigator must be confident, trained, and able to work quickly, especially to minimize the time of the dissection. Even if pyramidal neurons are the principal cell type, the hippocampus contains a variety of interneurons14. To generate cultures with minimal glial cells, the hippocampus must be extracted with the minimal surrounding tissue. The use of a black background during the dissection helps to identify the limits of the hippocampus under the stereomicroscope. In addition, it should be taken into account that lower cell densities result in less paracrine support and make it more difficult to maintain the culture13. So, it is important to keep this balance in mind. This is important in imaging studies that use a low number of cells (50,000 neurons per 3.5 cm dish). To be able to have additional time for the hippocampal extraction, Hibernate media that preserves the tissue should be used17. Working with adequate surgical tools is also essential. High precision tools are delicate, so the reproducibility of the technique should be ensured by carefully protecting them.
Homogeneity - To develop a culture without cell aggregates, the mechanical cell dissociation has been upgraded by combining the use of a pre-pulled glass pipettes with a standard 1,000 µL pipette.
Viability - In this protocol, no antibiotics were added because they influence neuronal excitability and alter the electrophysiological properties of the cultured neurons18. Therefore, contamination is very likely if the highest standards of sterility are not maintained. Temperature is also a key factor. Keeping the tissue cold during the hippocampal isolation slows down metabolism and decreases cell degradation. The tissue was, therefore, kept on ice until the cell dissociation process. Moreover, it is crucial to find the correct balance during the enzymatic cell dissociation that disaggregates the cells without marked cell lysis. In this protocol, the timings of incubation with trypsin and the subsequent washing steps have been optimized to obtain individual cells with enough space to allow the creation of an appropriate neuronal network.
Critical steps are also found in fluorescent live immunostaining and calcium activity recordings from the neuronal cultures. To perform successful live immunostaining for determining the presence of antibodies to cell surface proteins in patient samples, one must avoid permeabilization of the cells that would allow the antibodies access to intracellular proteins. Additionally, based on the titer of the antibodies, the incubation time and sample dilution have to be adjusted accordingly (e.g., very high titer antibodies can give background staining that makes interpreting the results difficult). When carrying out the pathogenicity assessment of the autoantibodies with calcium imaging, one needs to use a media that is optimal for cellular activity measurements (e.g., Mg2+ suppression in the culture medium is important for good performance). Moreover, for fluorescence imaging, media with pH indicators such as phenol red should be avoided as it introduces a non-specific background signal.
There are two main limitations of the use of hippocampal neuronal cultures. First, compared to stable cell lines, primary cultures must be continuously generated, and this implies the use of laboratory animals regularly. Induced pluripotent stem cell (iPSC) lines could replace the need for using animal models, but the differentiation protocols for iPSC are still not optimal. Secondly, neurons derived from iPSC do not express the full spectra of surface proteins and, therefore, if used, the absence of reactivity does not necessarily imply the negativity of the sample19.
There are three methods to screen for the presence of autoantibodies in the serum or CSF of patients suspected of having AE: tissue-based assay (TBA) using rat brain tissue, cell-based assay (CBA) using HEK cells transfected to express neuronal proteins, and the application reported here using live cultures of hippocampal neurons19. The importance of the cultured hippocampal neuron method lies in its ability to differentiate reactivity with surface and intracellular antigens that cannot easily be distinguished by TBA. Besides, primary neuronal cultures, unlike CBA in HEK transfected cells, are not limited by the repertoire of transfected proteins. Additionally, cultured hippocampal neurons can be used to identify novel antibodies and their target antigens when combined with immunoprecipitation and mass spectrometry and, therefore, broaden the spectrum of identifiable antibodies. Lastly, it allows the assessment of the pathogenic effects of the autoantibodies by live imaging methods that can monitor alterations in cellular activity. In conclusion, the identification of new autoantibodies eventually enables the initiation of specific immunotherapies to improve patient outcomes.
Disclosures
The authors have no conflicts of interest.
Acknowledgements
We thank Merche Rivas, Maria Marsal, Gustavo Castro, Jordi Cortés, Alina Hirschmann, and Angel Sandoval (ICFO-Institut de Ciències Fotòniques) and Mercedes Alba, Marija Radosevic, David Soto, Xavier Gasull, Mar Guasp, and Lidia Sabater (IDIBAPS, Hospital Clínic, University of Barcelona) for their technical support and for providing of reagents, and Josep Dalmau and Myrna R. Rosenfeld (IDIBAPS, Hospital Clínic, University of Barcelona) for their critical review of the manuscript and mentorship. This study was funded by Instituto de Salud Carlos III (ISCIII) and co-financed by the European Union, FIS (PI20/00280, J.P.), Fundació CELLEX (P.L-A.); Ministerio de Economía y Competitividad - Severo Ochoa program for Centres of Excellence in R&D (CEX2019-000910-S, P.L-A.); CERCA program and Laserlab-Europe (871124, P.L-A.); Ministerio de Ciencia e Innovación (MCIN/AEI/ 10.13039/501100011033, P.L-A.); and Fondo Social Europeo (PRE2020-095721, M.C.).
Materials
| Name | Company | Catalog Number | Comments |
|---|---|---|---|
| 10 cm Cell culture dish | Nunc | 12-565-020 | |
| 12 mm round coverslips | Fisher | NC9708845 | |
| 20x NA 0.75 S Fluor air objective | Nikon | CFI Super Fluor 20X | |
| 3.5 cm Cell culture dish | Nunc | 12-565-90 | |
| 6 cm Cell culture dish | Nunc | 12-565-94 | |
| B27 supplement | Gibco | 17504-044 | |
| Beaker 100 mL | Pirex | - | |
| Borax | Sigma-Aldrich | B9876 | |
| Boric Acid | Sigma-Aldrich | B0252 | |
| CaCl2 | Sigma-Aldrich | C1016 | |
| Curved forceps | FST | 11009-13 | |
| D-Glucose | Sigma-Aldrich | D9434 | |
| DMEM High Glucose (4.5 g/L), without L-Glutamine, without Phenol Red | Capricorn | DMEM-HXRXA | |
| Female Wistar rat (18-days pregnant) | Janvier | - | |
| Fetal Bovine Serum (FBS) | Biowest | S181B-500 | |
| Fine-angled forceps | FST | 11251-35 | |
| Fine-curved forceps | FST | 11272-30 | |
| Fine-straight forceps | FST | 11251-23 | |
| FITC filter cube | Nikon | Standard Series | |
| Forceps | FST | 11000-12 | |
| Goat anti-Human AF488 | Invitrogen | A11013 | |
| HBSS | Capricorn | HBSS-1A | |
| HEPES | Sigma-Aldrich | H3375 | |
| Hibernate-E medium | Gibco | A12476-01 | |
| Horse Serum (HS) | Thermofisher | 26050088 | |
| Human anti-NMDAR antibody (CSF) | Patient Sample | - | |
| Human anti-NMDAR antibody (Serum) | Patient Sample | - | |
| ImageJ/Fiji | NIH | v1.50i | |
| Inverted fluorescence microscope | Nikon | Eclipse TE2000-U | |
| KCl | Sigma-Aldrich | 44675 | |
| L-Glutamine | Biowest | X0550-100 | |
| Mercury lamp | Nikon | C-HGFI | |
| Microscope cell chamber | Custom-build | - | |
| NaCl | Sigma-Aldrich | S9887 | |
| NBQX | Tocris | 373 | |
| Neurobasal without phenol red | Gibco | 12348-017 | |
| NMDA | Sigma-Aldrich | M3262 | |
| pAAV2-CAG-GCaMP5G | VectorBiolabs | - | |
| Paraformaldehyde 4% | Thermo scientific | J199943-K2 | |
| Penicillin-Streptomycin | Biowest | L0022-100 | |
| Phosphate-Buffered Saline | Gibco | 10010023 | |
| Poly-L-Lysine (PLL) | Peptide international | OKK-35056 | |
| Polystyrene ice tray | - | - | re-used cap of a polysterene box |
| Precision spring-scissors | FST | 15000-08 | |
| ProLong Gold with DAPI (antifading mounting media) | Molecular Probes | P36941 | |
| Scissors | FST | 14068-12 | |
| Sodium pyruvate | Biowest | L0642-100 | |
| Stereo microscope | Zeiss | Stemi 2000 | |
| Surgery scissors | FST | 14081-09 | |
| Trypsin 2.5% | Gibco | 15090046 | |
| Water, sterile endotoxine free | Sigma-Aldrich | W3500 |
References
- Dalmau, J., Geis, C., Graus, F. Autoantibodies to synaptic receptors and neuronal cell surface proteins in autoimmune diseases of the central nervous system. Physiological Reviews. 97 (2), 839-887 (2017).
- Dalmau, J., Graus, F. Antibody-mediated encephalitis. The New England Journal of Medicine. 378 (9), 840-851 (2018).
- Dalmau, J., et al. Paraneoplastic anti- N -methyl-D-aspartate receptor encephalitis associated with ovarian teratoma. Annals of Neurology. 61 (1), 25-36 (2007).
- Dalmau, J., et al. Anti-NMDA-receptor encephalitis: case series and analysis of the effects of antibodies. Lancet Neurology. 7 (12), 1091-1098 (2008).
- Lai, M., et al. AMPA receptor antibodies in limbic encephalitis alter synaptic receptor location. Annals of Neurology. 65, 424-434 (2009).
- Lancaster, E., et al. Antibodies to the GABAB receptor in limbic encephalitis with seizures: case series and characterisation of the antigen. Lancet Neurology. 9 (1), 67-76 (2010).
- Lai, M., et al. Investigation of LGI1 as the antigen in limbic encephalitis previously attributed to potassium channels: a case series. Lancet Neurology. 9 (8), 776-785 (2010).
- Sabater, L., et al. A novel NREM and REM parasomnia with sleep breathing disorder associated with antibodies against IgLON5: a case series, pathological features, and characterization of the antigen. Lancet Neurology. 13 (6), 575-586 (2014).
- Hughes, E. G., et al. Cellular and synaptic mechanisms of anti-NMDA receptor encephalitis. The Journal of Neuroscience. 30 (17), 5866-5875 (2010).
- Moscato, E. H., et al. Acute mechanisms underlying antibody effects in anti-N-methyl-D-aspartate receptor encephalitis. Annals of Neurology. 76 (1), 108-119 (2014).
- Planagumà, J., et al. Human N-methyl D-aspartate receptor antibodies alter memory and behaviour in mice. Brain. 138 (1), 94-109 (2015).
- Banker, G. A., Cowan, W. M. Rat hippocampal neurons in dispersed cell culture. Brain Research. 126 (3), 397-425 (1977).
- Kaech, S., Banker, G. Culturing hippocampal neurons. Nature Protocols. 1 (5), 2406-2415 (2006).
- Benson, D. L., Watkins, F. H., Steward, O., Banker, G. Characterization of GABAergic neurons in hippocampal cell cultures. Journal of Neurocytology. 23 (5), 279-295 (1994).
- Banker, G., Goslin, K. Culturing Nerve Cells. , MIT Press. Cambridge, Massachusetts. (1998).
- Nunez, J. Primary culture of hippocampal neurons from P0 newborn rats. Journal of Visualized Experiments. (19), e895(2008).
- Brewer, G. J., Price, P. J. Viable cultured neurons in ambient carbon dioxide and hibernation storage for a month. Neuroreport. 7 (9), 1509-1512 (1996).
- Bahrami, F., Janahmadi, M. Antibiotic supplements affect electrophysiological properties and excitability of rat hippocampal pyramidal neurons in primary culture. Iranian Biomedical Journal. 17 (2), 101-106 (2013).
- Ricken, G., et al. Detection methods for autoantibodies in suspected autoimmune encephalitis. Frontiers in Neurology. 9, 841(2018).
Reprints and Permissions
