A neuronal lysosome proximity labeling proteomics protocol is described here to characterize the dynamic lysosomal microenvironment in human induced pluripotent stem cell-derived neurons. Lysosomal membrane proteins and proteins that interact with lysosomes (stably or transiently) can be accurately quantified in this method with excellent intracellular spatial resolution in live human neurons.
Method Article
Characterization of Neuronal Lysosome Interactome with Proximity Labeling Proteomics
* These authors contributed equally
In This Article
Summary
Abstract
Lysosomes frequently communicate with a variety of biomolecules to achieve the degradation and other diverse cellular functions. Lysosomes are critical to human brain function, as neurons are postmitotic and rely heavily on the autophagy-lysosome pathway to maintain cellular homeostasis. Despite advancements in the understanding of various lysosomal functions, capturing the highly dynamic communications between lysosomes and other cellular components is technically challenging, particularly in a high-throughput fashion. Here, a detailed protocol is provided for the recently published endogenous (knock-in) lysosome proximity labeling proteomic method in human induced pluripotent stem cell (hiPSC)-derived neurons.
Both lysosomal membrane proteins and proteins surrounding lysosomes within a 10-20 nm radius can be confidently identified and accurately quantified in live human neurons. Each step of the protocol is described in detail, i.e., hiPSC-neuron culture, proximity labeling, neuron harvest, fluorescence microscopy, biotinylated protein enrichment, protein digestion, LC-MS analysis, and data analysis. In summary, this unique endogenous lysosomal proximity labeling proteomics method provides a high-throughput and robust analytical tool to study the highly dynamic lysosomal activities in live human neurons.
Introduction
Lysosomes are catabolic organelles that degrade macromolecules via the lysosomal-autophagy pathway1. Besides degradation, lysosomes are involved in diverse cellular functions such as signaling transduction, nutrient sensing, and secretion2,3,4. Perturbations in lysosomal function have been implicated in lysosomal storage disorders, cancer, aging, and neurodegeneration3,5,6,7. For postmitotic and highly polarized neurons, lysosomes play critical roles in neuronal cellular homeostasis, neurotransmitter release, and long-distance transport along the axons8,9,10,11. However, investigating lysosomes in human neurons has been a challenging task. Recent advancements in induced pluripotent stem cell (iPSC)-derived neuron technologies have enabled the culture of live human neurons that were previously inaccessible, bridging the gap between animal models and human patients to study the human brain12,13. Particularly, the advanced i3Neuron technology stably integrates the neurogenin-2 transcription factor into the iPSC genome under a doxycycline-inducible promoter, driving iPSCs to differentiate into pure cortical neurons in 2 weeks14,15.
Due to the highly dynamic lysosomal activity, capturing lysosomal interactions with other cellular components is technically challenging, particularly in a high-throughput fashion. Proximity labeling technology is well-suited to studying these dynamic interactions because of its capability to capture both stable and transient/weak protein interactions with exceptional spatial specificity16,17. Engineered peroxidase or biotin ligase can be genetically fused to the bait protein. Upon activation, highly reactive biotin radicals are produced to covalently label neighboring proteins, which can then be enriched by streptavidin-coated beads for downstream bottom-up proteomics via liquid chromatography-mass spectrometry (LC-MS) platforms17,18,19,20,21.
An endogenous lysosomal proximity labeling proteomics method was recently developed to capture the dynamic lysosomal microenvironment in i3Neurons22. Engineered ascorbate peroxidase (APEX2) was knocked-in on the C-terminus of the lysosomal associated membrane protein 1 (LAMP1) in iPSCs, which can then be differentiated into cortical neurons. LAMP1 is an abundant lysosomal membrane protein and a classical lysosomal marker23. LAMP1 is also expressed in late endosomes, which mature into lysosomes; these late endosome-lysosomes and nondegradative lysosomes are all referred to as lysosomes in this protocol. This endogenous LAMP1-APEX probe, expressed at the physiological level, can reduce LAMP1 mislocalization and overexpression artifacts. Hundreds of lysosomal membrane proteins and lysosomal interactors can be identified and quantified with excellent spatial resolution in live human neurons.
Here, a detailed protocol for lysosome proximity labeling proteomics in human iPSC-derived neurons is described with further improvements from the recently published method22. The overall workflow is illustrated in Figure 1. The protocol includes hiPSC-derived neuron culture, proximity labeling activation in neurons, validation of APEX activity by fluorescence microscopy, determination of an optimal streptavidin beads-to-input protein ratio, enrichment of biotinylated proteins, on-beads protein digestion, peptide desalting and quantification, LC-MS analysis, and proteomics data analysis. Troubleshooting guidelines and experimental optimizations are also discussed to improve proximity labeling quality control and performance.
Protocol
All procedures were approved by the George Washington University biosafety and ethics committee. The compositions of media and buffers used in this protocol are provided in Table 1. The commercial product information used here is provided in the Table of Materials.
1. Human iPSC-derived neuron culture
- Human iPSC culture and LAMP1-APEX probe integration (7 days)
- Thaw Matrigel stock solution in an ice bucket at 4 °C overnight, aliquot 500 µL of the solution into cold sterile tubes, and store the aliquots at −80°C. Prepare 50 mL of coating solution by adding 500 µL of the Matrigel stock into 49.5 mL of cold DMEM/F12 medium.
NOTE: Keep the Matrigel cold and use prechilled conical tubes and pipette tips to prevent polymerization.Coating solution can be stored at 4 °C for 2 weeks. - Coat a 10 cm cell culture dish with 4 mL of coating solution for 1 h in a 37 °C incubator.
NOTE: Vitronectin can be an alternative coating solution at 5 µg/mL concentration and 2 h coating for iPSC culture. Vitronectin (single protein component) is more expensive than Matrigel but has less batch variations and cleaner background signals than Matrigel, which is extracted from mouse tumor with numerous extracellular matrix proteins. Non-treated tissue culture plate is needed for vitronectin coating. Matrigel coating works for both treated and non-treated tissue culture plates. - Thaw and plate 1-3 million hiPSCs on each coated 10 cm dish preloaded with 8 mL of Essential E8 complete medium supplemented with ROCK inhibitor (final concentration 10 µM Y-27632 or 50 nM Chroman1).
NOTE: Adding ROCK inhibitor (Y-27632 or Chroman1) to the stem cell culture medium minimizes dissociation-induced apoptosis after splitting and cryogenic preservation. Chroman1 has recently been shown to be more potent than Y-27632 at inhibiting both ROCK1 and ROCK224. - Change to 10 mL of E8 complete medium without ROCK inhibitor after the iPSCs form colonies, typically after 1-2 days. Maintain the iPSC culture in E8 complete medium and replace the supernatant with fresh medium every other day.
- Integrate the proximity labeling enzyme, engineered ascorbate peroxidase (APEX2), into the C-terminus of endogenous LAMP1 gene by CRISPR genome engineering. For detailed steps to generate an engineered stable cell line, refer to the previously published method (Frankenfield et al).22.
- Thaw Matrigel stock solution in an ice bucket at 4 °C overnight, aliquot 500 µL of the solution into cold sterile tubes, and store the aliquots at −80°C. Prepare 50 mL of coating solution by adding 500 µL of the Matrigel stock into 49.5 mL of cold DMEM/F12 medium.
- Human iPSC-neuron differentiation (3 days)
- Coat a 10 cm cell culture dish overnight with 4 mL of Matrigel coating solution in a 37 °C incubator before differentiation.
- Maintain hiPSCs until ~70% confluence. Gently wash the hiPSCs with phosphate-buffered saline (PBS) 2x to remove dead cells. Aspirate the PBS and add3 mL of Accutase to the 10 cm dish of cells. Shake the plate for even distribution and incubate for 8 min in a 37 °C incubator.
- Add 2 mL of PBS to wash and lift the cells from the plate and collect all cell solution in a 15 mL conical tube. Pellet the cells by centrifugation at 300 × g for 5 min. Plate 2-4 × 10⁶ hiPSCs onto a Matrigel-coated plate preloaded with 8 mL of warm neuron induction medium (Table 1). Evenly distribute the cells and place in a 37 °C incubator.
NOTE: Neuron differentiation is driven by a doxycycline-inducible transcription factor, neurogenin-2 (NGN2), which was overexpressed in this stable hiPSC cell line15. - Wash hiPSCs gently with PBS on day 1 of differentiation to remove dead cell debris. Replace with 10 mL of warm induction medium without ROCK inhibitor.
- Change with warm induction medium without ROCK inhibitor every day until day 3 of differentiation.
NOTE: Neurons are ready to be replated into neuronal medium.
- Plating neurons and maintaining neuron culture (10 days)
- Prepare 0.1 mg/mL Poly-L-Ornithine(PLO) coating solution in Borate buffer (Table 1).
- Coat a cell culture dish with the PLO coating solution in a 37 °C incubator for at least 1 h or overnight prior to plating day 3 neurons. Wash the dish with 4 mL of sterile water three times and let it air dry completely inside the biosafety cabinet.
- Dissociate day 3 neurons from each 10 cm dish with 3 mL of Accutase and plate 8-10 million cells onto each 10 cm PLO-coated dish preloaded with warm cortical neuron medium (Table 1).
- Perform a half-medium change every 2-3 days with warm neuron medium until the i3Neurons reach maturation in 2 weeks after differentiation.
2. In situ proximity labeling and neuron lysis (2 h)
- Prepare 500 mM biotin-phenol (BP) stock solution in dimethyl sulfoxide (DMSO) and store at −20 °C. On the day of proximity labeling, dilute the BP stock solution with warm neuron medium and treat the neurons at a final concentration of 500 µM for 30 min in a 37 °C incubator.
NOTE: Doxycycline is added in the neuron medium, which will activate APEX enzyme expression. Doxcycline needs to be added at least 24 h before the proximity labeling experiment. - Initiate the labeling reaction by adding H2O2 at a final concentration of 1 mM into the neuron culture and incubate for exactly 1 min. Immediately aspirate the medium and rinse 3 times with quench buffer (Table 1).
NOTE: H2O2 solution should be made fresh before the labeling reaction. The H2O2 activation needs to be exactly 1 min to reduce experimental variation and minimize oxidative stress caused by prolonged H2O2 treatment. - Tilt the plate to aspirate all the residual buffer. Add ice-cold cell lysis buffer (Table 1) directly onto the neuron plate. Use 100 µL of cell lysis buffer per 1 million neurons. Swirl the plate for sufficient cell lysis and place on ice.
- Scrape the cell lysates into cold 1.5 mL tubes. Sonicate in an ice-cold water bath using a bath sonicator (>100 W) for 15 min with alternating 40 s on, 20 s off cycles.
NOTE: Sufficiently lysed protein solution should be clear without pellets or excessive bubbles. Sufficient sonication of cell lysate is crucial to shear nucleic acids and reduce the stickiness of the cell lysate to reduce nonspecific binding in downstream procedures. A probe sonicator can also be used to provide stronger and faster cell lysis, but washing the probe between samples is required to minimize cross-contamination and sample loss. - Add cold acetone (−20 °C) to the sample at a 4-fold volume of lysis buffer. Vortex briefly and incubate at −20 °C for 3 h.
- Centrifuge at 16,500 × g for 10 min at 2 °C. Remove the supernatant without disturbing the protein pellet. Wash the pellet with 1 mL of −20 °C acetone 2x and remove the supernatant after centrifugation.
- Dry the protein pellet with a vacuum concentrator for 1 min. Add cell lysis buffer to completely dissolve the pellet. Sonicate briefly if needed. Store the samples at −80 °C.
NOTE: Acetone precipitation can remove residue biotin-phenol in the sample, which can interfere with downstream enrichment of biotinylated proteins.
3. Fluorescence microscopy to validate APEX localization and activity (1.5 days)
- Incubate the i3Neurons expressing endogenous LAMP1-APEX with 500 µM BP for 30 min at 37 °C. Activate the labeling with 1 mM H2O2 treatment for just 1 s to limit the diffusion of biotin cloud.
- Fix the cells immediately with 4% paraformaldehyde in the quench buffer and gently wash 3x with PBS.
NOTE: For a 10 cm dish, 4-6 mL is needed for a sufficient wash. - Block and permeabilize the cells using 3% donkey serum and 0.1% saponin in PBS for 30 min at room temperature (RT).
- Incubate the cells with primary anti-LAMP1 antibody (mouse monoclonal H3A4, 1:1,000) overnight at 4 °C.
- Wash the neurons 3 x gently with PBS. Incubate the neurons with anti-mouse AF561 secondary antibody (1:1,000) and Streptavidin-680 (1:1,000) for 1 h at RT.
- Wash 2x with PBS and incubate with Hoechst or 4',4-diamidino-2-phenylindole (DAPI) nuclear marker for 10 min at RT. Rinse the cells 2x with PBS.
- Visualize the fixed neurons under a fluorescence microscope. Observe biotinylated proteins stained with streptavidin and colocalized with LAMP1 staining outside the nucleus to validate the correct location of APEX activity.
4. Determining the streptavidin beads-to-input protein ratio (1.5 days)
- Perform detergent-compatible protein assay (DCA) to determine total protein concentrations in cell lysates
- Dissolve bovine serum albumin (BSA) protein standard in the cell lysis buffer at a concentration of 4 mg/mL. Prepare a series of BSA protein standard solutions (0.2-2 mg/mL, 5 dilutions) using the cell lysis buffer.
- Transfer 5 µL from each protein sample, BSA protein standard solution, and blank cell lysis buffer in triplicate into each well in a 96-well plate.
- Add 2 µL of reagent S per 1 mL of reagent A to get reagent A'. Add 25 µL of reagent A' to each well. Add 200 µL of reagent B to each well. Mix and pop bubbles if present.
- Incubate that 96-well plate at RT for 15 min, read the absorbance at 750 nm in a microplate reader, and quantify the concentrations of protein samples based on the BSA standard curve.
- Beads titration dot blot assay (1.5 days)
- Transfer a series of streptavidin magnetic beads slurry (20 µL, 15 µL, 12 µL, 10 µL, 8 µL, 4 µL, 1 µL, 0 µL) to PCR strip tubes. Put the PCR strip tubes on a magnetic rack, wash the beads 3x with 100 µL of 2% SDS buffer, and remove the wash buffer completely while on the magnetic rack.
- Add 50 µg of protein sample to each tube. Add more lysis buffer to a total volume of 80 µL. Close each tube tightly and rotate at 4 °C overnight.
- Centrifuge the PCR strip tubes briefly on a benchtop microcentrifuge. Place the PCR strip tubes on a magnetic rack for 1 min. Spot 2 µL of supernatant from each tube onto a dry nitrocellulose membrane and allow the membrane to dry completely.
NOTE: If the signal intensity is low, more than 2 µL can be spotted onto the membrane. The volume can be increased by spotting several times on the same spot after the membrane is air-dried between each time. A Bio-Dot Apparatus can also be used. - Incubate the membrane in blocking buffer (TBS) for 1 h. Incubate the membrane in Streptavidin Alexa Fluor 680 conjugate (1:1,000 in blocking buffer) for 1 h. Then, wash the membrane with TBS-T (Table 1) 5x.
NOTE: An alternative to the dot blot assay is western blotting using a streptavidin antibody. - Measure the fluorescent signal of each dot on the membrane under 680 nm wavelength, and generate a scatter plot with fluorescent signal over the volume of beads. Select the optimal volume of beads needed for 50 µg of input protein sample based on where the exponential decay of the curve ends .
NOTE: Fluorescence intensity represents the abundance of biotinylated proteins in the supernatant, which should decrease with increasing amounts of beads.
5. Enriching biotinylated proteins and on-beads digestion (3 days)
- Transfer protein lysate samples from −80 °C and sonicate the samples in 1.5 mL tubes for 30 s in a bath sonicator to quickly thaw the solutions. Vortex and place the sample tubes on ice.
- Transfer 250 µL of streptavidin (SA) magnetic beads slurry to each 1.5 mL tube. Put the tubes on a magnetic rack, wash the beads 3x with 1 mL of Wash Buffer A (2% SDS), and remove the residual buffer.
- Based on the results of the dot blot assay and DC protein assay, calculate the amount of protein sample (µg) needed for 250 µL of the streptavidin magnetic beads slurry.
NOTE: In this endogenously expressed LAMP1-APEX probe, 5 µL of beads are needed for 50 µg of input protein. Therefore, 2.5 mg of total protein is added to 250 µL of beads. Less than 250 µL of SA beads may be used for limited input sample material. - Add cell lysis buffer to the tube containing the magnetic bead-lysate mixture to a total volume of 1 mL and rotate at 4 °C overnight.
NOTE: Samples from different groups or replicates should be normalized to the same protein concentration, volume, and amount of beads to reduce experimental variations. - Spin down all the tubes briefly on a benchtop microcentrifuge and place the tubes on a magnetic rack for 1 min. Remove the supernatant while on the magnetic rack.
NOTE: It is critical to wait for 1 min after placing the sample tubes on the magnetic rack every time. This can minimize bead loss due to the invisible small amount of beads still moving toward the magnet in the solution. - Wash the beads 2x with 1 mL of Wash Buffer A at RT (5 min rotation each time). Repeat the process with each wash buffer 2x sequentially at 4 °C. (Buffer B, Buffer C, and Buffer D; Table 1).
NOTE: A high concentration of SDS solution can precipitate at cold temperatures. The first wash must be performed at RT. - Put the tubes on the magnetic rack. Wash the beads 2x with Buffer D to completely remove residual detergent. Resuspend the beads in 100 µL of 50 mM Tris buffer and add 5 mM TCEP (final concentration) to incubate for 30 min at 37 °C in a temperature-controlled mixer, shaking at 1,200 rpm.
- Add 15 mM iodoacetamide (IAA, final concentration) to each tube and incubate for 30 min at 37 °C in a temperature-controlled mixer, shaking at 1,200 rpm in the dark (mixer cap on).
NOTE: IAA is light-sensitive and should be made fresh 5 min before this step. - Add 5 mM TCEP (final concentration) to quench excess IAA. Incubate for 10 min at 37 °C in a temperature-controlled mixer with shaking at 1,200 rpm (mixer cap off).
- Centrifuge the sample tubes briefly and place on a magnetic rack for 1 min to remove the supernatant. Add 200 µL of 5 mM TCEP in 50 mM Tris buffer to resuspend the beads. Add 1 µg of Trypsin/Lys-C mix to the sample, and incubate for 14 h at 37 °C in a temperature-controlled mixer, shaking at 1,200 rpm.
- Add an additional 0.2 µg of Trypsin/Lys-C mix and digest for 3 h.
- Spin down the sample tubes briefly and put the tubes on a magnetic rack for 1 min. Transfer the peptide supernatant to clean the tubes while on a magnetic rack. Wash the beads with 50 µL of 50 mM Tris buffer (shaking for 5 min) and combine the peptide supernatants.
- Add 30 µL of 10% trifluoroacetic acid (TFA) to the tube containing peptide supernatant to get pH <3.
6. Peptide desalting and fractionation (2 h)
- Wet the reverse-phase solid phase extraction plate (only the wells for use) with 200 µL of HPLC grade methanol (MeOH) 3x on the vacuum manifold. Add 200 µL of 1% TFA in HPLC grade water 3x to equilibrate the plate.
- Load the peptide samples into the plate, slowly turning on the vacuum for a flow speed lower than 3 droplets/s to minimize sample loss.
- Wash the extraction plate 3x with 200 µL of 1% TFA. Wash the extraction plate again with 200 µL of 1% TFA containing 2% MeOH (v/v). Keep the flow speed lower than 3 droplets/s.
- Replace the collection plate with a 96-well collection plate. If no fractionation is needed, elute the peptide samples 3x with 100 µL of 1% TFA containing 80% MeOH and combine in a new sample tube. Dry the peptide samples in a vacuum concentrator with no heat.
NOTE: If fractionation is desired, peptide samples can be eluted into 4 fractions subsequently using 200 µL of 1% TFA containing 15%, 35%, 50%, and 90% MeOH, respectively, in a different collection plate.
7. Colorimetric peptide quantification assay (optional) (1 h)
- Resuspend peptide samples in 50 µL of LC-MS grade water and take 20 µL aliquots to perform the peptide assay.
NOTE: This step consumes a large amount of peptide sample but can provide an accurate quantification of peptide concentration before LC-MS analysis. This is typically conducted only once per sample type for testing before large-scale sample preparation. - Prepare serial dilutions of the peptide standard solutions (provided in the colorimetric assay kit) in the LC-MS grade water. Prepare the working reagent by mixing 50% Reagent A, 48% Reagent B, and 2% Reagent C.
- Transfer 20 µL of each peptide standard solution (three replicates) and the unknown peptide sample into a 96-well microplate. Add 180 µL of the working reagent to each well, mix well, and incubate the plate for 30 min at RT.
- Read the absorbance at 480 nm in a microplate reader and quantify the concentrations of peptide samples based on the peptide standard curve.
8. LC-MS analysis
- Resuspend the peptide samples in LC Buffer A (2% acetonitrile and 0.1% formic acid, LC-MS grade). Centrifuge at 16,500 × g for 10 min at 4 °C to get rid of any possible particulates.
- Transfer the supernatant to LC-MS vials. Analyze the samples using a nanoLC-MS instrument.
NOTE: Detailed LC-MS/MS parameters are instrument-dependent and have been described previously22,25,26. - Generate a custom LC-MS exclusion list with a range of retention times for highly abundant contaminant peptide peaks such as streptavidin and trypsin with 5 ppm mass accuracy22 (e.g., common streptavidin peptide peaks are m/z 402.5435 [charge 3], m/z 603.3117 [charge 2], m/z 654.9733 [charge 3], m/z 678.6812 [charge 3], m/z 1017.5182 [charge 2], etc.; common trypsin peptide peaks are m/z 421.7584 [charge 2], m/z 523.2855 [charge 2], and m/z 737.7062 [charge 3]).
9. Proteomics data analysis
- Analyze the LC-MS raw data with proteomics data analysis software such as Proteome Discoverer, MaxQuant27, or MS-Fragger28. Include two FASTA libraries for data analysis: 1) a Swissprot Homo Sapiens reference database; 2) a newly generated universal contaminant FASTA library (https://github.com/HaoGroup-ProtContLib), which was proven to improve proteomics identification and decrease false discoveries29.
- Set up the proteomics data analysis parameters with a 1% false discovery rate (FDR) cutoff for protein and peptide spectral matching (PSM) identifications. Select trypsin digestion with a maximum of three missed cleavages, a fixed modification of cysteine carbamidomethylation, and a variable modification of methionine oxidation and protein N-terminal acetylation. Use peptide MS1 peak intensities for label-free quantification. Normalize the peptide intensities to the endogenously biotinylated carboxylase, propionyl-CoA carboxylase (PCCA), to reduce proximity labeling variations, as described previously22.
NOTE: PCCA normalization can be selected in Proteome Discoverer software by including a PCCA protein sequence FASTA file. Alternatively, PCCA normalization can be conducted in the downstream data analysis. - Export protein-level results from the proteomics software. Remove contaminant proteins prior to statistical analysis29. Remove proteins with only 1 PSM or no quantification result. Conduct protein gene ontology (GO)-term analysis with Enrichr30 and protein network analysis with STRING31.
Results
This lysosome proximity labeling proteomics study was conducted in human iPSC-derived neurons to capture the dynamic lysosomal microenvironment in situ in live neurons. Cell morphologies of hiPSCs and hiPSC-derived neurons at different time points are illustrated in Figure 2A. Human iPSCs grow in colonies in E8 medium. Differentiation is initiated by plating iPSCs into doxycycline-containing neuron induction medium. Neurite extensions become more visible each day during the 3 day differentiation. After switching to PLO-coated plates in neuron medium, the neurites form a network between neurons, and axonal extensions become more visible as the neurons reach maturation in 2 weeks. In i3Neurons, the localization of the APEX probe is validated by fluorescence microscopy following rapid APEX activation. Biotinylated proteins are stained using streptavidin (SA) antibody, and lysosomes are stained using anti-LAMP1 antibody. The merged image validates the correct localization of LAMP1-APEX to the bait protein (Figure 2B).
The bead-titration assay is crucial to determine the optimal beads-to-protein ratio so that the amount of streptavidin beads is enough to enrich all the biotinylated proteins but not so excessive to cause serious streptavidin contamination in LC-MS. The optimal volume of beads needed for 50 µg of input protein sample is selected on the basis of where the exponential decay of the curve ends (Figure 3A) As shown in Figure 3A, dot-blot signals from the beads-protein incubation supernatant decreased as more biotinylated proteins were captured with increased amounts of the streptavidin beads. For endogenous LAMP1-APEX samples, 5 µL of streptavidin beads were optimal for 50 µg of input protein (highlighted in Figure 3A). Following enrichment, the amount of protein captured by the streptavidin beads is unknown. Excess proteolytic enzyme (trypsin) can increase enzyme autodigestion, with abundant trypsin peptide peaks in LC-MS. Excessive trypsin can also digest more streptavidin peptides in the samples. Therefore, the amount of protease needed for on-beads digestion should be optimized. Compared to trypsin alone, on-beads digestion with Trypsin/Lys-C mix resulted in the identification of more proteins and peptides and fewer missed cleavages (Figure 3B). Additionally, 1-1.5 µg of protease per 250 µL of streptavidin magnetic beads was optimal to obtain the highest number of identified proteins and the lowest percentage of missed cleavages (Figure 3C). With an optimal beads-to-protein ratio, the same amount of beads should capture the same amount of biotinylated proteins. Therefore, this optimized protease amount can be used for all experiments that enrich biotinylated proteins using the same streptavidin magnetic beads.
Peroxidase-based proximity labeling enzymes are activated by biotin-phenol incubation and brief H2O2 treatment (1 min). This step is a major source of variation in proximity-labeling proteomics. We previously found that normalization to the most abundant, endogenously biotinylated carboxylase, PCCA, can significantly reduce experimental variations, allowing the comparison of proximity labeling proteomics data across different experimental batches (Figure 4)22. For endogenous LAMP1-APEX neurons, the parental line without LAMP1-APEX probe expression was used as a control group. Control neurons were also treated with biotin-phenol and H2O2. The distribution of protein ratios of LAMP1-APEX versus the control group is illustrated in Figure 5A. All the endogenously biotinylated carboxylases were enriched by streptavidin-coated beads but remained unchanged. As shown in the GO-term analysis and protein network analysis (Figure 5B,C), both stable lysosomal membrane proteins and transient lysosomal interactors related to endolysosomal trafficking and transport were enriched in LAMP1-APEX proteomics32,33,34.
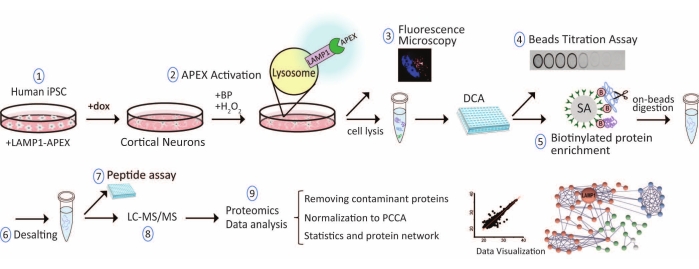
Figure 1: Overall workflow for lysosome proximity labeling proteomics in hiPSC-derived neurons. Abbreviations: hiPSC = human induced pluripotent stem cell; LAMP1 = lysosomal associated membrane protein 1; APEX = ascorbate peroxidase; dox = doxycycline; BP = biotin-phenol; DCA = detergent-compatible protein assay; SA = streptavidin; LC-MS/MS = liquid chromatography-tandem mass spectrometry; PCCA = propionyl-CoA carboxylase, an endogenously biotinylated protein. Please click here to view a larger version of this figure.
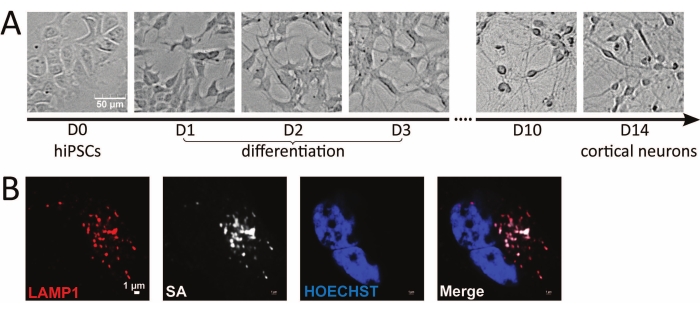
Figure 2: Microscopic imaging of hiPSC-derived neurons and LAMP1-APEX activity. (A) Brightfield microscopy images of different stages of hiPSCs and hiPSC-derived neurons. (B) Fluorescence imaging of LAMP1-APEX activity in the neuron. Biotinylated signals stained against streptavidin colocalize with LAMP1 staining outside the nucleus (HOECHST). Scale bars = (A) 50 µm, (B) 1 µm. Abbreviations: hiPSC = human induced pluripotent stem cell; LAMP1 = lysosomal associated membrane protein 1; APEX = ascorbate peroxidase; SA = streptavidin. Please click here to view a larger version of this figure.
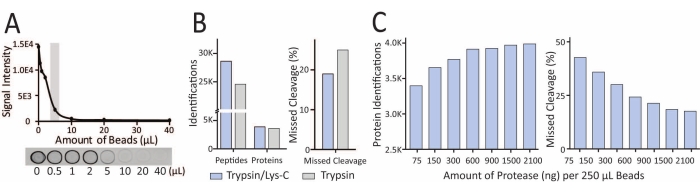
Figure 3: Optimization of beads-to-input protein ratio and enzymatic protein digestion can improve protein identifications and reduce interference. (A) Example of beads-titration assay results from dot-blot assay using 50 µg of input protein and different amounts of streptavidin beads. (B) Trypsin/Lys-C mix resulted in better protein/peptide identification and fewer missed cleavages than trypsin alone. (C) Optimization of the amount of Trypsin/Lys-C for on-beads digestion. This figure has been modified from Frankenfield et al.22. Please click here to view a larger version of this figure.
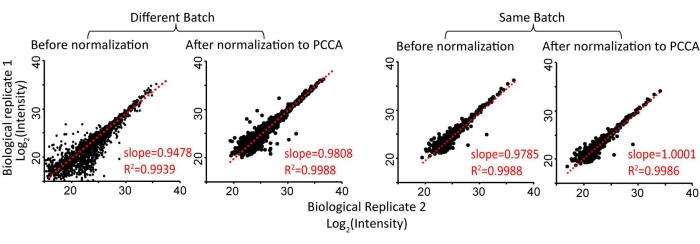
Figure 4: Normalization of proximity labeling proteomics data to an endogenously biotinylated carboxylase, PCCA, can reduce quantification variations among biological replicates. This figure has been modified from Frankenfield et al.22. Abbreviation: PCCA = propionyl-CoA carboxylase. Please click here to view a larger version of this figure.
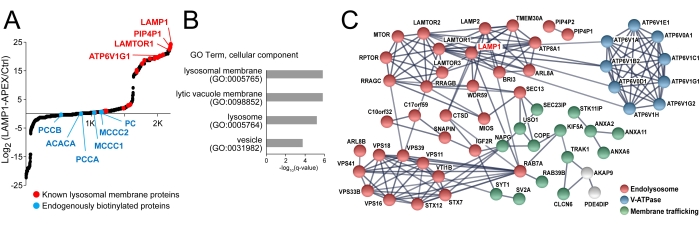
Figure 5: Lysosome proximity labeling proteomics enriched lysosomal membrane proteins and lysosomal interacting proteins in neurons. (A) Scatter plot of protein abundance ratios of LAMP1-APEX versus no APEX control showing enriched lysosomal membrane proteins and unchanged endogenously biotinylated proteins. (B) GO-term analysis of proteomics results proving enriched cellular component at the lysosome. (C) STRING protein network analysis showing that proteins directly interact with the bait protein (LAMP1), lysosomal membrane proteins, and lysosomal interactors such as membrane trafficking proteins. This figure has been modified from Frankenfield et al.22. Abbreviations: LAMP1 = lysosomal associated membrane protein 1; APEX = ascorbate peroxidase; GO = gene ontology. Please click here to view a larger version of this figure.
| Medium/Buffer | Component | Protocol | ||
| Basement membrane matrix (Matrigel) coating solution | 1% basement membrane matrix stock, 99% DMEM/F12 medium | 1.1, 1.2 | ||
| Vitronectin coating solution | 5 μg/mL final concentration in PBS | 1.1 | ||
| E8 complete medium with ROCK inhibitor | 98% E8 medium, 2% E8 supplement, 10 µM Y-27632 or 50 nM Chroman1 | 1.1 | ||
| Neuron Induction medium | 97% DMEM/F12 with HEPES, 1% N2 supplement, 1% non-essential amino acids (NEAA), 1% L-glutamine, 2 μg/mL doxycycline and ROCK inhibitor (10 μM Y-27632 or 5 nM Chroman 1) | 1.2 | ||
| Neuron PLO coating solution | 0.1 mg/mL Poly-L-Ornithine (PLO), 100 mM boric acid, 25 mM sodium tetraborate, 75 mM sodium chloride, 1 M sodium hydroxide | 1.3 | ||
| Neuron medium | 98% cortical neuron medium, 2% B27 supplement, 10 ng/mL brain-derived neurotrophic factor (BDNF), 10 ng/mL glial-derived neurotrophic factor (GDNF), 10 ng/mL NT-3, 0.2 µg/mL Laminin, 2 μg/mL doxycycline | 1.3 | ||
| Quench buffer | 10 mM sodium azide, 10 mM sodium ascorbate, 5 mM TROLOX in PBS | 2.2 | ||
| Cell lysis buffer | 50 mM Tris-HCl, 500 mM NaCl, 0.2% SDS, 1% Triton, 1 mM Tris(2-carboxyethyl)phosphine hydrochloride (TCEP), 10 mM sodium azide, 10 mM sodium ascorbate, 5 mM TROLOX, protease inhibitor cocktail | 2.3 | ||
| TBS-T | 0.05% Tween20, 20 mM Tris, 150 mM NaCl (pH 7.5) | 4.2 | ||
| Buffer A | 2% SDS buffer | 5.2 | ||
| Buffer B | 50 mM Tris-HCl, 500 mM NaCl, 2% Triton-X | 5.6 | ||
| Buffer C | 50 mM Tris-HCl, 250 mM NaCl, 0.5% SDS, 0.5% Triton-X | 5.6 | ||
| Buffer D | 2 M Urea, 50 mM Tris-HCl | 5.6 | ||
Table 1: Compositions of media and buffers used in this protocol.
| Problem | Protocol | Solution/Suggestion | ||||
| iPSC culture peeling off the plate | 1.1 | Increase vitronectin coating concentration or time. | ||||
| Some iPSCs did not differentiate into neurons | 1.2 | Increase cell detachment solution treatment time to completely dissociate iPSCs during d0 differentitation. | ||||
| Neuron culture peeling off the plate | 1.3 | Washing and changing the medium must be gentle and from the side wall of the plate. | ||||
| Proteins do not dissolve completely after acetone precipitation | 2.7 | Reduce drying time of the protein pellet. Increase the volume of lysis buffer and sonicate briefly to help dissolution. | ||||
| Weak streptavidin staining signals | 3 | Increase H2O2 treatment time to be 2-3 s and swirl the plate for even distribution. | ||||
| Low signal of beads titration assay | 4.2 | Wait until membrane is completely dried and add more supernatant to the same spot (can repeat up to 3x) to enhance the signal intensity. | ||||
| Magnetic beads not pelleting towards magnetic rack | 5 | Magnetic bead mobility decreases in non-detergent containing buffer. Higher urea concentration up to 4 M or LC-MS-compatible detergent can be used in wash buffer D. | ||||
| Magnetic beads loss during beads wash | 5 | Increase the waiting time when sample tubes are placed on the magnetic beads (1 min or longer) before taking supernatant from the tubes. | ||||
| Singly charged contamination peaks in LC-MS | 6 | Peptide cleanup not sufficient. Increase washing volumes and times during peptide desalting. | ||||
| Peptide assay low signal | 7 | Resuspend peptide samples in lower volume to increase peptide concentration. | ||||
| Overwhelming streptavidin signals in LC-MS | 8 | Reduce the amount of streptavidin beads. If trypsin peak is also abundant, reduce trypsin amount. | ||||
| Too many nonspecific labeling background | 9 | Streptavidin beads wash was not sufficient. Remove all residual liquid during each washing step. Increase the time and volume for beads wash. | ||||
Table 2: Troubleshooting problems and solutions.
Discussion
Using this LAMP1-APEX probe, proteins on and near the lysosomal membrane are biotinylated and enriched. Given the typical lysosome diameter of 100-1,200 nm, this method provides excellent intracellular resolution with a 10-20 nm labeling radius. LAMP1 is an abundant lysosomal membrane protein and a classical marker for lysosomes, serving as an excellent bait protein for lysosomal APEX labeling at the endogenous expression level. However, limitations also exist when using LAMP1 to target lysosomes, as LAMP1 is also present in late endosomes and nondegradative lysosomes35. Most lysosomal markers are also expressed in late endosomes, which eventually mature into lysosomes. Alternative bait proteins to target lysosomes are LAMPTOR, LAMP2, and TMEM19235,36,37. It is important to note that reactive biotin radicals do not penetrate the membrane. Therefore, most lysosomal lumen-only proteins are not captured in this LAMP1-APEX proteomics method. Lysosomal lumen proteins can be obtained by lysosomal isolation via the traditional gradient centrifugation method or lysosomal immunopurification4,38. However, proteins on the lysosomal membrane may be disrupted during lysosomal isolation and lose the information for transient and dynamic lysosomal interactions. Therefore, lysosomal proximity labeling and lysosomal isolation can be combined to obtain a complete snapshot of lysosomal activities both outside and inside lysosomes.
To minimize variability from iPSC-neuron culture, the neuron plating density must be consistent across all biological replicates and comparison groups. The same levels of neuronal maturation and health are also critical for this reason. During APEX activation, biotin-phenol and H2O2 addition to the cells must be conducted by prior mixing with warm culture medium and then adding the mixture to the cells, followed by immediate, gentle shaking to ensure even distribution. The use of H2O2 also raises concerns about oxidative stress and perturbations in the dynamic microenvironment of the cell. Although no significant changes were found at the protein abundance level, more peptides were modified with methionine oxidation in the H2O2-treated versus control neurons22. Therefore, strict control of the H2O2 activation time (1 min) is critical to minimize oxidative stress and reduce the diffusion of biotin cloud to ensure a specific labeling radius surrounding the bait protein.
For nonpolarized cell lines such as HEK and U2OS, cells can be harvested by pelleting after proximity labeling to remove the supernatant containing free biotin. However, neurons must be harvested by directly adding cell lysis buffer to the plate and scraping into tubes to avoid neurite damage and sample loss during pelleting. The presence of free biotin can saturate the streptavidin beads. The complete removal of free biotin can be achieved by multiple washes and incubation with quench buffer in neurons and/or protein precipitation after cell lysis. As different bait proteins have different expression levels, a dot blot assay needs to be conducted for each new APEX probe. Once the optimal beads/protein ratio is determined, the amount of starting protein and beads volume should be consistent for all replicates for the same APEX probe. When comparing different probes, such as LAMP1-APEX versus cytosolic-APEX, it is recommended to use the same volume of beads but vary the amount of starting protein to reflect the optimal beads/protein ratios for different APEX probes. To further reduce experimental variations and increase throughput, stable isotope labeling by amino acids in cell culture (SILAC) can be conducted39. Multiplexed isobaric labeling can also be used to chemically label peptides after protein digestion via TMT/iTRAQ/DiLeu tags20,40,41,42.
Proximity labeling has been widely applied to capture the cellular and molecular microenvironment in various organisms43. However, proximity labeling still faces many technical challenges, such as contamination from streptavidin signals, the use of hydrogen peroxide for enzyme activation, and the presence of endogenously biotinylated mitochondrial carboxylases. Therefore, proximity labeling proteomic experiments require careful planning and quality control. To help researchers troubleshoot their proximity labeling experiment, we provide a brief guide for common problems and solutions in Table 2. Most recently, a cleavable proximity labeling method was developed using thiol-cleavable biotin25. Biotinylated proteins can, therefore, be cleaved off beads using a reducing reagent such as TCEP without the need for on-beads digestion. This cleavable biotin method can dramatically reduce interference signals from streptavidin, endogenously biotinylated carboxylases, and nonspecific binding. Ongoing efforts will apply this cleavable biotin method to LAMP1-APEX proteomics to improve labeling specificity and accuracy. Proximity labeling probes can also be designed to target other subcellular compartments44. The amount and type of proteins identified are dependent on the nature of the bait protein, its intracellular environment, and the expression level of the proximity labeling probe. This endogenous LAMP1-APEX proteomics method provides a valuable tool to study the dynamic lysosomal activity in human neurons. The detailed protocol and methodology optimization are also applicable to other proximity labeling probes and chemical biotinylation, serving as a useful resource for the proteomics community.
Disclosures
The authors declare no competing financial interests.
Acknowledgements
This study is supported by the NIH grant (R01NS121608). A.M.F. acknowledges the ARCS-Metro Washington Chapter Scholarship and the Bourbon F. Scribner Endowment Fellowship. We thank the Michael Ward lab at the National Institute for Neurological Disorders and Stroke (NINDS) for molecular biology support and the i3Neuron technology development.
Materials
| Name | Company | Catalog Number | Comments |
|---|---|---|---|
| 10% (w/v) Saponin solution | Acros Organics | 419231000 | Flourescent Microscopy |
| Accutase | Life Technologies | A1110501 | cell detachment solution, Cell Culture |
| B27 Supplement | Fisher Scientific | 17504044 | Cell Culture, Cortical Neuron Medium |
| BDNF | PeproTech | 450-02 | Cell Culture, Cortical Neuron Medium |
| Boric acid | Sigma-Aldrich | B6768 | Cell Culture, Borate Buffer |
| Bovine Serum Albumin | Millipore Sigma | A8806 | To make standard solutions to measure total protein concentrations |
| Brainphys neuronal medium | STEMCELL Technologies | 5790 | Cell Culture, Cortical Neuron Medium |
| CD45R (B220) Antibody Alexa Fluor 561 | Thermo Fisher Scientific | 505-0452-82 | Flourescent Microscopy |
| Chroman1 ROCK inhibitor | Tocris | 716310 | Cell Culture |
| cOmplete mini Protease Inhibitor | Roche | 4693123001 | cocktail inhibitor in Lysis Buffer |
| DC Protein Assay Kit II | Bio-Rad | 5000112 | To determine total protein concentrations of cell lysate |
| Dimethyl sulfoxide (DMSO) | Sigma-Aldrich | D8418 | Proximity-labeling Reaction |
| DMEM/F12 medium | Thermo Fisher Scientific | 11320082 | Cell Culture, Dish Coating |
| DMEM/F12 medium with HEPES | Thermo Fisher Scientific | 11330057 | Cell Culture, Induction Medium |
| Donkey serum | Sigma-Aldrich | D9663 | Flourescent Microscopy |
| Doxycycline hyclate, ≥98% (HPLC) | Sigma-Aldrich | D9891-1G | Cell Culture, Induction Medium |
| Essential 8 Medium | Thermo Fisher Scientific | A1517001 | Cell Culture |
| Essential 8 Supplement (50x) | Thermo Fisher Scientific | A1517101 | Cell Culture |
| Extraction plate vacuum manifold kit | Waters | WAT097944 | For Peptide desalting |
| Formic Acid (FA) | Fisher Scientific | A11750 | For LC-MS analysis |
| GDNF | PeproTech | 450-10 | Cell Culture, Cortical Neuron Medium |
| Hoechst dye | Thermo Fisher Scientific | 62239 | Flourescent Microscopy |
| HPLC grade methanol | Fisher Scientific | A452 | For Peptide desalting |
| HPLC grade water | Fisher Scientific | W5 | For Peptide desalting |
| Human induced pluripotent stem cells | Corriell Institute | GM25256 | Cell Culture |
| Hydrogen peroxide, ACS, 29-32% w/w aq. soln., stab. | Thermo Fisher Scientific | AA33323AD | Proximity-labeling Reaction |
| Iodoacetamide (IAA) | Millipore Sigma | I6125 | For Protein Digestion |
| Laminin | Fisher Scientific | 23017015 | Cell Culture, Cortical Neuron Medium |
| LC-MS grade Acetonitrile | Fisher Scientific | A955 | For LC-MS analysis |
| LC-MS grade water | Fisher Scientific | W64 | For LC-MS analysis |
| L-glutamine | Fisher Scientific | 25-030-081 | Cell Culture, Induction Medium |
| Matrigel | Thermo Fisher Scientific | 08-774-552 | basement membrane matrix, Cell Culture, Dish Coating |
| Mouse anti-human LAMP1 monoclonal antibody | Developmental Studies Hybridoma Bank | h4a3 | Flourescent Microscopy |
| N-2 Supplement (100x) | Fisher Scientific | 17-502-048 | Cell Culture, Induction Medium |
| Nitrocellulose Membrane, Precut, 0.45 µm, 7 x 8.5 cm | Bio-Rad | 1620145 | To conduct dot blot assay for bead titration |
| Non-essential amino acids (NEAA) | Fisher Scientific | 11-140-050 | Cell Culture, Induction Medium |
| NT-3 | PeproTech | 450-03 | Cell Culture, Cortical Neuron Medium |
| Oasis HLB 96-well solid phase extraction plate | Waters | 186000309 | For Peptide desalting |
| Odyssey Blocking Buffer (TBS) | LI-COR Biosciences | 927-50000 | To conduct dot blot assay for bead titration |
| Paraformaldehyde | Electron Microscopy Sciences | 15710 | Flourescent Microscopy |
| Phenol Biotin (1,000x stock) | Adipogen | 41994-02-9 | Proximity-labeling Reaction |
| Phosphate-buffered saline (PBS) without calcium or magnesium | Gibco | 10010049 | Cell Culture, Proximity-labeling Reaction, Flourescent Microscopy |
| Pierce Quantitative Colorimetric Peptide Assay | Thermo Fisher | 23275 | Peptide Concentration Assay |
| Poly-L-Ornithine (PLO) | Millipore Sigma | P3655 | Cell Culture, Dish Coating |
| Sodium Ascorbate | Sigma-Aldrich | A4034 | Proximity-Labeling Quench Buffer, Lysis Buffer |
| Sodium azide | Sigma-Aldrich | S8032 | Proximity-Labeling Quench Buffer, Lysis Buffer, Flourescent Microscopy |
| Sodium chloride | Thermo Fisher Scientific | S271500 | Cell Culture, Borate Buffer |
| Sodium dodecyl sulfate (SDS) | Thermo Fisher Scientific | BP1311220 | Lysis Buffer, Dot blot assay buffer, Beads wash buffer |
| Sodium hydroxide | Sigma-Aldrich | 415413 | Cell Culture, Borate Buffer |
| Sodium tetraborate | Sigma-Aldrich | 221732 | Cell Culture, Borate Buffer |
| SpeedVac concentrator | vacuum concentrator | ||
| Streptavidin Magnetic Sepharose Beads | Cytiva (formal GE) | 28-9857-99 | Enrich biotinylated proteins |
| Streptavidin, Alexa Fluor 680 Conjugate | Thermo Fisher Scientific | S32358 | To conduct dot blot assay for bead titration |
| Thermomixer | temperature-controlled mixer | ||
| Trifluoacetic acid (TFA) | Millipore Sigma | 302031 | For Peptide desalting |
| Tris(2-carboxyethyl)phosphine hydrochloride (TCEP) | Millipore Sigma | C4706 | For Protein Digestion |
| Tris-HCl | Thermo Fisher Scientific | BP152500 | Lysis Buffer, Dot blot assay buffer, Beads wash buffer |
| Triton-X | Thermo Fisher Scientific | BP151500 | Beads wash buffer |
| TROLOX | Sigma-Aldrich | 648471 | Proximity-Labeling Quench Buffer, Lysis Buffer |
| Trypsin/Lys-C Mix, Mass Spec Grade | Promega | V5073 | For Protein Digestion |
| TWEEN 20 | Millipore Sigma | P1379 | Dot blot assay buffer |
| Urea | Thermo Fisher Scientific | BP169500 | Beads wash and On-Beads Digestion Buffer |
| Vitronectin | STEMCELL Technologies | 7180 | Cell Culture, Dish Coating |
| Y-27632 ROCK inhibitor | Selleck | S1049 | Cell Culture |
References
- De Duve, C., Wattiaux, R. Functions of lysosomes. Annual Review of Physiology. 28 (1), 435-492 (1966).
- Ballabio, A., Bonifacino, J. S. Lysosomes as dynamic regulators of cell and organismal homeostasis. Nature Reviews Molecular Cell Biology. 21 (2), 101-118 (2020).
- Lawrence, R. E., Zoncu, R. The lysosome as a cellular centre for signalling, metabolism and quality control. Nature Cell Biology. 21 (2), 133-142 (2019).
- Schröder, B. A., Wrocklage, C., Hasilik, A., Saftig, P. The proteome of lysosomes. Proteomics. 10 (22), 4053-4076 (2010).
- Lie, P. P. Y., Nixon, R. A. Lysosome trafficking and signaling in health and neurodegenerative diseases. Neurobiology of Disease. 122, 94-105 (2019).
- Leeman, D. S., et al. Lysosome activation clears aggregates and enhances quiescent neural stem cell activation during aging. Science. 359 (6381), 1277-1283 (2018).
- Wallings, R. L., Humble, S. W., Ward, M. E., Wade-Martins, R. Lysosomal dysfunction at the centre of Parkinson's disease and frontotemporal dementia/amyotrophic lateral sclerosis. Trends in Neurosciences. 42 (12), 899-912 (2019).
- Ferguson, S. M. Neuronal lysosomes. Neuroscience Letters. 697, 1-9 (2019).
- Rost, B. R., et al. Optogenetic acidification of synaptic vesicles and lysosomes. Nature Neuroscience. 18 (12), 1845-1852 (2015).
- Liao, Y. C., et al. RNA granules hitchhike on lysosomes for long-distance transport, using annexin A11 as a molecular tether. Cell. 179 (1), 147-164 (2019).
- Kuijpers, M., et al. Neuronal autophagy regulates presynaptic neurotransmission by controlling the axonal endoplasmic reticulum. Neuron. 109 (2), 299-313 (2021).
- Lu, J., et al. Generation of serotonin neurons from human pluripotent stem cells. Nature Biotechnology. 34 (1), 89-94 (2016).
- Dolmetsch, R., Geschwind, D. H. The human brain in a dish: The promise of iPSC-derived neurons. Cell. 145 (6), 831-834 (2011).
- Wang, C., et al. Scalable production of iPSC-derived human neurons to identify tau-lowering compounds by high-content screening. Stem Cell Reports. 9 (4), 1221-1233 (2017).
- Fernandopulle, M. S., et al. Transcription factor-mediated differentiation of human iPSCs into neurons. Current Protocols in Cell Biology. 79 (1), 1-48 (2018).
- Sunbul, M., Andres, J. Proximity labeling: Methods and protocols. , Humana Press. (2019).
- Lam, S. S., et al. Directed evolution of APEX2 for electron microscopy and proximity labeling. Nature methods. 12 (1), 51-54 (2015).
- Rhee, H. W., et al. Proteomic mapping of mitochondria in living cells via spatially restricted enzymatic tagging. Science. 339 (6125), 1328-1331 (2013).
- Lobingier, B. T., et al. An approach to spatiotemporally resolve protein interaction networks in living cells. Cell. 169 (2), 350-360 (2017).
- Paek, J., et al. Multidimensional tracking of GPCR signaling via peroxidase-catalyzed proximity labeling. Cell. 169 (2), 338-349 (2017).
- Fazal, F. M., et al. Atlas of subcellular RNA localization revealed by APEX-Seq. Cell. 178 (2), 473-490 (2019).
- Frankenfield, A. M., Fernandopulle, M. S., Hasan, S., Ward, M. E., Hao, L. Development and comparative evaluation of endolysosomal proximity labeling-based proteomic methods in human iPSC-derived neurons. Analytical Chemistry. 92 (23), 15437-15444 (2020).
- Li, J., Pfeffer, S. R. Lysosomal membrane glycoproteins bind cholesterol and contribute to lysosomal cholesterol export. eLife. 5, 21635(2016).
- Chen, Y., et al. A versatile polypharmacology platform promotes cytoprotection and viability of human pluripotent and differentiated cells. Nature Methods. 18 (5), 528-541 (2021).
- Li, H., Frankenfield, A. M., Houston, R., Sekine, S., Hao, L. Thiol-cleavable biotin for chemical and enzymatic biotinylation and its application to mitochondrial TurboID proteomics. Journal of the American Society for Mass Spectrometry. 32 (9), 2358-2365 (2021).
- Li, H., et al. Integrated proteomic and metabolomic analyses of the mitochondrial neurodegenerative disease MELAS. Molecular Omics. 18 (3), 196-205 (2022).
- Cox, J., Mann, M. MaxQuant enables high peptide identification rates, individualized p.p.b.-range mass accuracies and proteome-wide protein quantification. Nature Biotechnology. 26 (12), 1367-1372 (2008).
- Kong, A. T., Leprevost, F. V., Avtonomov, D. M., Mellacheruvu, D., Nesvizhskii, A. I. MSFragger: Ultrafast and comprehensive peptide identification in mass spectrometry-based proteomics. Nature Methods. 14 (5), 513-520 (2017).
- Frankenfield, A. M., Ni, J., Ahmed, M., Hao, L. How do protein contaminants influence DDA and DIA proteomics. bioRxiv. , (2022).
- Kuleshov, M. V., et al. Enrichr: A comprehensive gene set enrichment analysis web server 2016 update. Nucleic Acids Research. 44, 90-97 (2016).
- Szklarczyk, D., et al. STRING v11: Protein-protein association networks with increased coverage, supporting functional discovery in genome-wide experimental datasets. Nucleic Acids Research. 47, 607-613 (2019).
- Kissing, S., et al. Disruption of the vacuolar-type H+-ATPase complex in liver causes MTORC1-independent accumulation of autophagic vacuoles and lysosomes. Autophagy. 13 (4), 670-685 (2017).
- kleine Balderhaar, H. J., Ungermann, C. CORVET and HOPS tethering complexes - coordinators of endosome and lysosome fusion. Journal of Cell Science. 126 (6), 1307-1316 (2013).
- Zhang, M., Chen, L., Wang, S., Wang, T. Rab7: Roles in membrane trafficking and disease. Bioscience Reports. 29 (3), 193-209 (2009).
- Cheng, X. T., et al. Characterization of LAMP1-labeled nondegradative lysosomal and endocytic compartments in neurons. Journal of Cell Biology. 217 (9), 3127-3139 (2018).
- Eskelinen, E. -L. Roles of LAMP-1 and LAMP-2 in lysosome biogenesis and autophagy. Molecular Aspects of Medicine. 27 (5-6), 495-502 (2006).
- Sancak, Y., et al. Ragulator-rag complex targets mTORC1 to the lysosomal surface and is necessary for its activation by amino acids. Cell. 141 (2), 290-303 (2010).
- Abu-Remaileh, M., et al. Lysosomal metabolomics reveals V-ATPase- and mTOR-dependent regulation of amino acid efflux from lysosomes. Science. 358 (6364), 807-813 (2017).
- Ong, S. E., et al. Stable isotope labeling by amino acids in cell culture, SILAC, as a simple and accurate approach to expression proteomics. Molecular & Cellular Proteomics. 1 (5), 376-386 (2002).
- Tao, W. A., Aebersold, R. Advances in quantitative proteomics via stable isotope tagging and mass spectrometry. Current Opinion in Biotechnology. 14 (1), 110-118 (2003).
- Hao, L., et al. Quantitative proteomic analysis of a genetically induced prostate inflammation mouse model via custom 4-plex DiLeu isobaric labeling. American Journal of Physiology - Renal Physiology. 316 (6), 1236-1243 (2019).
- Thompson, A., et al. Tandem mass tags: A novel quantification strategy for comparative analysis of complex protein mixtures by MS/MS. Analytical Chemistry. 75 (8), 1895-1904 (2003).
- Qin, W., Cho, K. F., Cavanagh, P. E., Ting, A. Y. Deciphering molecular interactions by proximity labeling. Nature Methods. 18, 133-143 (2021).
- Go, C. D., et al. A proximity-dependent biotinylation map of a human cell. Nature. 595 (7865), 120-124 (2021).
Reprints and Permissions
