The protocol presents two methods to determine the kinetics of the fluorogenic RNA aptamers Spinach2 and Broccoli. The first method describes how to measure fluorogenic aptamer kinetics in vitro with a plate reader, while the second method details the measurement of fluorogenic aptamer kinetics in cells by flow cytometry.
Method Article
Determination of In Vitro and Cellular Turn-on Kinetics for Fluorogenic RNA Aptamers
* These authors contributed equally
In This Article
Summary
Abstract
Fluorogenic RNA aptamers have been applied in live cells to tag and visualize RNAs, report on gene expression, and activate fluorescent biosensors that detect levels of metabolites and signaling molecules. In order to study dynamic changes in each of these systems, it is desirable to obtain real-time measurements, but the accuracy of the measurements depends on the kinetics of the fluorogenic reaction being faster than the sampling frequency. Here, we describe methods to determine the in vitro and cellular turn-on kinetics for fluorogenic RNA aptamers using a plate reader equipped with a sample injector and a flow cytometer, respectively. We show that the in vitro kinetics for the fluorescence activation of the Spinach2 and Broccoli aptamers can be modeled as two-phase association reactions and have differing fast phase rate constants of 0.56 s−1 and 0.35 s−1, respectively. In addition, we show that the cellular kinetics for the fluorescence activation of Spinach2 in Escherichia coli, which is further limited by dye diffusion into the Gram-negative bacteria, is still sufficiently rapid to enable accurate sampling frequency on the minute timescale. These methods to analyze fluorescence activation kinetics are applicable to other fluorogenic RNA aptamers that have been developed.
Introduction
Fluorogenic reactions are chemical reactions that generate a fluorescence signal. Fluorogenic RNA aptamers typically perform this function by binding a small molecule dye to enhance its fluorescence quantum yield (Figure 1A)1. Different fluorogenic RNA aptamer systems have been developed and consist of specific RNA aptamer sequences and the corresponding dye ligands1. Fluorogenic RNA aptamers have been appended to RNA transcripts as fluorescent tags that enable live cell imaging of mRNAs and non-coding RNAs2,3,4. They have also been placed after promoter sequences as fluorescent reporters of gene expression, similar to the use of green fluorescent protein (GFP) as a reporter, except the reporting function is at the RNA level5,6. Finally, fluorogenic RNA aptamers have been incorporated into RNA-based fluorescent biosensors, which are designed to trigger the fluorogenic reaction in response to a specific small molecule. RNA-based fluorescent biosensors have been developed for live cell imaging of various non-fluorescent metabolites and signaling molecules7,8,9,10,11.
There is growing interest in the development of fluorogenic RNA aptamers to visualize dynamic changes in RNA localization, gene expression, and small molecule signals. For each of these applications, it is desirable to obtain real-time measurements, but the accuracy of the measurements depends on the kinetics of the fluorogenic reaction being faster than the sampling frequency. Here, we describe methods to determine the in vitro kinetics for fluorogenic RNA aptamers Spinach212 and Broccoli13 using a plate reader equipped with a sample injector and to determine the cellular turn-on kinetics for Spinach2 expressed in Escherichia coli using a flow cytometer. These two RNA aptamers were chosen because they have been applied to study RNA localization2,3,4, they have been used in reporters5, 6 and biosensors7,8,9,10,11, and the corresponding dye ligands (DFHBI or DFHBI-1T) are commercially available. A summary of their in vitro properties determined in the literature is given in Table 14,13,14, which informed the protocol development (e.g., the wavelengths and dye concentrations used). These results demonstrate that the fluorogenic reactions affected by RNA aptamers are rapid and should not impede accurate measurements for the desired cell biological applications.
Protocol
1. In vitro kinetics experiment
- Preparation of DNA templates by PCR
- Set up PCR reaction(s): To prepare PCR reactions, combine the following reagents in a thin-walled PCR tube:
33 µL of double-distilled water (ddH2O)
10 µL of 5x buffer for high-fidelity DNA polymerase
5 µL of 2 mM each deoxyribonucleoside triphosphate (dNTP)
0.5 µL of 40 µM forward primer
0.5 µL of 40 µM reverse primer
0.5 µL (10-100 ng) of DNA template (for Spinach2 PCR only; Broccoli primers overlap)
0.5 µL of high-fidelity DNA polymerase (add last)
NOTE: Synthetic oligonucleotides are often shipped dry. To prepare stock solutions, add a known volume (100 µL recommended) of ddH2O, and measure the A260 of that solution to determine the concentration by Beer's law, where the extinction coefficient can be calculated by nearest-neighbor rules online. This stock solution can then be used to make dilutions appropriate for use in PCR. - Run the thermocycler protocol.
- Use the following thermocycler protocol to amplify full-length Spinach2 and Broccoli DNA templates:
Initial denaturation:98 °C for 2 min
35 cycles:
Denaturation:98 °C denaturation for 15 s
Annealing:72 °C for 30 s
Extension:72 °C for 30 s
Final extension: 72 °C for 5 min. - After the reaction, analyze a small aliquot of the product by 2% agarose gel along with a low molecular weight ladder (size range: 25-766 nucleotides) to confirm the presence of the desired DNA product.
- Purify the product by commercially available gel extraction or PCR clean-up kits and elute with ddH2O or the buffer provided by the manufacturer.
NOTE: Be sure when choosing a PCR clean-up kit that the column molecular weight cutoff is low enough to retain T7-Broccoli (81 nucleotides), or else the PCR product will be lost.
NOTE: Optional pause point: store the DNA at −20 °C.
- Use the following thermocycler protocol to amplify full-length Spinach2 and Broccoli DNA templates:
- Set up PCR reaction(s): To prepare PCR reactions, combine the following reagents in a thin-walled PCR tube:
- Preparation of Spinach2 and Broccoli RNA by in vitro transcription (IVT)
- Set up the transcription reaction(s).
- To prepare a 100 µL transcription reaction, combine the following reagents in a 1.5 mL microcentrifuge tube: 10 µL of 10x transcription buffer + 20 µL of 10 mM ribonucleoside triphosphates (rNTPs) + 1-64 µL of DNA template (total of 1 µg) + 2 µL of inorganic pyrophosphatase + ddH2O to 98 µL + 2 µL of T7 RNA polymerase (add last).
- Incubate this reaction for 4 h at 37 °C. Quench the reaction by adding 100 µL of 2x urea gel loading buffer (2x ULB), composed of 20% sucrose, 0.1% sodium dodecyl sulfate (SDS), 1x Tris-Borate-EDTA (1x TBE) buffer, and ~18 M urea.
NOTE: Optional pause point: store the quenched reaction at −20 °C.
- Set up the transcription reaction(s).
- Polyacrylamide gel electrophoresis (PAGE) purification of RNA
- PAGE purification of Spinach2 and Broccoli RNA
CAUTION: Non-polymerized (liquid or powdered) acrylamide is extremely toxic. If weighing out powdered acrylamide, do so in a fume hood. Always wear proper protective equipment and immediately remove gloves contaminated with acrylamide powder or solution, washing hands thoroughly. If acrylamide comes in direct contact with the skin, wash the exposed area for at least 15 min with soap and water. If acrylamide comes in direct contact with the eyes, flush them with water for 15 min.- Prepare the PAGE gel: To remove unwanted abortive transcripts and unreacted rNTPs from the full-length product, prepare a 6% urea-polyacrylamide gel. In general, 28 cm x 16.5 cm x 1.5 mm gels can be used with an 8-well comb. Set up the gel and electrophoresis equipment, using 1x TBE buffer to fill the reservoirs.
- Load RNA sample(s) in the PAGE gel: Load the gel with one quenched 200 µL reaction per lane. In a separate lane, load 2x ULB with tracker dyes xylene cyanol and bromophenol blue, which migrate in the gel at 106 nucleotides and 26 nucleotides, respectively15. Leave an empty lane between each sample to avoid potential contamination in the next steps.
- Run the PAGE gel: To separate 95-nt Spinach2 and 49-nt Broccoli from their respective truncated products, run the gel for 1.5-2 h at 25 W, at which point the bromophenol blue dye will have migrated ~5/6 of the gel length.
- Visualize the RNA sample(s) in the PAGE gel: Disassemble the glass plates around the gel and cover the gel in plastic wrap on both sides, labeling the lanes on the wrap. Visualize RNA bands in a dark room by UV shadowing by placing the wrapped gel on a fluorescent TLC plate under UV light. Quickly outline the edge of the RNA bands corresponding to the product with a marker and switch off the UV lamp to minimize damage from UV exposure.
- Excise and extract the RNA sample(s) from the PAGE gel: With a fresh razor blade for each sample, excise the desired product bands, dice into ~1 mm cubes, and add the gel pieces to a 2 mL microcentrifuge tube with 500 µL of crush soak buffer to extract RNA on a rotator for either 2 h at room temperature (RT) or overnight at 4 °C.
NOTE: Optional pause point: the sample may be stored at −20 °C. - Precipitate the RNA
- To separate the gel pieces from the extracted RNA in buffer, centrifuge the sample at 13,000 x g for 20 min at 4 °C, and then use a narrow-tip pipette to extract the supernatant and load it into a new 2 mL microcentrifuge tube.
- To precipitate the RNA, add 1.5 mL of ice-cold ethanol and 1 µL of 20 mg/mL glycogen, vortex, and store for at least 1 h at −20 °C or −80 °C.
NOTE: Optional pause point: the RNA may be stored at −20 °C for a few months.
- Collection of RNA precipitate: Pellet the precipitated RNA by centrifugation at 13,000 x g for 20 min at 4 °C. Remove the supernatant and allow the remaining ethanol to evaporate under open air (~1 h) before resuspending the pellet in 30 µL of ddH2O or 1x TE buffer.
NOTE: This process typically results in a final RNA concentration of ~10 µM.
NOTE: Optional pause point: the RNA sample may be stored at −20 °C for a few months.
- Determine the RNA stock concentrations.
- Prepare an RNA aliquot for the hydrolysis reaction.
- To perform this assay, first, use a UV/Vis nano spectrophotometer to determine the A260 of the stock RNA sample and make a diluted aliquot of the sample to ~10 absorbance units (AU) in ddH2O.
- Prepare the following reaction in a 0.5 mL PCR tube: 16 µL of ddH2O + 2 µL of 10x Na2CO3 buffer + 2 µL of RNA aliquot diluted to ~10 AU. Incubate the reaction for 90 min at 95 °C, and then allow it to cool to RT.
- Determine the RNA concentration using nucleotide absorbances: Measure the A260 of this sample with a UV/Vis nano spectrophotometer and calculate the RNA concentration using the following formula:
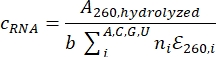
where c is the concentration of RNA, b is the path length, i is the specific nucleotide (A, C, G, or U), ni is the frequency of nucleotide i in the RNA sequence, and εi is the molar extinction coefficient of nucleotide i. To determine the original stock RNA concentration, multiply c by the dilution factor.
NOTE: Optional pause point: The RNA may be stored at −20 °C for a few months.
- Prepare an RNA aliquot for the hydrolysis reaction.
- PAGE purification of Spinach2 and Broccoli RNA
- Performing an in vitro plate reader kinetics assay
- Set up the RNA renaturation program: Create the following thermocycler protocol by selecting Create New Program > Add New Phase > Add New Step multiple times to add each of the following steps before pressing Save:
70 °C for 3 min
65 °C for 45 s
60 °C for 45 s
55 °C for 45 s
50 °C for 45 s
45 °C for 45 s
40 °C for 45 s
35 °C for 45 s
30 °C for 45 s - Renature the RNA: To renature Spinach2 and Broccoli RNAs, prepare 2 µM stocks of each RNA in ddH2O in a 0.5 mL thin-walled PCR tube, and then add an equal volume of 2x renaturation buffer (80 mM HEPES, pH 7.5 [KOH], 250 mM KCl, 6 mM MgCl2) to make 1 µM RNA solutions. Add the tubes to the thermocycler, open the saved renaturation program, and press Run.
NOTE: If a thermocycler is unavailable, the RNAs may instead be incubated on a 70 °C heat block for 3 min and then allowed to cool slowly to RT on the bench. - Prepare the binding reaction buffer: To prepare the buffer for one aptamer-dye binding reaction, make a master mix containing buffer components (69.5 µL of ddH2O + 4 µL of 1 M HEPES, pH 7.5 [KOH] + 6.2 µL of 2 M KCl + 0.3 µL of 1 M MgCl2). Depending on how many samples and replicates are needed, multiply these values by the number of samples plus one. Generally, three replicates per RNA sample is satisfactory.
- Prepare the plate reader.
- Set up the plate reader injector program: On the fluorescence plate reader, select Temp and set the desired temperature to 37 °C, making sure the temperature has equilibrated to this value well before starting kinetics experiments. Open the plate reader software, select Settings > Acquisition View, and input the following program for kinetics measurements:
Loop: For each well
Baseline setting: 60 baseline reads
SmartInject settings: 10 µL injection (which will happen after the baseline reads)
Fluorescence (or FL) reads:
Excitation: 448 nm (bandwidth: 9 nm)
Emission: 506 nm (bandwidth: 15 nm)
Cartridge: MONO (s/n 3297)
Timing:
Total read time: 10 min
Read interval: 0.5 s
PMT and Optics: 6 flashes per read
Loop: Next well - Prepare the injector
- Wash and aspirate the injector: To prepare the plate reader injector, first select Inject on the plate reader, supply a waste collection plate to the plate reader when directed, and then select Wash, and clean the injection tube following instructions on the plate reader with 1 mL volumes of ddH2O, 75% ethanol in ddH2O, and then ddH2O. Next, select Aspirate, allowing the injector to eject excess liquid.
- Prime the injector: After exiting to the previous screen, select Prime to prime the injector with two 260 µL volumes of ligand to be injected to ensure pure, concentrated ligand is added to samples during experiments-in this case, prime with 100 µM DFHBI in ddH2O.
- Set up the plate reader injector program: On the fluorescence plate reader, select Temp and set the desired temperature to 37 °C, making sure the temperature has equilibrated to this value well before starting kinetics experiments. Open the plate reader software, select Settings > Acquisition View, and input the following program for kinetics measurements:
- Perform in vitro kinetics experiments: To perform one kinetics experiment, first add 80 µL of previously prepared binding buffer master mix to one well of a 96-well clear-bottom plate, followed by 10 µL of renatured RNA. Allow this plate and the DFHBI solution in the injector to equilibrate to 37 °C for 15 min in the plate reader.
- In the plate reader software Settings under Read Area, select the well to be analyzed, and then, under the Home tab, select Run to execute the kinetics program described previously. Repeat this process until all the experiments are complete.
NOTE: Critically, kinetics experiments should be performed one well at a time to ensure the RNA kinetics are measured under identical conditions between replicates and samples. - Wash the injector: To remove the remaining DFHBI solution from the injection tube, wash the injection tube as described in step 1.4.4.2.1 with 1 mL volumes of ddH2O, 75% ethanol in ddH2O, and then ddH2O.
NOTE: Optional pause point.
- Set up the RNA renaturation program: Create the following thermocycler protocol by selecting Create New Program > Add New Phase > Add New Step multiple times to add each of the following steps before pressing Save:
- Analysis of the in vitro kinetics of fluorogenic RNA aptamers.
- Input data into the analysis software: Export experimental data as a spreadsheet to easily copy over the data for processing. In the analysis software, create a new data table in XY format. In the X column, enter each reading timepoint, with t = 0 being the time of DFHBI injection. In the Y column, enter the average fluorescence values between replicates at that respective timepoint starting at t = 0.
- Normalize and graph the data: To normalize the fluorescence values, click on Analyze > Data Processing > Normalize, and then click on OK. Choose to use the smallest and largest values of the dataset for normalization, to present results as fractions, and to Graph the Results, and then click on OK. To create a graph of the normalized averaged fluorescence over time, click the Normalize of [Dataset Name] icon and select Graph Family: XY with Points Only.
NOTE: Error bars can be useful to see in cases where a small number of time points are graphed. If these are desired, when choosing an XY format data table, select the option under "Y" to enter replicate values in side-by-side columns. Graphing the resulting table with the default options selected will produce a graph with error bars. - Perform curve fitting to obtain kinetic parameters: To fit a curve to the kinetics data, click on Analyze > Analyze Data and select Nonlinear Regression (Curve Fit) under the XY Analyses tab. Under the Model tab, click on Exponential > Two Phase Association to fit the kinetics data with the following two-phase association equation:

where Y is the fluorescence at time X, Y0 is the fluorescence at t = 0, KFast and KSlow are fast and slow rate constants, respectively, and SpanFast and SpanSlow are the ranges of fluorescence turn-on accounted for by the fast and slow rates, respectively (see representative results, Figure 1). Click on the Nonlin Fit tab to view rate constants, t1/2 values, and PercentFast values.
NOTE: To obtain a standard deviation for all these values, individual plate reader experiment replicates can be processed in the same way as described above.
2. Cellular kinetics experiment
- Preparation of E. coli strains
- Transform BL21 Star (DE3) E. coli cells with ~100 ng of pET31b tRNA-Spinach2 construct following the manufacturer's protocol.
NOTE: Plasmid construct is commercially available (Plasmid #79783). - Plate the cells on LB agar containing carbenicillin (Carb: 50 mg/mL) plates and incubate at 37 °C for 12-16 h. Cells containing plasmids will grow as colonies on the plate.
NOTE: Optional pause point: Transformed BL21 Star cells on plates can be stored at 4 °C wrapped in parafilm for 1 week.
- Transform BL21 Star (DE3) E. coli cells with ~100 ng of pET31b tRNA-Spinach2 construct following the manufacturer's protocol.
- Growing cells and inducing the expression of fluorogenic RNA aptamer
- Inoculate a 2 mL culture of noninducing media (NI) containing carbenicillin (Carb: 50 mg/mL) with a single colony of the transformed BL21 Star cells. Repeat this for at least three biological replicates. Incubate the cultures at 37 °C in an incubator/shaker at 250 rpm for 22-24 h.
NOTE: Optional pause point: Cells grown in NI media retain the plasmid and can be stored at 4 °C for 1 week. - After growth in NI media, dilute the culture 100x into a fresh 3 mL of ZYP-5052 autoinduction media (AI) containing carbenicillin (Carb: 50 mg/mL). Grow the cells at 37 °C in an incubator/shaker at 250 rpm for 16-18 h to induce expression.
NOTE: The typical OD600 for cultures will range from 2.0-3.3 after 18 h of growth. The optimum cell density range is between 2.5-3.0.
- Inoculate a 2 mL culture of noninducing media (NI) containing carbenicillin (Carb: 50 mg/mL) with a single colony of the transformed BL21 Star cells. Repeat this for at least three biological replicates. Incubate the cultures at 37 °C in an incubator/shaker at 250 rpm for 22-24 h.
- Performing the cellular kinetics experiment
- Set up the flow cytometer.
- Turn on the flow cytometer and computer connected to the instrument. Once logged into the software for the flow cytometer, under the Instrument tab, click on the Startup icon. Follow the steps indicated on the software screen to ensure proper instrumentation initialization.
NOTE: Some flow cytometers call the instrument startup sequence Priming. Make sure to follow the manufacturer's protocol for the flow cytometer that will be in use for the experiment. - Run a performance test (if applicable). Under the Main Menu tab, click on Performance Test. In a culture tube, add three drops of the manufacturer's performance tracking beads into 3 mL of focusing fluid.
- Place the culture tube into the sample tube lifter and raise the lifter. Prior to clicking Run Performance Test, make sure the Lot # of the tube of the tracking beads is the same as what is indicated on the Performance Test Setup screen. Click Performance Test to run the test.
- Set up the flow cytometer software for this experiment with the following acquisition parameters for single-cell fluorescence:
Excitation Laser: 488 nm
Emission Channel: GFP (also called FITC)
Acquisition Volume: 40 µL (with a total draw volume of 90 µL)
Flow Rate: 200 µL/ min
Cell Counts for each measurement: 30,000
Instrument Settings:
Voltage:
FSC: 480 V
SSC: 400 V
BL1: 540 V
BL2: 392 V
BL3: 422 V
- Turn on the flow cytometer and computer connected to the instrument. Once logged into the software for the flow cytometer, under the Instrument tab, click on the Startup icon. Follow the steps indicated on the software screen to ensure proper instrumentation initialization.
- Set up the experimental files.
- Create a new experiment file within the Experiment Explorer tab by right-clicking the flow cytometer username. Select New Experiment in the drop-down window. When a new window on the computer screen pops up, select OK.
- In the new experiment file, right-click the "Group" folder and select Add New Sample Tube. Label the sample tubes for each specific time point and replicate by right-clicking on Sample and selecting Rename in the drop-down menu. Repeat this step for the total number of replicates and time points for the intended time course of the study.
- Prepare a dilute cell solution: In a new culture tube, add 1.5 mL of 1x PBS solution. Next, add 3 µL of induced cells in AI media into the 1x PBS solution to make a dilute cell solution. Repeat this step for each biological replicate in different culture tubes.
- Measure the background fluorescence of the cells: Before adding dye, take readings of each biological replicate culture tube containing cells in 1x PBS solution. This is so that the fluorescent background of the cells is measured to observe the fold turn on over time once the dye is added.
- To take a reading, place the culture tube into the sample tube lifter, and raise the lifter by hand to the sample injection needle. Select the proper sample file within the Collection Panel tab, and click Record.
- When the run is complete, lower the sample tube lifter with the culture tube by hand. This will initiate a Rinse step that will flush the fluidic system and minimize carryover between each biological replicate sample. The data will automatically be saved to the computer after the run is completed.
- Repeat the steps within 2.3.4 to measure the cellular fluorescent background for at least three biological replicates. To move to the next sample file, select the next sample file by clicking the right arrow icon near the sample tube name underneath the Record icon.
- Measure fluorescence at time points for cells with dye.
- Add 1.4 µL of a concentrated dye stock (50 mM DFHBI-1T in DMSO) into 1x PBS solution with cells to give a final concentration of 50 µM DFBHI-1T. Next, secure the culture tube lid, and then invert culture tubes 3x-5x to mix the solution evenly before taking the first time point reading.
NOTE: The total percentage of DMSO within the culture tubes for E. coli should not exceed 10%, as this can affect cell viability16. - Remove the lid and place the culture tube into the sample tube lifter. Raise the holder by hand to the sample injection needle, and, under the proper sample file, click the Record icon. Additionally, begin a timer by pressing Start for the experiment.
- Lower the tube lifter by hand after the run is completed, and repeat steps 2.3.5.1-2.3.5.2. (with the timer running) by adding 1.4 µL of the concentrated DFHBI-1T, inverting the culture tubes, and taking readings for all the remaining biological replicates. These first recordings will be the readings obtained at 0 min for all the biological replicates. Do this one at a time for each biological replicate.
NOTE: Make a note of the time when the record flow cytometry acquisition is pressed. Adhere to this time staggering for time points over the course of the experiment. - Continue to take readings by raising the culture tubes in the sample tube lifter to the sample injection needle, selecting the proper sample file, clicking Record, and lowering the lifter by hand after each run is complete. Do this for all the additional time points and biological replicates being tested. Repeat the steps until the experiment is completed.
NOTE: Keep the samples out of light to avoid the photobleaching of DFHBI-1T in solution by covering the samples with aluminum foil.
- Add 1.4 µL of a concentrated dye stock (50 mM DFHBI-1T in DMSO) into 1x PBS solution with cells to give a final concentration of 50 µM DFBHI-1T. Next, secure the culture tube lid, and then invert culture tubes 3x-5x to mix the solution evenly before taking the first time point reading.
- Measure fluorescence at time points for cells without dye (Control).
- Run the appropriate cleaning protocols for the flow cytometer before repeating the experiment again with negative controls following the manufacturer's protocol. This is done to minimize any carryover from the previous experiment into the control time point analysis experiment. Below are the steps followed for the flow cytometer between experiments:
- Place an empty culture tube in the tube lifter by hand, raise the tube holder, and click on the Unclog icon in the Instrument tab. This will run a backflush in the fluidics system to clean up any sticky samples. Lower the tube holder by hand and remove the tube once the Unclog sequence is done.
- With a new culture tube, add 3 mL of a 10% bleach solution, place the culture tube into the tube holder, and raise the holder by hand to the sample injection needle. Additionally, place a clean 96-well plate into the autosampler if applicable to the flow cytometer.
- Click on the Sanitize SIP/Sanitize Autosampler SIP icon to run a cleaning sequence with 10% bleach throughout the fluidics system. Lower the tube holder to complete the cleaning sequence.
- Set the sample files for the control time point analysis run following the directions within step 2.3.3.
- In a new culture tube, prepare a dilute cell solution in 1.5 mL of 1x PBS solution. Add 3 µL of the induced cells in AI media into the 1x PBS solution to make a dilute cell solution. Repeat this step for each biological replicate.
- Add 1.4 µL of DMSO into the culture tube one at a time to the 1x PBS solution with cells and test the same time points. Secure the culture tube lid, and then invert culture tubes 3x-5x to mix the solution evenly before taking the first time point reading. Do this one at a time for each biological replicate.
- Follow the same protocol for the analysis of control cells as for cells with dye, using steps 2.3.5.2-2.3.5.4.
- Run the appropriate cleaning protocols for the flow cytometer before repeating the experiment again with negative controls following the manufacturer's protocol. This is done to minimize any carryover from the previous experiment into the control time point analysis experiment. Below are the steps followed for the flow cytometer between experiments:
- Shutdown the flow cytometer: Follow the manufacturer's protocol for the proper shutdown of the instrumentation. For the flow cytometer, the instrument is prepared for shutdown in the following manner:
- Perform the initial cleaning protocol for the flow cytometer following steps 2.3.6.1.1-2.3.6.1.3.
- Replace the culture tube with 10% bleach solution with a culture tube with 3 mL of focusing fluid. Raise the tube holder by hand, and, under the Shutdown icon, click on the drop-down menu and select Thorough.
NOTE: Optional pause point.
- Set up the flow cytometer.
- Analysis of the flow cytometry data
- Export all the FCS files for analysis. Open the FCS files with a flow cytometry analysis software.
- Using one of the Cell-only FCS files, generate a gate from the forward scatter (FSC) and side scatter (SSC) dot plot (FSC-Area/SSC-Area), using both log axes to exclude any signals from debris. To create this gate, click on the AutoGate icon on the flow cytometry analysis software and name it Gate 1. Apply this same gate to all the samples tested under the All Samples tab in the data processing workspace. This will result in Gate 1 underneath all the FCS files being processed.
- Create a new subset file with the Cell only FCS file used in step 2.4.2 by double-clicking it. Change the axis settings to FSC-Area/FSC-Height, with both using log axes. Click on the AutoGate icon on the flow cytometry analysis software to generate an oval gate, naming it Gate 2. Apply this gate as a subset underneath the gate set in step 2.4.2 to all the samples tested. This will result in all the samples having Gate 1 > Gate 2 associated with each FCS file.
- Create another subset file with both gates set in step 2.4.2 and step 2.4.3 applied by double-clicking Gate 2. Change the axis settings to FSC-Area/Histogram. Apply this histogram gate as a subset to all the samples tested, resulting in all the samples having Gate 1 > Gate 2 > Gate 2 associated with each FCS file.
NOTE: The histograms can be renamed from Gate 2 to Histogram to assist with moving the histograms into the layout window, as well as to create more organization with the data processing. - To analyze the mean fluorescence intensity (MFI) values, open the layout window. Click and drag the histogram gates for each time point into the layout window.
- Perform a statistical analysis for "∑ Mean: BL1-A" (GFP) for each sample tested to display the MFI results on the layout window.
- Calculate the standard deviation for the MFI values per time point analysis for at least three independent biological replicates.
- Save the histograms and MFI values for each time point by exporting the layout window as a PDF file.
NOTE: Optional pause point.
- Graph flow cytometry data
- Open the PDF file containing the histograms and MFI values for each time point. The MFI values will be copied over into a data analysis software. In data graphing software, create a new data table in the XY format.
- Select to create an XY Table with the following selected:
Data Table: Enter or import data into a new table
Options:
X: Elapsed Times
Y: Enter (three to four) replicate values in side-by-side subcolumns - Label on the X axis all the time points for the experiment and control runs.
- In Group A, input the MFI values for all the biological replicates into each time point for fluorescence analysis of the cells with the dye added.
- In Group B, input the MFI values for all the biological replicates into each time point for analysis of the cells with no dye (DMSO) added.
- To observe the results, click on [Insert Data Set Name] under the Graphs tab. This will display the data points as means, with error bars representing the standard deviation (s.d.) at each time point. The X-axis represents the elapsed time, and the Y-axis represents the MFI values.
- Select to create an XY Table with the following selected:
- Open the PDF file containing the histograms and MFI values for each time point. The MFI values will be copied over into a data analysis software. In data graphing software, create a new data table in the XY format.
Results
In vitro kinetics
The sequences of the DNA templates and primers, which are purchased as synthetic oligonucleotides, are shown in Table 2, and the reagent recipes are shown in Supplementary File 1. PCR amplification is used to scale up the amount of DNA template with the T7 promoter, which is required for the subsequent in vitro transcription (IVT) reaction. In addition, PCR amplification can be used for two purposes in the same reaction: to generate the full-length Broccoli DNA template by primer extension, as well as to scale up the DNA template.
After the IVT reaction to synthesize RNA, PAGE purification will remove any unwanted truncated transcripts, degraded products, and unreacted rNTPs from the full-length RNA product. This type of purification is preferred because truncated or degraded RNAs will cause the inaccurate determination of RNA concentrations. Since nucleotide bases absorb UV light, RNA bands and rNTPs on the gel can be visualized under UV as shadows against a fluorescent TLC plate. Thus, bands corresponding to the correct product size can be selectively extracted.
The nearest-neighbor method overestimates the extinction coefficients and, thus, the concentrations of structured RNAs since it does not account for hypochromicity due to base pairing17. Therefore, to determine accurate RNA concentrations, neutral pH thermal hydrolysis assays were performed to hydrolyze the RNA to individual NMPs18. The accurate extinction coefficient was calculated as a sum of the extinction coefficients of NMPs in the RNA sequence.
The kinetics of DFHBI binding to Spinach2 and Broccoli was determined using a plate reader assay. RNA was first renatured to ensure it would be in the correct conformation for dye binding. The reaction conditions for the plate reader kinetics assay consisted of 40 mM HEPES, pH 7.5 (KOH), 125 mM KCl, 3 mM MgCl2, 100 nM renatured RNA, and 10 µM DFHBI, and the reaction was measured at 37 °C. This temperature and concentration of MgCl2 were chosen to mimic physiological conditions19, though conditions of 28 °C and 10 mM MgCl2 may also be used for improved aptamer folding.
Both fluorogenic aptamers Spinach2 and Broccoli display two-phase association kinetics for binding to the DFHBI dye (Figure 2). The kinetics data were better fit by two-phase association than one-phase association for both aptamers (Supplementary Figure 1). The rate constants and t1/2 values for the fast and slow associations were determined by the best fit curve (Table 3). PercentFast, which describes what percent of the fluorescence turn-on magnitude is accounted for by the faster DFHBI-binding RNA population, was also determined.
Spinach2 in the binding-competent state shows faster turn-on than Broccoli (t1/2 = 1.2 s vs. 2.0 s). The second phase kinetics for both aptamers are similar (t1/2 = 180 s) and likely correspond to a common rate-limiting step for a sub-population of the sample (PercentFast = 68% and 60% for Spinach2 and Broccoli, respectively). Overall, these results show that well-folded Spinach2 and Broccoli aptamers exhibit very fast turn-on kinetics, with the initial half-maximal turn-on within 1-2 s of dye addition.
Cellular kinetics
The sequences of the DNA constructs, which are cloned into the pET31b plasmid, are shown in Table 2, and reagent recipes are shown in Supplementary File 1. The DNA constructs of fluorogenic RNA aptamers are typically contained within a tRNA scaffold for cellular experiments. The BL21 Star (DE3) E. coli strain is an expression strain with a mutation in RNase E that increases RNA stability.
The fluorescence time point measurements were recorded every 5 min for the first 45 min, followed by readings at 1 h, 1.5 h, and 2 h, giving a total of 12 time points plus the cell-only reading. Having the shortest time interval being 5 min permitted multiple biological replicates to be measured at each time point, with regular spacing between the replicate measurements of 30 s to 1 min. The total volume of cells diluted in 1x PBS solution used for the time course experiment was 1.5 mL.
The cells were gated prior to determining the mean fluorescence intensity (MFI) of the population of single cells. Gating selects an area on the scatter plot to determine the cell population that will be analyzed. This process prevents any debris or multiplet readings from being included in the analysis. For the flow cytometry analysis shown, 30,000 events were recorded, which resulted in 10,000-20,000 events analyzed after gating.
The cellular fluorescence kinetics are a function of both dye diffusion into E. coli and dye binding kinetics to the RNA aptamer within the cellular environment (Figure 1B). For cells expressing Spinach2-tRNA, it was observed that the mean fluorescence intensity (MFI) increases immediately at the "0" timepoint, due to the short time lag (in seconds) between dye addition and sample analysis (Figure 3A). Furthermore, cellular fluorescence has already reached its maximal equilibrated MFI value (40,441 ± 990) at the first time point of 5 min. In contrast, control cells show low background fluorescence (416) and no change in MFI value with DMSO addition (Figure 3B). A comparison between cells with dye and cells with no dye reveals that fluorescence activation is 98-fold ± 2 in cells. Overall, these results show that Spinach2-tRNA expressed in E. coli cells exhibits fast turn-on kinetics, with maximal turn-on within less than 5 min of dye addition.
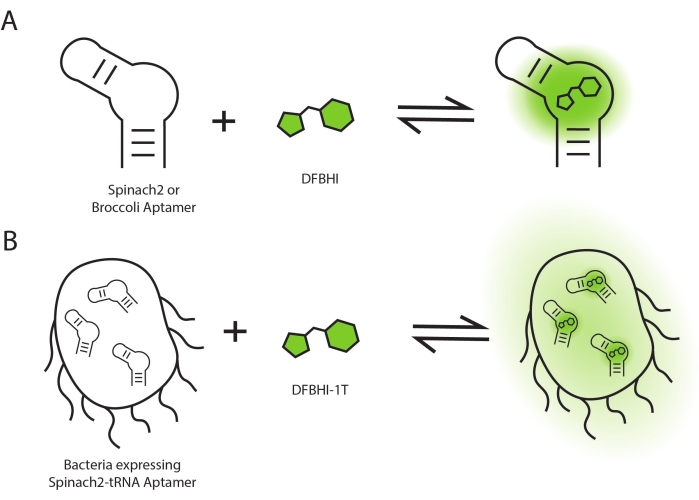
Figure 1: Schematic of fluorescence activation. Fluorescence activation occurs upon RNA aptamers binding to dye molecules (A) in vitro and (B) in cells. Please click here to view a larger version of this figure.
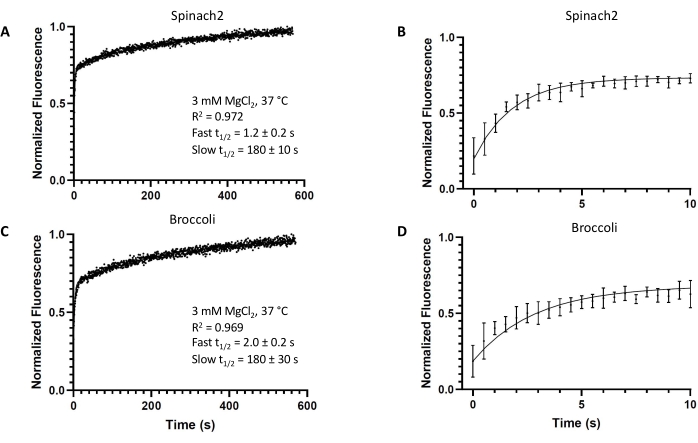
Figure 2: In vitro kinetics of the fluorogenic aptamers. Representative in vitro kinetics of the fluorogenic aptamers (A,B) Spinach2 or (C,D) Broccoli modeled by two-phase association, with t = 0 s being the timepoint of DFHBI addition (final DFHBI concentration: 10 µM). Experiments were performed in triplicate. All error bars represent standard deviations from the mean. From the fit, t1/2 values were obtained for both the fast and slow association reaction components. Please click here to view a larger version of this figure.

Figure 3: Representative cellular kinetics of Spinach2 in a tRNA scaffold. (A) Timepoint analysis of tRNA-Spinach2 dye uptake over the course of 2 h. A cell-only baseline was taken prior to adding in DFHIB-1T or DMSO. Time points were taken every 5 min for the first 45 min, followed by a time point reading at 1 h, 1.5 h, and 2 h. Arrow represents when the DFHBI-1T or DMSO was added into 1x PBS solution with BL21 Star cells. The final concentration of DFHBI-1T for analysis is 50 µM. For the DMSO control, the addition of DMSO was at an equal volume (1.4 µL) used for DFHBI-1T dye addition. (B) A close-up of the DMSO control time point analysis with BL21 Star E. coli cells. Mean fluorescence intensity (MFI) indicates the overall fluorescent readout of BL21 Star cells with dye or DMSO. Data represent the mean ± standard deviation of three biological replicates. Please click here to view a larger version of this figure.
| Aptamer-Dye Pair | Length (nt) | Max abs (nm) | Max em (nm) | Extinction coefficient (M-1·cm-1) | Quantum yield | Brightness | Kd (nm) | Tm (°C) | Reference |
| Spinach2-DFHBI | 95 | 445 | 501 | 26100 | 0.7 | 63 | 1450 | 37 | 4 |
| Spinach2-DFHBI-1T | 95 | 482 | 505 | 31000 | 0.94 | 100 | 560 | 37 | 13, 14 |
| Broccoli-DFHBI-1T | 49 | 472 | 507 | 29600 | 0.94 | 96 | 360 | 48 | 13 |
Table 1: Previously published photophysical and biochemical properties of Spinach2-DFHBI4, Spinach2-DFHBI-1T13,14, and Broccoli-DFHBI-1T13.
| Spinach2 + T7 promoter | 5’-CGATCCCGCGAAATTAATACGACTCACTATAGGATGTAACTGAATGAAATGGTGAA GGACGGGTCCAGTAGGCTGCTTCGGCAGCCTACTTGTTGAGTAGAGTGTGAGCTCC GTAACTAGTTACATC-3’ | ||
| Broccoli + T7 promoter | 5’-CGATCCCGCGAAATTAATACGACTCACTATAGgagacggtcgg gtccagatattcgtatctgtcgagtagagtgtgggctc-3’ | ||
| tRNA-Spinach2 construct (in pET31b plasmid) | 5'-CGATCCCGCGAAATTAATACGACTCACTATAGGGGCCCGGATAGCTCAGTCGGT AGAGCAGCGGCCGGATGTAACTGAATGAAATGGTGAAGGACGGGTCCAGTAGGCT GCTTCGGCAGCCTACTTGTTGAGTAGAGTGTGAGCTCCGTAACTAGTTACATCCGG CCGCGGGTCCAGGGTTCAAGTCCCTGTTCGGGCGCCA TAGCATAACCCCTTGGGGCCTCTAAACGGGTCTTGAGGGGTTTTTTG-3' | ||
| Spinach2 Forward Primer | 5’-CGATCCCGCGAAATTAATACGACTCACTATAG-3’ | ||
| Spinach2 Reverse Primer | 5’-GATGTAACTAGTTACGGAGC-3’ | ||
| Broccoli Forward Primer | 5’-CGATCCCGCGAAATTAATACGACTCACTATAGgagacggtcgggtccagatattcgtatctg-3’ | ||
| Broccoli Reverse Primer | 5’-gagcccacactctactcgacagatacgaatatctggacccgaccgtctc-3’ | ||
Table 2: DNA sequence table containing DNA sequences and primers used for in vitro and cellular kinetics studies. Bold= T7 promoter; Underlined = tRNA scaffold; Caps = Spinach2; lowercase = Broccoli; Bold italics = T7 terminator.
| Aptamer | Fast t1/2 (s) | Slow t1/2 (s) | KFast (s-1) | KSlow (s-1) | Percent Fast |
| Spinach2 | 1.2 ± 0.2 | 180 ± 10 | 0.56 ± 0.07 | 0.0039 ± 0.0002 | 68 ± 5 |
| Broccoli | 2.0 ± 0.2 | 180 ± 30 | 0.35 ± 0.05 | 0.0039 ± 0.0006 | 60 ± 3 |
Table 3: In vitro kinetics values of the Spinach2 and Broccoli aptamers derived from fitted data. The data are reported as the mean ± standard deviation of three replicates.
Supplementary Figure 1: Representative in vitro kinetics of the fluorogenic aptamers. Representative in vitro kinetics of the fluorogenic aptamers (A,C) Spinach2 or (B,D) Broccoli modeled by one-phase association at (A,B) 600 s or (C,D) 20 s measurement times, with arrows indicating the timepoint of DFHBI addition (final DFHBI concentration: 10 µM). Experiments were performed in triplicate. Overall, these data are less well fit by a one-phase association model than a two-phase association model when fluorescence signal is monitored for a longer duration. Please click here to download this File.
Supplementary File 1: Recipes for in vitro kinetics experiment. Please click here to download this File.
Discussion
For the in vitro kinetics experiment, the same general protocol can be modified to measure the in vitro kinetics of an RNA-based fluorescent biosensor containing both a ligand-binding and fluorophore-binding domain8. In this case, the RNA should be incubated with the fluorophore prior to measurements upon injecting the ligand in order to obtain ligand response kinetics. If high variability is observed between the replicates, one can troubleshoot by checking that each sample is allowed to equilibrate for the same amount of time in the 96-well plate before measurement. Each sample or replicate should be individually prepared in a well and measured right after the 15 min equilibration step, rather than preparing all samples at once.
For the cellular kinetics experiment, the protocol can be modified for shorter or longer time courses, but it is critical to plan out the number of biological replicates and adjust the needed cell solution volume. It is recommended to space out each biological replicate reading between 30 s to 1 min to have adequate time to perform the steps carefully. Another modification is to test a different fluorogenic dye that does not bind the RNA aptamer as an alternative negative control, which should not show fluorescence activation over the background. If inconsistent results are observed, one can troubleshoot by checking that the flow cytometer is properly cleaned following the manufacturer's protocol between different experimental runs to prevent any bleed-over of cells or dyes from the previous run to the next.
While the in vitro method presented is useful for comparing the kinetics between fluorogenic aptamers or RNA-based fluorogenic biosensors, the kinetic values obtained may change depending on the temperature, magnesium concentration, or other buffer components used. Also, while this method provides well-defined conditions that have been used previously to characterize different fluorogenic RNA systems, the intracellular environment cannot be perfectly represented due to the presence of other biological macromolecules.
Whereas the fluorescence plate reader equipped with a programmable injector has no dead time for data acquisition, the flow cytometer instrument has limited temporal accuracy due to observable dead time. There is a ~5 s lag between when the "Record" button is clicked and when data acquisition starts. An additional ~5 s lag occurs for the instrument to measure 30,000 events; this sample acquisition time will vary slightly depending on how dilute the cells are in 1x PBS.
Another potential limitation to cellular experiments is the cell viability in 1x PBS. For extended time point analyses, cell viability can be checked using propidium iodide to stain dead cells20. Dye aggregation can also limit the accuracy of fluorescence measurements made by the flow cytometer. Dyes with very limited solubility in aqueous solutions can aggregate and appear as particles large enough to be counted as cells on the flow cytometer. Thus, it is important to run dye-only experimental controls to check for aggregates in the gated region.
Previously, it was shown that Broccoli has comparable brightness to Spinach2 at 1 mM Mg2+ in vitro, but Broccoli-tRNA exhibits ~two-fold greater fluorescence intensity in live E. coli compared to Spinach2-tRNA13. To our knowledge, the dye-binding kinetics for Spinach2 and Broccoli fluorogenic aptamers have not been compared before and modeled by a two-phase association. The initial fast rate constants for both RNA aptamers support that the dye binding pocket is pre-folded and no structural changes are needed for the dye to bind, which is consistent with X-ray crystallography and UV-melting experiments21,22. The second phase with a slower rate constant has not been previously reported because other experiments such as stopped-flow and fluorescence lifetime measurements analyzed the Spinach aptamer for a shorter duration (20 s and 300 s)23,24. The much slower second phase results in an observed biexponential increase in fluorescence when data are analyzed for 600 s. This slow step can be attributed to either a rate-limiting refolding step from a binding-incompetent to binding-competent RNA state or a rate-limiting photoconversion step from trans to cis forms of the bound dye. The latter mechanism was previously modeled to give a biexponential fluorescence profile24 and is supported by a recent analysis of the difference between the absorption and excitation spectra on the related aptamer, Baby Spinach25.
The overall significance of the in vitro findings is that they show that dye association to the fluorogenic RNA aptamer does not limit real-time RNA localization and gene expression studies. For RNA-based fluorescent biosensors that employ Spinach2, the measured turn-on kinetics are similar to the second phase kinetics measured here10 because the biosensors require a refolding step and, thus, should be sufficiently rapid to enable near-real-time signaling studies.
It was expected that the cellular kinetics would be different from the observed in vitro kinetics for Spinach2. One key difference is that there is an additional step of dye diffusion into the E. coli cells, which involves crossing the outer and inner membranes. In addition, the cellular environment poses different conditions for the dye-aptamer association in terms of molecular crowding, ion composition, and concentrations, as well as RNA and dye concentrations.
The overall significance of the results is that cellular fluorescence reaches maximum signal in less than 5 min and remains stable for at least 2 h, which enables real-time RNA localization and gene expression studies in this time range. For an RNA-based biosensor that employs Spinach2, we previously showed that a significant fluorescence response could be observed within 4-5 min of ligand addition but that reaching the maximal signal takes longer (15-30 min)8. Taken together, these findings indicate that dye diffusion into cells is not the practical rate-limiting step for in vivo experiments with RNA-based biosensors. Finally, this experimental protocol can be applied to analyze other fluorogenic RNA systems in cells.
The experimental protocols presented here can be applied to analyze other fluorogenic RNA systems. Beyond the two aptamers analyzed in this study, Spinach2 and Broccoli, other fluorogenic RNA systems have been developed that provide different emission profiles, improved photostability, tighter binding affinities, and the ability to change fluorophores (recently reviewed1). In addition to their fluorescence properties, benchmarking the turn-on kinetics for these systems in vitro and in cells is important to assess their suitability for different cell biological applications. The results also may support structural pre-folding or rearrangement of the aptamer. As discussed, with some modifications, these protocols have also been applied to analyze RNA-based biosensors8.
Disclosures
The authors declare no conflicts of interest.
Acknowledgements
This work was supported by the following grants to MCH: NSF-BSF 1815508 and NIH R01 GM124589. MRM was partially supported by training grant NIH T32 GM122740.
Materials
| Name | Company | Catalog Number | Comments |
|---|---|---|---|
| Agarose | Thermo Fischer Scientific | BP160500 | |
| Agarose gel electrophoresis equipment | Thermo Fischer Scientific | B1A-BP | |
| Alpha D-(+)-lactose monohydrate | Thermo Fischer Scientific | 18-600-440 | |
| Amber 1.5 mL microcentrifuge tubes | Thermo Fischer Scientific | 22431021 | |
| Ammonium persulfate (APS) | Sigma-Aldrich | A3678 | |
| Ammonium sulfate ((NH4)2SO4) | Sigma-Aldrich | A4418 | |
| Attune NxT Flow cytometer | Thermo Fischer Scientific | A24861 | |
| Attune 1x Focusing Fluid | Thermo Fischer Scientific | A24904 | |
| Attune Shutdown Solution | Thermo Fischer Scientific | A24975 | |
| Attune Performance Tracking Beads | Thermo Fischer Scientific | 4449754 | |
| Attune Wash Solution | Thermo Fischer Scientific | J24974 | |
| Boric acid | Sigma-Aldrich | B6768 | |
| Bromophenol blue | Sigma-Aldrich | B0126 | |
| Carbenicillin disodium salt | Sigma-Aldrich | C3416 | |
| Chlorine Bleach | Amazon | B07J6FJR8D | |
| Corning Costar 96-well plate | Daigger Scientific | EF86610A | |
| Culture Tubes, 12 mm x 75 mm, 5 mL with attached dual position cap | Globe Scientific | 05-402-31 | |
| DFHBI | Sigma-Aldrich | SML1627 | |
| DFHBI-1T | Sigma-Aldrich | SML2697 | |
| D-Glucose (anhydrous) | Acros Organics | AC410955000 | |
| Dimethyl sulfoxide (DMSO) | Sigma-Aldrich | D8418 | |
| Dithiothreitol (DTT) | Sigma-Aldrich | DTT-RO | |
| DNA loading dye | New England Biolabs | B7025S | |
| DNA LoBind Tubes (2.0 mL) | Eppendorf | 22431048 | |
| dNTPs: dATP, dCTP, dGTP, dTTP | New England Biolabs | N0446S | |
| EDTA, pH 8.0 | Gibco, Life Technologies | AM9260G | |
| Ethanol (EtOH) | Sigma-Aldrich | E7023 | |
| Filter-tip micropipettor tips | Thermo Fischer Scientific | AM12635, AM12648, AM12655, AM12665 | |
| FlowJo Software | BD Biosciences | N/A | FlowJo v10 Software |
| Fluorescent plate reader with heating control | VWR | 10014-924 | |
| Gel electrophoresis power supply | Thermo Fischer Scientific | EC3000XL2 | |
| Glycerol | Sigma-Aldrich | G5516 | |
| Glycogen AM95010 | Thermo Fischer Scientific | AM95010 | |
| GraphPad Prism | Dotmatics | N/A | Analysis software from Academic Group License |
| Heat block | Thomas Scientific | 1159Z11 | |
| HEPES | Sigma-Aldrich | H-4034 | |
| Inorganic pyrophosphatase | Sigma-Aldrich | I1643-500UN | |
| Low Molecular Weight DNA Ladder | New England Biolabs | N3233L | Supplied with free vial of Gel Loading Dye, Purple (6x), no SDS (NEB #B7025). |
| Magnesium chloride hexahydrate (MgCl2) | Sigma-Aldrich | M2670 | |
| Magnesium sulfate (MgSO4) | Fisher Scientific | MFCD00011110 | |
| Microcentrifuge tubes (1.5 mL) | Eppendorf | 22363204 | |
| Microcentrifuge with temperature control | Marshall Scientific | EP-5415R | |
| Micropipettors | Gilson | FA10001M, FA10003M, FA10005M, FA10006M | |
| Micropipettor tips | Sigma-Aldrich | Z369004, AXYT200CR, AXYT1000CR | |
| Millipore water filter with BioPak unit | Sigma-Aldrich | CDUFBI001, ZRQSVR3WW | |
| Narrow micropipettor pipette tips | DOT Scientific | RN005R-LRS | |
| PBS, 10x | Thermo Fischer Scientific | BP39920 | |
| PCR clean-up kit | Qiagen | 28181 | |
| PCR primers and templates | Integrated DNA technologies | ||
| PCR thermocycler for thin-walled PCR tubes | Bio-Rad | 1851148 | |
| PCR thermocycler for 0.5 mL tubes | Techne | 5PRIME/C | |
| pET31b-T7-Spinach2 Plasmid | Addgene | Plasmid #79783 | |
| Phusion High-Fidelity DNA polymerase | New England Biolabs | M0530L | Purchase of Phusion High-Fideldity Enzyme is supplied with 5x Phusion HF Buffer, 5x Phusion GC Buffer, and MgCl2 and DMSO solutions. |
| Polyacrylamide gel electrophoresis gel comb, C.B.S. Scientific | C.B.S. Scientific | VGC-1508 | |
| Polyacrylamide gel electrophoresis equipment | C.B.S. Scientific | ASG-250 | |
| Potassium chloride (KCl) | Sigma-Aldrich | P9333 | |
| Potassium phosphate monobasic | Sigma-Aldrich | P5655 | |
| Razor blades | Genesee Scientific | 38-101 | |
| rNTPs: ATP, CTP, GTP, UTP | New England Biolabs | N0450L | |
| SDS | Sigma-Aldrich | L3771 | |
| Short wave UV light source | Thermo Fischer Scientific | 11758221 | |
| Sodium carbonate (Na2CO3) | Sigma-Aldrich | S7795 | |
| Sodium chloride (NaCl) | Sigma-Aldrich | S7653 | |
| Sodium hydroxide (NaOH) | Sigma-Aldrich | S8045 | |
| Sodium phosphate dibasic, anhydrous | Thermo Fischer Scientific | S375-500 | |
| SoftMax Pro | Molecular Devices | N/A | SoftMax Pro 6.5.1 (platereader software) obtained through Academic Group License |
| Sterile filter units | Thermo Fischer Scientific | 09-741-88 | |
| Sucrose | Sigma-Aldrich | S0389 | |
| SYBR Safe DNA gel stain | Thermo Fischer Scientific | S33102 | |
| TAE buffer for agarose gel electrophoresis | Thermo Fischer Scientific | AM9869 | |
| Tetramethylethylenediamine (TEMED) | Sigma-Aldrich | T9281 | |
| Tris base | Sigma-Aldrich | TRIS-RO | |
| Tryptone (granulated) | Thermo Fischer Scientific | M0251S | |
| T7 RNA polymerase | New England Biolabs | M0251S | |
| Urea-PAGE Gel system | National Diagnostics | EC-833 | |
| UV fluorescent TLC plate | Sigma-Aldrich | 1.05789.0001 | |
| UV/Vis spectrophotometer | Thermo Fischer Scientific | ND-8000-GL | |
| Vortex mixer | Thermo Fischer Scientific | 2215415 | |
| Xylene cyanol | Sigma-Aldrich | X4126 | |
| Yeast Extract (Granulated) | Thermo Fischer Scientific | BP9727-2 |
References
- Su, Y., Hammond, M. C. RNA-based fluorescent biosensors for live cell imaging of small molecules and RNAs. Current Opinion in Biotechnology. 63, 157-166 (2020).
- Zhang, J., et al. Tandem spinach array for mRNA Imaging in living bacterial cells. Scientific Reports. 5, 17295(2015).
- Wang, Z., et al. In spatial complementation of aptamer-mediated recognition enables live-cell imaging of native RNA transcripts in real time. Angewandte Chemie. 57 (4), 972-976 (2018).
- Strack, R. L., Disney, M. D., Jaffrey, S. R. A superfolding Spinach2 reveals the dynamic nature of trinucleotide repeat-containing RNA. Nature Methods. 10 (12), 1219-1224 (2013).
- Thavarajah, W., et al. Point-of-use detection of environmental fluoride via a cell-free riboswitch-based biosensor. ACS Synthetic Biology. 9 (1), 10-18 (2020).
- You, M., Litke, J. L., Jaffrey, S. R. Imaging metabolite dynamics in living cells using a Spinach-based riboswitch. Proceedings of the National Academy of Sciences of the United States of America. 112 (21), 2756-2765 (2015).
- Kellenberger, C. A., Wilson, S. C., Sales-Lee, J., Hammond, M. C. RNA-based fluorescent biosensors for live cell imaging of second messengers cyclic di-GMP and cyclic AMP-GMP. Journal of the American Chemical Society. 135 (13), 4906-4909 (2013).
- Manna, S., Truong, J., Hammond, M. C. Guanidine biosensors enable comparison of cellular turn-on kinetics of riboswitch-based biosensor and reporter. ACS Synthetic Biology. 10 (3), 566-578 (2021).
- Bose, D., Su, Y., Marcus, A., Raulet, D. H., Hammond, M. C. An RNA-based fluorescent biosensor for high-throughput analysis of the cGAS-cGAMP-STING pathway. Cell Chemical Biology. 23 (12), 1539-1549 (2016).
- Wang, X. C., Wilson, S. C., Hammond, M. C. Next-generation RNA-based fluorescent biosensors enable anaerobic detection of cyclic di-GMP. Nucleic Acids Research. 44 (17), 139(2016).
- Paige, J. S., Thinh, N. -D., Wenjiao, S., Jaffrey, S. R. Fluorescence imaging of cellular metabolites with RNA. Science. 335 (6073), 1194(2012).
- Paige, J. S., Wu, K. Y., Jaffrey, S. R. RNA mimics of green fluorescent protein. Science. 333 (6042), 642-646 (2011).
- Filonov, G. S., Moon, J. D., Svensen, N., Jaffrey, S. R. Broccoli: Rapid selection of an RNA mimic of green fluorescent protein by fluorescence-based selection and directed evolution. Journal of the American Chemical Society. 136 (46), 16299-16308 (2014).
- Song, W., Strack, R. L., Svensen, N., Jaffrey, S. R. Plug-and-play fluorophores extend the spectral properties of spinach. Journal of the American Chemical Society. 136 (4), 1198-1201 (2014).
- Sambrook, J., Fritsch, E., Maniatis, T. Molecular Cloning: A Laboratory Manual. , Cold Spring Harbor Laboratory Press. Cold Spring Harbor, NY. (1989).
- Basch, H., Gadebusch, H. H. In vitro antimicrobial activity of dimethylsulfoxide. Applied Microbiology. 16 (12), 1953-1954 (1968).
- Kallansrud, G., Ward, B. A comparison of measured and calculated single- and double-stranded oligodeoxynucleotide extinction coefficients. Analytical Biochemistry. 236 (1), 134-138 (1996).
- Wilson, S. C., Cohen, D. T., Wang, X. C., Hammond, M. C. A neutral pH thermal hydrolysis method for quantification of structured RNAs. RNA. 20 (7), 1153-1160 (2014).
- Szatmári, D., et al. Intracellular ion concentrations and cation-dependent remodelling of bacterial MreB assemblies. Scientific Reports. 10, 12002(2020).
- Boulos, L., Prévost, M., Barbeau, B., Coallier, J., Desjardins, R. LIVE/DEAD® BacLightTM: Application of a new rapid staining method for direct enumeration of viable and total bacteria in drinking water. Journal of Microbiological Methods. 37 (1), 77-86 (1999).
- Huang, H., et al. A G-quadruplex-containing RNA activates fluorescence in a GFP-like fluorophore. Nature Chemical Biology. 10 (8), 686-691 (2014).
- Jeng, S. C. Y., Chan, H. H. Y., Booy, E. P., McKenna, S. A., Unrau, P. J. Fluorophore ligand binding and complex stabilization of the RNA Mango and RNA Spinach aptamers. RNA. 22 (12), 1884-1892 (2016).
- Han, K. Y., Leslie, B. J., Fei, J., Zhang, J., Ha, T. Understanding the photophysics of the Spinach-DFHBI RNA aptamer-fluorogen complex to improve live-cell RNA imaging. Journal of the American Chemical Society. 135 (50), 19033-19038 (2013).
- Wang, P., et al. Photochemical properties of Spinach and its use in selective imaging. Chemical Science. 4 (7), 2865-2873 (2013).
- Dao, N. T., et al. Photophysics of DFHBI bound to RNA aptamer Baby Spinach. Scientific Reports. 11, 7356(2021).
Reprints and Permissions
