Disruption of the blood-spinal cord barrier (BSCB) can be successfully achieved with the intravenous administration of microbubbles and the application of low-intensity focused ultrasound (LIFU). This protocol details the opening of the BSCB using LIFU in a rodent model, including equipment setup, microbubble injection, target localization, and BSCB disruption visualization.
Method Article
Disruption of the Blood-Spinal Cord Barrier Using Low-Intensity Focused Ultrasound in a Rat Model
In This Article
Summary
Abstract
Low-intensity focused ultrasound (LIFU) uses ultrasonic pulsations at lower intensities than ultrasound and is being tested as a reversible and precise neuromodulatory technology. Although LIFU-mediated blood-brain barrier (BBB) opening has been explored in detail, no standardized technique for blood-spinal cord barrier (BSCB) opening has been established to date. Therefore, this protocol presents a method for successful BSCB disruption using LIFU sonication in a rat model, including descriptions of animal preparation, microbubble administration, target selection and localization, as well as BSCB disruption visualization and confirmation. The approach reported here is particularly useful for researchers who need a fast and cost-effective method to test and confirm target localization and precise BSCB disruption in a small animal model with a focused ultrasound transducer, evaluate the BSCB efficacy of sonication parameters, or explore applications for LIFU at the spinal cord, such as drug delivery, immunomodulation, and neuromodulation. Optimizing this protocol for individual use is recommended, especially for advancing future preclinical, clinical, and translational work.
Introduction
Similar to the blood-brain barrier (BBB), the blood-spinal cord barrier (BSCB) regulates the movement of circulating solutes, cells, and plasma components into the spinal parenchyma1. This protective feature is the result of a specialized system of tightly bound, non-fenestrated endothelial cells lining the spinal capillaries2. Typically, only low-weight, lipophilic molecules with a positive charge can cross both barriers3. Despite studies that suggest the BSCB has a slightly higher permeability than the BBB, both barriers limit the delivery of therapeutics to the central nervous system4. Several strategies have been developed to increase the transport of drugs across the BSCB, including techniques for increasing osmotic pressure in the spinal capillaries, the development of drugs that interact with bradykinin receptors, and the creation of functionalized nanoparticles5.
BSCB disruption can also be achieved via the intravenous administration of microbubbles (MBs) followed by low-intensity focused ultrasound (LIFU) sonication6. The acoustic field generated by the ultrasound transducer causes MB oscillations, which in turn apply stress against the endothelial wall and loosen tight junctions7. The tight junction loosening creates transient gaps in the capillaries, allowing therapeutics to penetrate into the spinal parenchyma (Figure 1). This process can also create transendothelial fenestrations, increase transcytosis, and downregulate ATP-binding cassette transporters, such as P-glycoprotein8,9. A key benefit of this technique is the ability to minimize off-target effects by directing the focal region of sonication to the location of interest in the spinal cord. Several clinical trials have investigated the efficacy of LIFU-mediated BBB opening for the treatment of central nervous system pathologies, including gliomas, amyotrophic lateral sclerosis, Alzheimer's disease, and Parkinson's disease. Although LIFU-mediated BSCB disruption is not as extensively characterized as LIFU-mediated BBB disruption, several groups have reported successful BSCB disruption in rodent, rabbit, and porcine models10,11,12. Overall, interest in the technique is rapidly growing, especially as a viable avenue for drug delivery.
In this protocol, a technique for LIFU-mediated BSCB disruption in a rat model is described. The procedure includes detailed descriptions of animal preparation, LIFU equipment setup, MB administration, target localization, and spinal cord extraction. Confirmation of target localization and BSCB disruption is evaluated via Evans blue dye (EBD) extravasation into the spinal cord. EBD is a non-toxic compound that binds to serum albumin and can be identified by its rich blue color visually and red autofluorescence under microscopy13.
The steps listed here offer a fast and inexpensive alternative to traditional ultrasound (US) or magnetic resonance (MR)-guided LIFU systems. As a result, this method is useful for researchers interested in quickly testing and confirming the targeting and BSCB disruption capabilities of their LIFU transducer before acquiring additional equipment and materials or pursuing LIFU applications at the spinal cord, such as drug delivery, immunomodulation, and neuromodulation.
Protocol
All animal studies were approved and conducted in accordance with the Johns Hopkins University Institutional Animal Care and Use Committee (IACUC RA20M223). Only adult Sprague-Dawley female rats (average weight: 250 g; age: 11 weeks) were used for the present study.
1. Low-intensity focused ultrasound assembly and setup
- Acquire a focused ultrasound transducer system with specifications sufficient to achieve BSCB opening in rats. Suggested parameters from the literature include a central frequency between 0.25-4 MHz and the capability of producing peak pressures between 0.2-2.1 MPa 10,14,15,16,17. Ensure that the system includes the driving/control equipment, which at a minimum includes a wave/signal generator, radio-frequency (RF) drive/power amplifier, and matching network (Figure 2A).
NOTE: The setup described here uses a commercially available multi-element transducer with a central frequency of 250 kHz and 64 mm diameter (Figure 2B). - Affix the 3D-printed probe holder and water cone on the transducer (Figure 2C). Ensure a watertight seal between the cone and transducer.
NOTE: A custom cone and probe holder came included with the transducer used in this Experiment. The cone and probe holder affix to the transducer with screws, which are also provided. - Sterilize a 50 µm thick, acoustically transparent polyester membrane and affix to the bottom of the water cone using a rubber band.
- Fill the water cone with degassed and deionized water using the inlet and outlet tubes. Take care to avoid air bubbles inside the cone, as they can disrupt acoustic coupling between the transducer and target. The polyester membrane should be slightly inflated.
NOTE: To remove air bubbles from the cone, guide the bubbles to the outlet valve while filling the cone with water through the inlet valve. If many small bubbles are present, close all the valves and rotate the cone until one big bubble remains. Guide this bubble to the outlet valve and resume filling the cone. - Connect the driving equipment, which includes the wave generator and RF drive amplifier, to the transducer. The transducer cable will connect to the output side of the matching network, and the signal generator/power amplifier will connect to the input side of the matching network. The cables should be connected to their corresponding channel number (Figure 2D-G).
NOTE: In the commercial system used in this study, the wave generator and RF drive amplifier are components of the transducer power output (TPO) (Figure 2D). - Attach the probe holder to the stereotactic arm. Affix the stereotactic arm to the fixation plate assembly. This will allow the transducer to be positioned precisely above the rodent during sonication.
2. Animal preparation and surgical laminectomy
- Anesthetize the rat with a mixture of isoflurane and medical air in an induction chamber attached to a charcoal filter canister. Set the gas flow rate to 400 mL/min and the isoflurane vaporizer between 1.5%-2.5% for anesthesia induction. The amount of time spent in the chamber before complete sedation is variable, though it typically ranges from 3-6 min.
- Record the weight of the sedated rat and perform a toe pinch test. If jerking or movement is observed in response to the pinch, place the rat back inside the induction chamber for an additional 1 min and repeat the toe pinch test. Repeat as necessary to ensure the rat is and remains fully anesthetized.
- Place a heating pad and sterile absorbent pad on the fixation plate. Position the rat on the absorbent pad, apply eye ointment, and place a rectal thermometer to monitor body temperature.
NOTE: During the length of the surgical procedure, the rat's temperature and heart rate should be monitored (ideally, the heart rate should be between 330-480 bpm and the temperature between 35.9-37.5 °C)18,19. Adjust the isoflurane or heating pad accordingly to prevent premature death. The heating pad can be set to a temperature around 37 °C and should be turned on and off as needed to maintain the optimal body temperature. - Palpate the last rib of the rat, which is attached to the spine at the 13th thoracic vertebra (T13). Use an electric razor to shave the fur off the dorsal surface between the last rib and neck. Wipe the exposed skin with gauze dipped in 10% iodopovidone.
- Create a midline incision using iris scissors and dissect through the fascia until the spinous processes and lamina are exposed. Remove bone with offset bone nippers and angled blade iris scissors until the spinal cord is exposed20. The length of laminectomy and incision varies based on the number of different targets to be sonicated. In this study, a three-level laminectomy was performed using a 3 cm incision.
NOTE: Avoid touching or placing pressure on the spinal cord while removing bone to prevent injury. If the rat's hindlimbs jerk during the laminectomy, then too much force was used on the cord or nerve roots. - Secure the rat to the fixation plate by clamping the spinous processes adjacent to the laminectomy. Slightly pull the spine taut to minimize curvature before locking the clamps.
3. Target localization using laser guidance
- Adjust the position of the transducer with the stereotactic arm until it is located exactly above the laminectomy (Figure 3A). The frame allows movement in the x-, y-, and z-axes, as well as 180° rotation in the vertical plane and 360° rotation in the horizontal plane.
- Affix the laser apparatus to the bottom of the water cone and lower it until the laser point is visible. Adjust the lateral position of the transducer until the laser point is above the location that is the target for BSCB disruption (Figure 3B,C).
NOTE: A computer-aided design (CAD) file for the laser apparatus is included in the supplemental section (Supplemental Figure 1). - Remove the laser apparatus and fill the space between the cone and spinal cord with degassed ultrasound gel (Figure 3D). For maximal coupling, ensure that no air bubbles are present in the gel.
NOTE: In this study, the transducer with an affixed water cone was lowered until located 1 cm above the cord. Since the water cone was 30 mm in length, the total distance from the transducer to the cord was 40 mm. The water cone was placed 1 cm away from the spinal cord because the rat's skin, fascia, and musculature on either side of the incision prevent direct contact between the tip of the cone and the cord. Using the numbers on the stereotactic arm's y-axis may be helpful in keeping track of the vertical distance at which the cone is 1 cm away from the cord, especially since the gel will make visual confirmation of the cone's distance from the cord difficult. - Set the parameters for sonication on the TPO. A range of values can be used to achieve successful BSCB disruption. For maximal power, set the sonication frequency close to the center frequency of the transducer. The values used in this study are listed in Table 1.
NOTE: The parameters listed here were adapted from prior work with LIFU, with a center frequency of 500 kHz, tone burst duration of 500 µs, a duty cycle of 50%, and sonication times of 5 or 10 min to safely neuromodulate a rodent spinal cord21. Based on studies that successfully achieved BSCB disruption, other parameters that can be used are central frequencies between 500 kHz-1 MHz, pressures of 0.2-2.1 MPa, burst lengths of 10-25 ms, and sonication times of 2-5 min6,10,11,22.
| Parameter | Value |
| Frequency (kHz) | 250 |
| Focus Distance (mm) | 40 |
| Acoustic Peak Pressure (MPa) | 0.47 |
| Duty Cycle | 40% |
| Burst Length (ms) | 400 |
| Period (s) | 1 |
| Sonication Time (min) | 5 |
Table 1: Sonication parameters used for BSCB disruption.
4. Microbubble administration
- Prepare a MB solution in accordance with the instructions provided by the manufacturer. Avoid introducing air into the solution.
NOTE: The MBs are fragile and clump together near the top of the vial/syringe if left still for a few minutes. Shake the vial and syringe regularly to prevent an uneven dispersion of MBs. MBs have short lifespans; check the manufacturer's guide to determine the expiration time. - Insert a 22 G tail vein catheter and flush with 0.2 mL of heparinized saline (500 IU/mL)23. To increase the chances of successful tail vein catheterization, dip the tail in warm water and place a tourniquet at the base of the tail to enlarge the vein's diameter.
NOTE: Tail vein catheterization can be conducted prior to animal laminectomy, positioning, and targeting to save study time. - Inject 1 mL/kg of 3% EBD into the catheter. Flush with 0.2 mL of heparinized saline. The rat's extremities and eyes will turn blue. Confirm successful tail vein catheterization by checking for blue color change in the dorsal spinal vein of the rat (Figure 4).
NOTE: EBD can be injected well prior to MB injection and will not influence sonication. In addition, since the Food and Drug administration (FDA) currently has not approved sonication with drugs already in the system, EBD can also be administered after sonication. This will result in less dye uptake, but may be more clinically relevant. - Inject a 0.2 mL bolus of MBs into the catheter and flush with 0.2 mL of heparinized saline. Start the sonication 1-2 min after the injection of MBs. The setup used here does not collect real-time sonication feedback.
NOTE: Studies for BSCB disruption typically use a higher concentration of MBs than indicated for diagnostic imaging. Some concentrations of common MB brands used for BBB and BSCB disruption in rat models include 0.02-0.2 mL/kg and 200 µL boluses10,15,24,25.
5. Spinal cord extraction and tissue processing
- After completion of sonication, transcardially perfuse the rat with 100 mL of cold phosphate-buffered saline (PBS) until the blood runs completely clear. The liver, which is a rich blue color due to the dye, should fade to a light brownish-blue26.
NOTE: The purpose of perfusion is to remove excess blood from the vasculature of the spinal cord. Since EBD binds to albumin, this also removes excess EBD. This ensures that any EBD detected either visually or through fluorescence microscopy in the spinal cord is from the extravasation of dye into the spinal parenchyma. - Transcardially perfuse with 100 mL of cold 4% paraformaldehyde (PFA). The rat's limbs will twitch during this fixation if done thoroughly. This perfusion with PFA euthanizes the rat.
- Remove the spinal cord and place it in 4% PFA at 4 °C overnight. Replace the PFA with PBS the following day.
6. Visualization of BSCB disruption
- Isolate a 2 cm section surrounding the location of sonication using a razor blade. Split the section down the midline with the blade and section into 10 µm thick sections using a microtome. For bright-field visualization, stain with hematoxylin-eosin (H&E) stain.
NOTE: The H&E spinal cord samples shown in this study were stained with hematoxylin for 3 min and eosin for 1 min27. - For fluorescence microscopy, deparaffinize the slides containing the spinal cord sections and counterstain with 25 µL of 4′,6-diamidino-2-phenylindole (DAPI) dissolved in the mounting medium (0.5 µg/mL). Incubate at 4 °C for at least 10 min. Avoid light to prevent bleaching.
NOTE: The deparaffinization can be replaced by using a cryostat to obtain frozen sections. - Use a fluorescent microscope to image all the slides. EBD autofluorescence (excitation: 470 nm and 540 nm; emission: 680 nm) is visible in the red channel, while DAPI is present in the blue channel. Use a light microscope to image the H&E slides.
NOTE: Although this protocol described a non-survival procedure, it was also performed using survival surgical techniques. For survival surgery, disinfect the skin before incision with 3 alternating applications of iodopovidone and administer buprenorphine subcutaneously (0.05 mg/kg) before surgery. Continue to provide subcutaneous buprenorphine every 12 h at least 3 days post-operatively, with additional days if the rat exhibits signs of pain. If spinal cord injury occurs, rats may exhibit urinary retention or abnormal gait. This will present as dragging or delayed movement of the hind limbs or palpable, distended bladders. If this occurs, house rats with nutritionally fortified water gel for food and hydration and manually express bladders twice per day until reflex voiding is recovered. If there is complete paralysis of hind limbs or intractable pain, euthanize the rat.
Results
This paper demonstrates that the concurrent application of LIFU sonication and MB administration is an effective technique for localized BSCB disruption. The opening of the BSCB is indicated by the presence of EBD extravasation into the spinal parenchyma. The changes are apparent both visually and under fluorescence microscopy. The spinal cord vasculature is visible after laminectomy and shows the posterior spinal vein with multiple smaller vessels radiating laterally (Figure 4A). Intravenous injection of EBD through the tail vein catheter results in this vasculature being enriched with blue dye (Figure 4B). This is a good point in the procedure to verify that the laminectomy did not result in the rupture of any spinal vasculature, as this would result in blue blood pooling over the cord. After sonication, a spot of blue should become visible over the targeted location, indicating the extravasation of EBD into the white parenchyma due to BSCB disruption (Figure 4C). The size of this spot varies based on a number of factors, including the size of the focal region of the transducer and the amount of time after sonication. To increase the chances of seeing EBD extravasation, one should lengthen the amount of time between sonication and spinal cord extraction.
Although PFA perfusion is not a necessary step to perform prior to cord extraction and subsequent tissue analysis, it removes blood from the sample and increases the contrast between the white spinal parenchyma and the blue EBD-stained regions. All rats that received MB administration and LIFU sonication show apparent extravasation of EBD into the spinal cord, while negative controls that received MBs and EBD with no LIFU sonication do not. Representative images are shown in Figure 5. Sagittal cuts through the tissues reveal that the EBD extravasation is not only superficial, but extends well into the cord itself. This is expected, since the focal region of the transducer used in this study is greater than the diameter of the rat spinal cord. Sometimes, small amounts of hemorrhage may be seen in the sagittal cuts. This can be due to the laminectomy or the ultrasound sonication. If the hemorrhage is close to the dorsal periphery of the cord, it is more likely due to the laminectomy.
To further evaluate EBD extravasation, sagittal spinal cord sections were stained with DAPI (nuclear marker) and imaged using a fluorescent microscope. All cords that received LIFU sonication (n = 3) showed a significantly greater intensity of EBD autofluorescence (p = 0.016) than cords that did not receive sonication, with similar intensities of DAPI present in both (Figure 6). H&E analysis further revealed no neuronal damage, hemorrhage, or cavity lesions present in the sonicated locations, supporting the safety of this procedure. Examples of injured cords due to surgical mishandling and a high-powered sonication are shown as a comparison. Hemorrhage, tissue damage, cavity lesions, and possible vacuolization are labeled. Although the high-power sonication example does not show hemorrhage, this has also been reported as an effect of ultrasound disruption.
Furthermore, behavioral analysis was conducted on rats that received MBs, EBD, and LIFU sonication. Although this method does not completely exclude tissue damage, it does test if motor deficits occurred due to this procedure. Rats were recorded walking in a cage for 5 min every day over a period of 5 days, and locomotor function was graded based on the Basso Beattie Bresnahan locomotor scale (Supplemental Video File 1). All rats (n = 5) received the highest score before sonication, post-sonication, and every day of the survival period (Figure 7).
Finally, the thermal effects of the sonication parameters used in this study were measured using two ex vivo rat spinal cord samples and a digital thermometer probe with a fine tip inserted into the cord. The temperature of the spinal cord samples was tracked for 5 min before, during, and after sonication, for a total of 15 min. Minimal changes in temperature were seen. In fact, there was ≤1.3 °C change due to sonication in both samples, decreasing the likelihood of hyperthermic injury as a result of sonication (Figure 8).
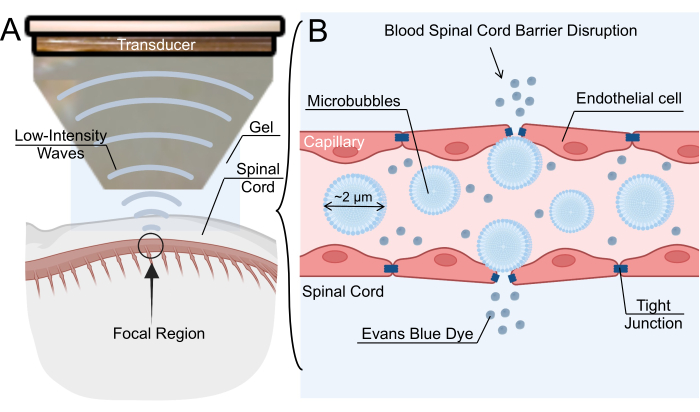
Figure 1: Low-intensity focused ultrasound-mediated blood-spinal cord barrier opening mechanism. (A) Schematic overview of low-intensity focused ultrasound (LIFU) sonication of rat spinal cord. (B) The mechanism for blood-spinal cord barrier (BSCB) opening via LIFU sonication of intravenous microbubbles (MBs). MBs oscillate in response to LIFU, causing the widening of tight junctions between endothelial cells. This disruption of the BSCB allows for the extravasation of nanoparticles, therapeutic drugs, or Evans blue dye. Please click here to view a larger version of this figure.
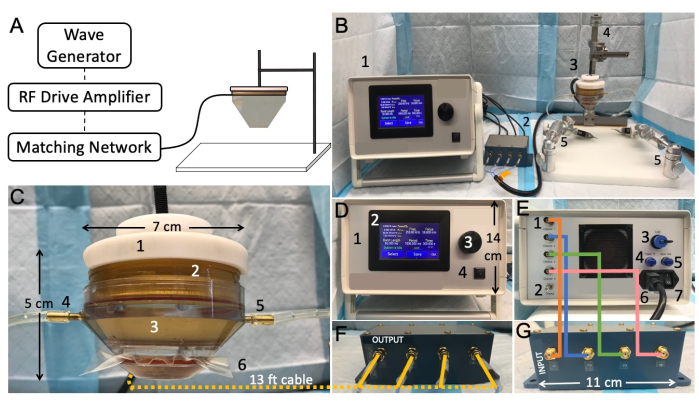
Figure 2: Low-intensity focused ultrasound benchtop setup and connectivity. (A) Schematic representation showing typical focused ultrasound components. (B) Overview picture of the focused ultrasound setup, including: 1. transducer power output (TPO), 2. matching network, 3. LIFU transducer, 4. the stereotaxic instrument, 5. mobile clamps. (C) Transducer, including: 1. probe holder, 2. ring transducer, 3. water cone, 4. water-Inlet tube, 5. water-outlet tube, 6. membrane secured with a rubber band. (D) Front of the TPO, including: 1. RF shielded enclosure, 2. touch-sensitive front display panel with adjustable menu, 3. rotating knob for parameter adjustment, 4. start/stop output switch. (E) Back of the TPO, including: 1. channel output connectors, 2. ground, 3. USB input port for software control, 4. internal trigger, 5. sync output connector, 6. power input jack and supply, 7. on/off power switch. (F) Matching network output, with wires matching channel numbers. (G) Matching network XDR input, with wires matching channel numbers Please click here to view a larger version of this figure.
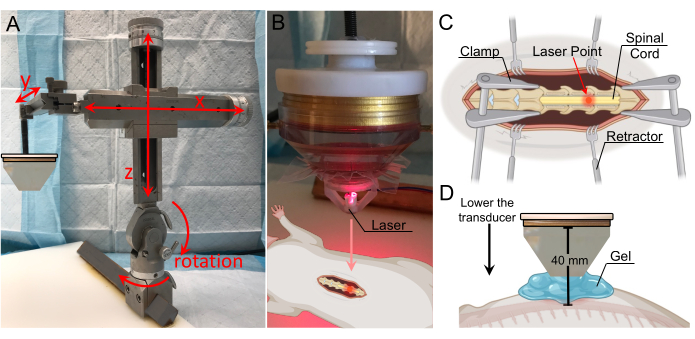
Figure 3: Target localization with laser guidance. (A) Stereotactic arm with range-of-motion in all three axes and rotation capabilities. It is affixed to the fixation plate below. (B) Laser apparatus for identification of the focal zone. The laser is positioned on the tip of the transducer and is in line with the focal region. (C) Illustration showing the laser on the exposed spinal cord, indicating the transducer's focal region is now directed to this location. (D) The transducer is lowered until the tip of the cone is located 1 cm above the cord, and the gap is filled with gel to ensure maximal coupling. The distance from the transducer to the spinal cord is 40 mm (focal distance). Please click here to view a larger version of this figure.
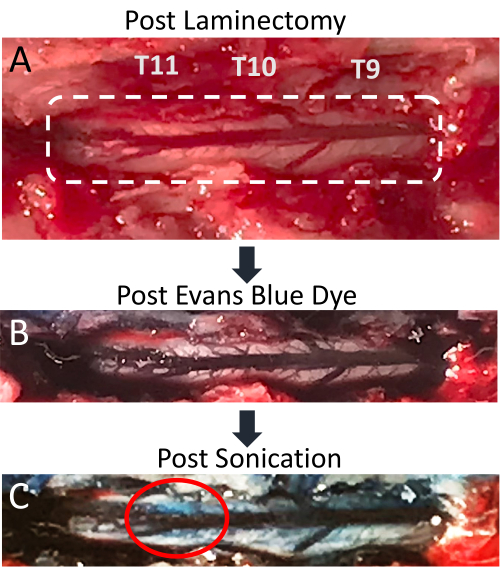
Figure 4: Evans blue dye extravasation in spinal cord post-sonication. (A) Picture of T9-T11 rat laminectomy incision, with the exposed spinal cord and posterior dorsal vein clearly visible. (B) The surrounding tissue and spinal cord vasculature become blue after intravenous injection of Evans blue dye (EBD). (C) EBD extravasation into spinal cord parenchyma at the site of sonication, indicating BSCB disruption has occurred. Please click here to view a larger version of this figure.
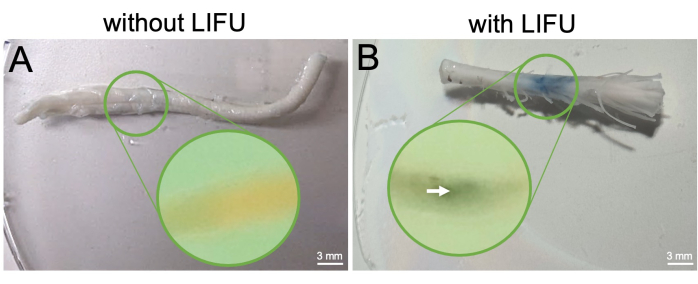
Figure 5: Spinal cord extraction and visualization of BSCB opening post-perfusion. (A) Excised spinal cord from control rat without LIFU treatment. This rat only received MBs and EBD. Mid-sagittal slice of the cord embedded in paraffin is shown in the inset, and no EBD extravasation is visible. (B) Excised spinal cord from rat with LIFU treatment. This rat also received MBs and EBD. The column of EBD extravasation is visible and localized to the sonicated region. Mid-sagittal slice of the cord embedded in paraffin is shown in the inset, with an arrow pointing to the EBD concentration visible inside the sonicated location. Please click here to view a larger version of this figure.
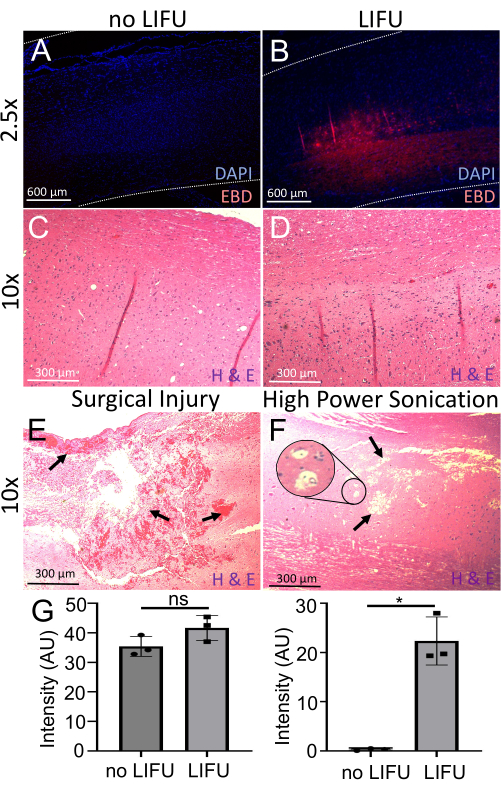
Figure 6: Detection and evaluation of BSCB opening. (A) Spinal cord stained with DAPI (nuclear marker, blue). Minimal EBD autofluorescence (red) is visible. This rat did not receive LIFU. (B) Spinal cord stained with DAPI (nuclear marker, blue). Localized EBD autofluorescence (red) at the sonicated target location is visible. This rat received LIFU and MBs. (C) The spinal cord of a rat without LIFU stained with hematoxylin (nucleic acid stain) and eosin (nonspecific protein stain) (H&E). No neuronal damage, hemorrhage, or cavity lesions are visible. (D) The spinal cord of a rat with LIFU stained with H&E. No neuronal damage, hemorrhage, or cavity lesions are visible. (E) Spinal cord of a rat with surgical injury stained with H&E. Arrows point to ample hemorrhage and tissue damage. (F) The spinal cord of a rat with damage due to high power sonication stained with H&E. Arrows point to cavity lesions, and the inset shows possible vacuolization. (G) Bar graphs showing the intensity of DAPI and EBD in spinal cords of rats with and without LIFU sonication. There is significantly more EBD intensity in the LIFU spinal cord when compared to the negative control (p = 0.016), despite similar DAPI intensity (p > 0.05). Please click here to view a larger version of this figure.
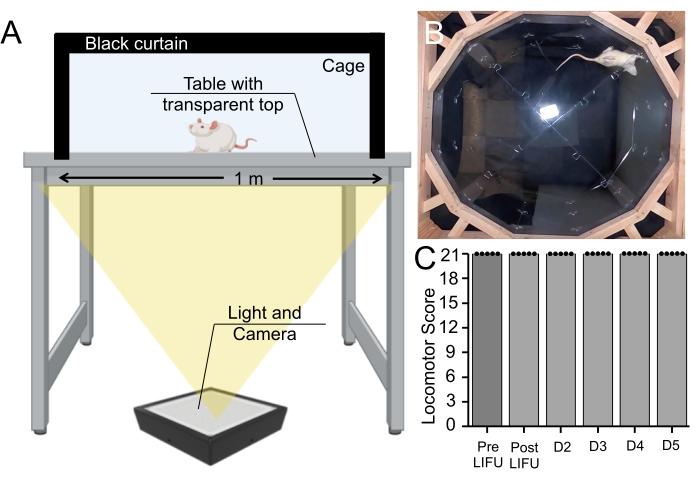
Figure 7: Behavioral assay pre- and post-sonication. (A) Basso, Beattie, Bresnahan apparatus setup, in which rats were recorded walking for 5 min from below. (B) Still image from a recorded video. This video was used to rate the rat's motor coordination and gait on the Basso, Beattie, Bresnahan scale. (C) Boxplot (n = 5) showing no change in motor scores pre-sonication, post-sonication, or during a 5-day survival period in rats that received MBs and LIFU treatment (p > 0.05). Please click here to view a larger version of this figure.
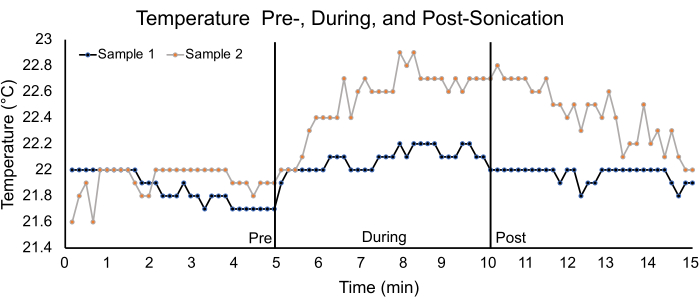
Figure 8: Temperature analysis using ex vivo spinal cords. Graph depicting temperature changes in two ex vivo spinal cord samples for a 5 min pre-, during- and post-sonication duration. The parameters used for sonication are listed in Table 1. For sample 1, the pre-, during-, and post-sonication average temperatures were 21.9 °C ± 0.1 °C, 22.1 °C ± 0.1 °C, and 22.0 °C ± 0.1 °C, respectively. For sample 2, the pre-, during-, and post- sonication temperatures were 21.9 °C ± 0.1 °C, 22.5 °C ± 0.3 °C, and 22.4 °C ± 0.2 °C, respectively. Please click here to view a larger version of this figure.
Supplementary Figure 1: CAD file of laser targeting apparatus. (A) View of the laser apparatus from below. Any laser can be placed within the central hole in the middle. (B) Lateral view of the laser apparatus. (C) Dimensions of the laser apparatus, with units in inches. Please click here to download this File.
Supplementary Video File 1: Video of a rat walking in the Basso, Beattie, Bresnahan apparatus. Please click here to download this File.
Discussion
Here, the equipment and steps required for effective and targeted BSCB disruption using low-intensity focused ultrasound (LIFU) combined with microbubble (MB) administration are described. This protocol is flexible and can be optimized for individual use with transducers of varying specifications. Other techniques for LIFU-mediated BSCB disruption rely on the use of magnetic resonance imaging (MRI)-guided systems for target localization, which is an expensive resource16. The advantages of the technique presented here lie in the quick real-time visual confirmation of BSCB disruption and the ease of targeting due to the open nature of the procedure. Furthermore, the laser apparatus is simple to use and construct, and a CAD file is included in the supplemental section. As a result, researchers interested in conducting initial tests on the targeting capabilities of their LIFU transducer in a small animal model can use this protocol as a tool to quickly confirm focal zone positioning over a location of interest. This technique may also be used by labs beginning to study clinical applications of LIFU, such as drug delivery, before investing in more complex guidance modalities like US or MR systems. Currently, US-guided modalities present a more promising and cost-effective path compared to MR systems, though the latter are more frequently seen in the literature.
There are several critical steps in this procedure that must be carefully executed to ensure successful BSCB disruption. It is imperative to avoid placing unnecessary pressure on the spinal cord during the surgical laminectomy. Too much physical manipulation of the cord increases the likelihood of damage to the BSCB. Damage appears as a dark brown spot inside the cord after extraction due to hemorrhage and heightened EBD extravasation. Furthermore, maximal coupling must be ensured between the transducer and exposed spinal cord. As a result, care must be taken to remove bubbles from the water cone and ultrasound gel. There should be no gaps between the bottom of the water cone and the cord to ensure full transmission of the acoustic wave. During the tail vein catheterization, one should avoid accidentally passing air along with the heparinized saline, EBD, or MB solutions. The injection of air greatly increases the chance of a pulmonary embolism that results in rodent death before the conclusion of the procedure28.
A common issue that may be encountered during this procedure is failure of successful EBD injection. For individuals with minimal experience in tail vein catheterization, performing this step prior to animal laminectomy, positioning, or targeting will save time. EBD can also be injected well before MB injection without influencing sonication. Utilizing the tourniquet and warm water bath suggested in this protocol will help dilate the tail veins and increase the success rate. Furthermore, rat dehydration reduces the likelihood of correct catheter placement. An intraperitoneal saline injection 10-15 min prior to tail vein catheterization may help. During the catheterization, one should start 2 in above the end of the tail and move in a caudal to cranial direction. Moving in the opposite direction decreases the likelihood of success due to potential vein collapse or hemorrhage.
Another common challenge involves the lack of EBD extravasation despite sonication. This may indicate that the parameters being used for sonication are insufficient for BSCB disruption. For instance, if the sonication frequency is set at a value that greatly differs from the central frequency of the transducer, the sonication power will be too low to oscillate MBs and cause tight junction loosening. Furthermore, the more interfaces between the transducer and cord (e.g., water cone, membrane, gel, air bubbles in water/gel), the lower the true sonication intensity will be at the target. Minimizing these interfaces, such as by using degassed gel and thoroughly removing bubbles inside the cone, will help transmit the full potential of the sonication. The protocol also encourages increasing the time between sonication and perfusion to allow more time for EBD extravasation into the spinal parenchyma. Although BSCB disruption is a transient procedure, the gaps are present for several hours before closing. A long wait time increases the exposure to isoflurane, but also results in greater EBD extravasation in the cord. Alternatively, EBD extravasation may be present despite no sonication with LIFU. To troubleshoot this issue, care must be taken during the laminectomy to prevent any accidental damage to the BSCB. Potential solutions include lifting the rat spine during clamping to increase the amount of space between the laminae and cord, as well as a shorter laminectomy. A thorough PFA perfusion also reduces background staining by removing EBD-enriched blood from the vasculature within the spinal cord. During the transcardial perfusion, care must be taken to prevent accidental rupture of the heart, which can result in leakage of PBS or PFA.
It is important to note that this study represents a single center experience for LIFU-mediated BSCB disruption. Furthermore, this protocol does not test or optimize various sonication energy parameters and MB concentrations. As a result, researchers are encouraged to investigate various parameters and concentrations when performing this technique to optimize target localization and BSCB disruption for their particular research needs, especially if initial results produce any adverse effects. Groups who would like to see no temperature changes, for example, can test various parameters until they find a set that meet this criterion and achieve sufficient BSCB disruption. Furthermore, additional experiments can be conducted to confirm the safety of this technique. For instance, sample sizes can be increased, the survival period can be extended, and electromyography/gait analysis studies can be conducted. For longer survivals, it is important to keep in mind that some studies show high doses of EBD can sometimes cause chronic systemic toxicity, so a lower dose may be prudent29.
Another limitation of this procedure is the invasive nature of the laminectomy (which is required for any technique that uses LIFU for BSCB opening since ultrasound cannot penetrate through bone). The invasive nature of this procedure can be reduced by limiting the length of the laminectomy. Performing the laminectomy in the upper thoracic vertebrae, which are shorter and thinner, can reduce the time needed for laminectomy to below 10 min. Due to the fragile nature of the MBs, as well as their short half-life, time is limited during this protocol. The injection of MBs should occur 1-2 min before treatment with LIFU, and new MBs should be administered before every sonication if multiple LIFU treatments are being performed. For experiments involving BSCB disruption for multiple rats, several MB vials may need to be prepared. As microbubbles are expensive, altering the surgical workflow to minimize the time between sonications is preferred to conserve the number of MBs used.
The technique described here is primarily for use as a research protocol. Although the laser targeting apparatus will not replace traditional targeting modalities in all clinical settings, it may be useful in other situations. For noninvasive surgeries, traditional MRI modalities can be reliably used for targeting30. For invasive surgeries that include a laminectomy being performed, the laser point apparatus described in this protocol can be used to quickly localize the center of the focal zone of sonication over a specific region (for instance, a tumor or a site of spinal cord injury) for the purposes of drug delivery or immunomodulatory therapy while supplementing any MR-guidance that would be taking place.
Overall, this protocol describes an effective and successful technique for BSCB disruption and includes several options for confirmation of the BSCB opening, both in real-time and post-processing. With the BSCB functioning as a barrier to entry into the spinal cord parenchyma, disruption of the BSCB is a possible method to improve the delivery of therapeutics. For example, Weber-Adrian et al. used LIFU with a frequency of 1.114 MHz and burst length of 10 ms to mediate gene delivery to the cervical spine6. Similarly, Smith et al. showed that LIFU with a frequency of 580 kHz, average acoustic peak pressures around 0.46 MPa, and a burst length of 10 ms could aid in the delivery of a monoclonal antibody, trastuzumab, to the spinal cord in a rodent model of leptomeningeal metastases10. Most studies have focused on utilizing LIFU, rather than HIFU, due to LIFU's ability to transiently permeabilize the BSCB while avoiding damage to the underlying tissue. Typically, LIFU uses intensities between 0.125-3 W/cm2, while HIFU uses intensities from 100-10,000 W/cm2 or higher31. As a result, HIFU exerts its effects primarily through heating tissue, while LIFU, with the coadministration of MBs, works through mechanical cavitation effects. Coadministration of therapeutics with MBs can result in greater extravasation of the drug into the spinal parenchyma, as well as the potential to load MBs with drug and lyse the MBs with ultrasound for targeted drug delivery.
The sonication parameters, MB concentration, and type of transducer used in this study can be altered based on experimental needs. For example, a transducer with a smaller focal region may be preferable for experiments in which greater control is needed over localized targeting, while a transducer with higher power may be used for experiments that require powerful disruption in a shorter amount of time. Due to the flexibility offered by this protocol, there is great potential for use in preclinical, clinical, and translational research.
Disclosures
The authors declare that the research was conducted in the absence of any commercial or financial relationships that could be construed as a potential conflict of interest. Amir Manbachi teaches and consults for BK Medical (GE Healthcare), Neurosonics Medical, and is an inventor on a number of patent-pending FUS technologies. Betty Tyler has research funding from NIH and is a co-owner for Accelerating Combination Therapies (including equity or options). Ashvattha Therapeutics Inc. has also licensed one of her patents and is a stockholder for Peabody Pharmaceuticals. Nicholas Theodore receives royalties from and owns stock in Globus Medical. He is a consultant for Globus Medical and has served on the scientific advisory board/other office for Globus Medical. The remaining authors have no conflict of interest to disclose.
Acknowledgements
Supported by T32GM136577 (D.R.); N660012024075 (N.T., N.V.T., A.M., K.K.L.); R01 HL139158-01A1 and R01 HL071568-15 (N.V.T.); Johns Hopkins ICTR Clinical Research Scholars Program (KL2) (A.M). Several figures created with BioRender.com.
Materials
| Name | Company | Catalog Number | Comments |
|---|---|---|---|
| 0.9% Heparinized Sodium Chloride | Baxter | FKB0953G | Flush tail vein catheter with heparinized saline to prevent clotting. |
| 100 mL Luer Lock Tip Syringe (2) | Wilburn Medical | WUSA/120 | One syringe can be used to inject PBS and one for PFA (during transcardial perfusion) |
| 1x Phosphate buffered saline (PBS) | Thermo Scientific | 10010001 | For transcardial perfusion. |
| 22 G catheter | Med Vet International | 50-209-1694 | Use to place a tail vein catheter. |
| 97% Isoflurane | Thermo Scientific Chemicals | 247-897-7 | While rat is under isoflurane, be careful not to administer too much. A high dose can euthanize the rat. |
| Betadine 7.5% | Purdue Products | 4677 | |
| Class A clear threaded glass vial | Fisherbrand | 14-955-314 | Use to store spinal cord extraction. |
| Digital balance scale | Kent Scientific | SCL-4000 | |
| Electric razor | Wahl Home Products | 79449-200 | Shave fur off skin at incision site before surgery |
| Eosin-Y with Phloxine | Epredia | 71304 | |
| Evans blue dye | MP Biomedicals | 02151108-CF | Although it is non-toxic, it will stain skin blue if direct contact occurs. |
| Fixation Plate Assembly with 0.5 mm Forceps | PSI Impactors | 7001-2 | Affix the stereotactic arm to this frame |
| Gauze | Fisherbrand | 13-761-52 | |
| Heating pad | Kent Scientific | RT-0515 | |
| Hematoxylin | Epredia | 7211 | |
| Iris Scissors with Angled Blades | ProDentUSA | 12-15315 | |
| Isoflurane induction system | Kent Scientific | SOMNO-RATKIT | |
| Laser targetting apparatus | NA | custom | CAD design file provided in supplemental section. Simply place a laser inside the apparatus created from the file. |
| Lubricating eye ointment | Systane | N/A | |
| Luer Lock 3-Way Stopcock | Sigma | SAS7521-10EA | Can use to fill water cone through inlet valve |
| Lumason microbubbles kit | Bracco | 0270-7099-16 | |
| Microscope cover glass | Fisherbrand | 12-545J | |
| Microscope slides | Fisherbrand | 12-550-15 | |
| Microtome | Epredia | 23-900-671 | |
| Mounting medium with 4',6-diamidino-2-phenylindole (DAPI) | Vector Laboratories | H-2000-2 | |
| Mylar membrane | Chemplex | 3016 | Can cut membrane to appropriate size if too large for cone |
| NeuroFUS 2.52" diameter 250 kHz transducer | Sonic Concepts | CTX-250 | Transducer system includes custom water cone and probe holder |
| NeuroFUS PRO v2.0 system | Sonic Concepts | NFS102v2 | Includes Transducer Power Output, Matching Network and associated cables |
| Offset Bone Nippers | Fine Science Tools | 16101-10 | Use to remove spinous processes and laminae for laminectomy |
| Paraffin | Polysciences | 24364-1 | Can place spinal cord sample in paraffin to slice into thin sections for histology. |
| Paraformaldehyde (4%) | Thermo Scientific | J61899-AK | For transcardial perfusion. |
| Rat Surgical Kit | Kent Scientific | INSRATKIT | Consists of tweezer #5, needle holder, McPherson-Vannas scissors, Iris scissors, ALM self-retaining retractors, Iris forceps, and blunt probe. These products should be sufficient to perform a laminectomy. |
| Razor blade | Fisherbrand | 12-640 | Use to cut spinal cord extraction to desirable length and split section down midline. |
| Rectal thermometer | Kent Scientific | RET-2 | Maintain rat temperature between 35.9–37.5 °C |
| Rubber band | Fisherbrand | 50-205-1983 | |
| Single animal vaporizer unit | Kent Scientific | SF-01 | |
| Stereotactic arm | Kopf Instruments | Model 963 | |
| Sterile absorbent pad | McKesson | 4033-CS150 | Place under rat and above heating pad and fixation plate before laminectomy |
| Ultrasound gel | Aquasonic | PLI 01-34 | Ensure gel is free of bubbles to the best of your ability. |
References
- Chopra, N., et al. Blood-spinal cord barrier: Its role in spinal disorders and emerging therapeutic strategies. NeuroSci. 3 (1), 1-27 (2021).
- Bartanusz, V., Jezova, D., Alajajian, B., Digicaylioglu, M. The blood-spinal cord barrier: morphology and clinical implications. Annals of Neurology. 70 (2), 194-206 (2011).
- Hersh, A. M., Alomari, S., Tyler, B. M. Crossing the blood-brain barrier: Advances in nanoparticle technology for drug delivery in neuro-oncology. International Journal of Molecular Sciences. 23 (8), 4153(2022).
- Pan, W., Banks, W. A., Kastin, A. J. Permeability of the blood-brain and blood-spinal cord barriers to interferons. Journal of Neuroimmunology. 76 (1-2), 105-111 (1997).
- Bellettato, C. M., Scarpa, M. Possible strategies to cross the blood-brain barrier. Italian Journal of Pediatrics. 44, 131(2018).
- Weber-Adrian, D., et al. Gene delivery to the spinal cord using MRI-guided focused ultrasound. Gene Therapy. 22 (7), 568-577 (2015).
- Hersh, A. M., et al. Applications of focused ultrasound for the treatment of glioblastoma: A new frontier. Cancers. 14 (19), 4920(2022).
- Sheikov, N., McDannold, N., Vykhodtseva, N., Jolesz, F., Hynynen, K. Cellular mechanisms of the blood-brain barrier opening induced by ultrasound in presence of microbubbles. Ultrasound in Medicine & Biology. 30 (7), 979-989 (2004).
- Cho, H., et al. Localized down-regulation of P-glycoprotein by focused ultrasound and microbubbles induced blood-brain barrier disruption in rat brain. Scientific Reports. 6, 31201(2016).
- Smith, P., Ogrodnik, N., Satkunarajah, J., O'Reilly, M. A. Characterization of ultrasound-mediated delivery of trastuzumab to normal and pathologic spinal cord tissue. Scientific Reports. 11 (1), 4412(2021).
- Montero, A. S., et al. Ultrasound-induced blood-spinal cord barrier opening in rabbits. Ultrasound in Medicine & Biology. 45 (9), 2417-2426 (2019).
- Fletcher, S. P., Choi, M., Ogrodnik, N., O'Reilly, M. A. A porcine model of transvertebral ultrasound and microbubble-mediated blood-spinal cord barrier opening. Theranostics. 10 (17), 7758-7774 (2020).
- Honeycutt, S. E., O'Brien, L. L. Injection of Evans blue dye to fluorescently label and image intact vasculature. BioTechniques. 70 (3), 181-185 (2021).
- Fletcher, S. P., Choi, M., Ramesh, R., O'Reilly, M. A. Focused ultrasound-induced blood-spinal cord barrier opening using short-burst phase-keying exposures in rats: A parameter study. Ultrasound in Medicine & Biology. 47 (7), 1747-1760 (2021).
- Cross, C. G., et al. Technical note: Quantification of blood-spinal cord barrier permeability after application of magnetic resonance-guided focused ultrasound in spinal cord injury. Medical Physics. 48 (8), 4395-4401 (2021).
- Hong, Y. R., et al. Ultrasound stimulation improves inflammatory resolution, neuroprotection, and functional recovery after spinal cord injury. Scientific Reports. 12 (1), 3636(2021).
- Liao, Y. H., et al. Low-intensity focused ultrasound alleviates spasticity and increases expression of the neuronal K-Cl cotransporter in the L4-L5 sections of rats following spinal cord injury. Frontiers in Cellular Neuroscience. 16, 882127(2022).
- Redfors, B., Shao, Y., Omerovic, E. Influence of anesthetic agent, depth of anesthesia and body temperature on cardiovascular functional parameters in the rat. Laboratory Animals. 48 (1), 6-14 (2014).
- Lillie, L. E., Temple, N. J., Florence, L. Z. Reference values for young normal Sprague-Dawley rats: weight gain, hematology and clinical chemistry. Human & Experimental Toxicology. 15 (8), 612-616 (1996).
- Lin, X. J., et al. Spinal cord lateral hemisection and asymmetric behavioral assessments in adult rats. Journal of Visualized Experiments. (157), e57126(2020).
- Tsehay, Y., et al. Low-intensity pulsed ultrasound neuromodulation of a rodent's spinal cord suppresses motor evoked potentials. IEEE Transactions on Biomedical Engineering. , (2023).
- Payne, A. H., et al. Magnetic resonance imaging-guided focused ultrasound to increase localized blood-spinal cord barrier permeability. Neural Regeneration Research. 12 (12), 2045-2049 (2017).
- Saleem, M., et al. A new best practice for validating tail vein injections in rat with near-infrared-labeled agents. Journal of Visualized Experiments. (146), e59295(2019).
- Sabbagh, A., et al. Opening of the blood-brain barrier using low-intensity pulsed ultrasound enhances responses to immunotherapy in preclinical glioma models. Clinical Cancer Research. 27 (15), 4325-4337 (2021).
- Dréan, A., et al. Temporary blood-brain barrier disruption by low intensity pulsed ultrasound increases carboplatin delivery and efficacy in preclinical models of glioblastoma. Journal of Neuro-Oncology. 144 (1), 33-41 (2019).
- Gage, G. J., Kipke, D. R., Shain, W. Whole animal perfusion fixation for rodents. Journal of Visualized Experiments. (65), e3564(2012).
- Feldman, A. T., Wolfe, D. Tissue processing and hematoxylin and eosin staining. Methods in Molecular Biology. 1180, 31-43 (2014).
- Yamamoto, H., Imai, S., Okuyama, T., Tsubura, Y. Pulmonary lesions in rats caused by intravenous injection. Acta Pathologica Japonica. 32 (5), 741-747 (1982).
- Saunders, N. R., Dziegielewska, K. M., Møllgård, K., Habgood, M. D. Markers for blood-brain barrier integrity: how appropriate is Evans blue in the twenty-first century and what are the alternatives. Frontiers in Neuroscience. 9, 385(2015).
- Mainprize, T., et al. Blood-brain barrier opening in primary brain tumors with non-invasive MR-guided focused ultrasound: A clinical safety and feasibility study. Scientific Reports. 9 (1), 321(2019).
- Elhelf, I. A. S., et al. High intensity focused ultrasound: The fundamentals, clinical applications and research trends. Diagnostic and Interventional Imaging. 99 (6), 349-359 (2018).
Reprints and Permissions
