Here, we describe a protocol, the extended endothelial cell culture method (EECM), that allows differentiation of pluripotent stem cells to brain microvascular endothelial cell (BMEC)-like cells. These cells show endothelial cell adhesion molecule expression and are thus a human blood-brain barrier model suitable to study immune cell interactions in vitro.
Method Article
Differentiation of Human Induced Pluripotent Stem Cells to Brain Microvascular Endothelial Cell-Like Cells with a Mature Immune Phenotype
In This Article
Summary
Abstract
Blood-brain barrier (BBB) dysfunction is a pathological hallmark of many neurodegenerative and neuroinflammatory diseases affecting the central nervous system (CNS). Due to the limited access to disease-related BBB samples, it is still not well understood whether BBB malfunction is causative for disease development or rather a consequence of the neuroinflammatory or neurodegenerative process. Human induced pluripotent stem cells (hiPSCs) therefore provide a novel opportunity to establish in vitro BBB models from healthy donors and patients, and thus to study disease-specific BBB characteristics from individual patients. Several differentiation protocols have been established for deriving brain microvascular endothelial cell (BMEC)-like cells from hiPSCs. Consideration of the specific research question is mandatory for the correct choice of the respective BMEC-differentiation protocol. Here, we describe the extended endothelial cell culture method (EECM), which is optimized to differentiate hiPSCs into BMEC-like cells with a mature immune phenotype, allowing the study of immune cell-BBB interactions. In this protocol, hiPSCs are first differentiated into endothelial progenitor cells (EPCs) by activating Wnt/β-catenin signaling. The resulting culture, which contains smooth muscle-like cells (SMLCs), is then sequentially passaged to increase the purity of endothelial cells (ECs) and to induce BBB-specific properties. Co-culture of EECM-BMECs with these SMLCs or conditioned medium from SMLCs allows for the reproducible, constitutive, and cytokine-regulated expression of EC adhesion molecules. Importantly, EECM-BMEC-like cells establish barrier properties comparable to primary human BMECs, and due to their expression of all EC adhesion molecules, EECM-BMEC-like cells are different from other hiPSC-derived in vitro BBB models. EECM-BMEC-like cells are thus the model of choice for investigating the potential impact of disease processes at the level of the BBB, with an impact on immune cell interaction in a personalized fashion.
Introduction
The neurovascular unit (NVU) in the central nerve system (CNS) consists of the highly specialized microvascular endothelial cells (ECs), pericytes embedded in the endothelial basement membrane as well as the parenchymal basement membrane and astrocyte end-feet1. Within the NVU, brain microvascular endothelial cells (BMECs) are the key components that form the blood-brain barrier (BBB). BMECs form complex and continuous tight junctions and have extremely low pinocytotic activity compared to microvascular ECs in peripheral organs, which allow the BBB to inhibit the free paracellular diffusion of water-soluble molecules into the CNS. The expression of specific influx transporters and efflux pumps by BMECs ensures the uptake and export of nutrients and harmful molecules, respectively, from the CNS2. In addition, the BBB strictly controls immune cell entry into the CNS by expressing low levels of endothelial adhesion molecules crucial for immune cell trafficking into the CNS3. Under physiological conditions, the expression levels of adhesion molecules on the surface of BMECs, such as intercellular adhesion molecule-1 (ICAM-1) and vascular cell adhesion molecule-1 (VCAM-1), are low, but these levels increase in some neurological disorders2. Morphological and functional breakdown of the BBB is reported in many neurological diseases, such as stroke4, multiple sclerosis (MS)5, and several neurodegenerative diseases6,7,8. Detailed investigation of the cellular and molecular characteristics of BMECs under both physiological and pathological conditions is an approach to identifying novel therapeutic strategies that target the BBB.
Until recently, primary or immortalized human and rodent BMECs were used to study the BBB. However, whether conclusions based on animal models of the BBB are readily applicable to the human BBB is unclear, since the expression of several important molecules, including adhesion molecules and solute carrier proteins, differs between humans and rodents9,10. Although human BMEC lines like hCMEC/D3 express appropriate levels of adhesion molecules11, these immortalized BMECs generally do not have complex tight junctions and robust barrier properties12. Primary human BMECs are useful to study barrier functions13, but they are not readily available to all researchers. Further, primary BMECs from patients can be difficult to obtain since they must be collected through a brain biopsy or surgery that is only performed under specific clinical conditions.
Recent advances in stem cell technology have allowed the differentiation of various human cell types, arising from stem cell sources like human induced pluripotent stem cells (hiPSCs). The hiPSC-derived models allow us to establish pathophysiological models using patient-derived samples. Several hiPSC-derived cell types can be combined to establish autologous co-cultures or organoids that better mimic physiological conditions. Several widely-used protocols14,15,16,17,18,19 may be used to differentiate hiPSC-derived BMEC-like cells that have robust diffusion barrier properties with the expression of BBB-specific transporters and efflux pumps, and are useful to study the paracellular diffusion of small molecules, molecular transport mechanisms, and drug delivery to the brain20,21. However, previous studies have shown that widely used hiPSC-derived BMEC-like cells lack the expression of key endothelial adhesion molecules, including VCAM-1, selectins, and ICAM-2, which are responsible for mediating interactions between immune cells and the BBB22. Furthermore, previous hiPSC-derived BMECs have been reported to display mixed endothelial and epithelial characteristics at the transcriptional level23. Therefore, we developed the extended endothelial cell culture method (EECM), a novel protocol that allows the differentiation of hiPSCs into BMEC-like cells that resemble primary human BMECs with respect to morphology, barrier characteristics, and endothelial adhesion molecule expression. This protocol describes the detailed methodological procedures to differentiate hiPSCs to BMEC-like cells displaying a mature immune phenotype.
Protocol
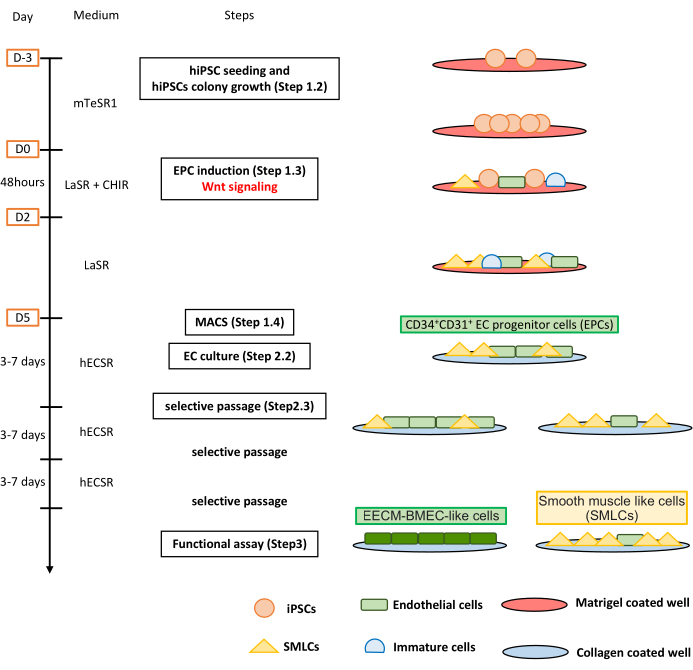
Figure 1: Overview of the protocol. The manuscript presents a step-by-step protocol for differentiating hiPSCs into EECM-BMEC-like cells. The right schemes depict the cell populations at each step. Please click here to view a larger version of this figure.
The hiPSC line, HPS1006, was provided by the RIKEN BRC through the National Bio-Resource Project of the MEXT/AMED, Japan.
1. Induction of hiPSC differentiation into endothelial progenitor cells (EPCs)
- Extracellular matrix (ECM)-coated plates and reagents
- Prepare basement membrane matrix-coated 12-well plates by aliquoting 2.5 mg of matrix gel into 50 mL centrifuge tubes for storage at -20 °C for up to 6 months. Add 30 mL of cold Dulbecco's modified Eagle's medium/nutrient mixture F-12 (DMEM/F12), which has been kept in a refrigerator (4 °C), into the tube. Mix gently by pipetting until the gel has thawed and then add 500 µL of the solution to each well of the 12-well plate. Place the plate in an incubator (37 °C, 5% CO2) for at least 1 h.
NOTE: The basement membrane matrix gel is temperature-sensitive and should be handled according to the manufacturer's instructions for aliquoting and plate coating. The concentration of extracellular matrix proteins can vary between batches. To ensure accuracy, the exact concentration should be referred to on the quality certificate sheet for the specific batch, using the lot number. For instance, if the exact concentration is 10.0 mg/mL, use 250 µL of gel for a total of 2.5 mg. - Prepare rho-kinase (ROCK) inhibitor stock solution by dissolving the ROCK inhibitor in sterile water to a concentration of a 10 mM (Table 1). Aliquot the stock solution in 100-200 µL volumes and store at -20 °C to avoid freeze-thaw cycles.
- Make a 100 mg/mL stock solution of L-ascorbic acid by dissolving 5 g of L-ascorbic acid in 50 mL of sterile water and store at -20 °C (Table 1). Add 6.25 mL of glutamine and 305 µL of L-ascorbic acid stock solution into 500 mL of advanced DMEM/F12 to make an LaSR medium24 (Table 1). Store at 2-8 °C for up to 2 weeks.
- Prepare CHIR99021 solution by dissolving CHIR99021 in undiluted dimethyl sulfoxide (DMSO) to a final concentration of 10 mM (Table 1). Aliquot the solution into 100-200 µL volumes to avoid freeze-thaw cycles and store at -20 °C for up to 1 year. Store working aliquots of the stock solution at 4 °C for up to 1 month.
- Prepare DMEM/F12-10 medium by adding 50 mL of heat-inactivated fetal bovine serum to 450 mL of DMEM/F12. Store the medium at 2-8 °C for up to 1 month (Table 1).
- Prepare flow buffer-1 by adding 33.3 mL of 7.5% bovine serum albumin (BSA) to 467 mL of Dulbecco's phosphate-buffered saline (PBS) (Table 1). Store at 2-8 °C for up to 6 months.
- Prepare basement membrane matrix-coated 12-well plates by aliquoting 2.5 mg of matrix gel into 50 mL centrifuge tubes for storage at -20 °C for up to 6 months. Add 30 mL of cold Dulbecco's modified Eagle's medium/nutrient mixture F-12 (DMEM/F12), which has been kept in a refrigerator (4 °C), into the tube. Mix gently by pipetting until the gel has thawed and then add 500 µL of the solution to each well of the 12-well plate. Place the plate in an incubator (37 °C, 5% CO2) for at least 1 h.
- Seeding of singularized hiPSCs and expansion for EPC differentiation (Day -3 to Day -1)
- Begin differentiation when the hiPSC colonies in a 6-well plate show no spontaneous differentiation and have the appropriate density for passaging, typically around 80% confluency (2.5-3.5 x 10⁶ cells). Carefully monitor spontaneously differentiated cells under the microscope to ensure whether multiple passages are required to eliminate non-differentiated cells. Refer to the note provided below step 1.4.15 for information regarding cell culture medium and extracellular matrix.
- Aspirate the medium and add 1 mL of dissociation reagent to the wells and incubate for 5-7 min at 37 °C. Dissociate and singularize the cells by pipetting the dissociation reagent solution gently over the surfaces of the wells two or three times.
- Transfer the detached cells into a 15 mL tube containing 4 mL of hiPSC maintenance medium and resuspend the cells thoroughly. Reserve a 10 µL aliquot for cell counting.
- Pellet the cells by centrifuging for 5 min at 200 x g at 20-25 °C. Count the cells and calculate the required volume to achieve an appropriate density of hiPSCs (75-400 x 103 per well) in a basement membrane matrix-coated 12-well plate (step 1.1.1).
- Aspirate the coating solution from the wells and add 1 mL of hiPSC medium containing 10 µM ROCK inhibitor into each well (1:1,000 dilution). After centrifuging, aspirate the supernatant and dissociate the pellet in 1 mL of hiPSC medium.
- Add the required volume of hiPSC, determined in step 1.2.4, to each well of the 12-well plate. Two to four 12-well plates may be sufficient for differentiating a hiPSC clone. Refer to step 1.2.4 to determine the number of plates required for seeding cells.
- Place the plate in an incubator (37 °C, 5% CO2). Evenly distribute the cells by gently sliding the plate back and forth and then side to side in the incubator.
- On the following day (i.e., Day -2), exchange the medium with 2 mL of hiPSC maintenance medium lacking ROCK inhibitor. On the next day (Day -1), exchange the medium with 2 mL of fresh hiPSC maintenance medium.
- Induction of EPCs with the glycogen synthase kinase 3 (GSK-3) inhibitor CHIR99021 (Day 0 to Day 5)
- On Day 0, replace the hiPSC maintenance medium in each well with 2 mL of LaSR medium containing 8 µM CHIR99021.
- On Day 1, aspirate the medium and add 2 mL of fresh LaSR medium containing 8 µM CHIR99021.
- On Days 2, 3, and 4, replace the medium with 2 mL of fresh LaSR medium lacking CHIR99021.
- Magnetic activated cell sorting (MACS) to purify CD31+ EPCs (Day 5)
- On Day 5, aspirate the medium and then add 1 mL of dissociation reagent to each well, before incubating for 6-8 min at 37 °C.
- Dissociate and singularize the cells with a micropipette and pass through a 40 µm cell strainer to filter the suspension into a 50 mL tube containing 10 mL of DMEM/F12-10 medium. Filter the cell suspension collected from more than two 12-well plates into at least two 50 mL tubes.
- Stop the digestion reaction by adding DMEM/F12-10 medium (up to 50 mL). Pipette thoroughly and reserve 10 µL for counting cells. Pellet the cells by centrifuging for 5 min at 200 x g at 20-25 °C.
- After removing the supernatant, add 10 mL of DMEM/F12-10 medium and transfer the cell suspension into fresh 15 mL tubes. Pellet the cells by centrifuging for 5 min at 200 x g at 20-25 °C.
- Aspirate the supernatant and resuspend into flow buffer-1 at a density of 1.0 x 10⁷ cells per 100 µL of buffer.
- Add FcR blocking reagent at a ratio of 1:100 and incubate for 5 min before adding the fluorescein isothiocyanate (FITC)-labeled CD31 antibody diluted 1:200. Incubate the suspension for 30 min in the dark at 20-25 °C.
- Add 10 mL of flow buffer-1, reserving 10 µL of the suspension for flow cytometry analysis to determine the fraction of CD31+ cells (Figure 2).
- Pellet the cells by centrifuging at 200 x g for 5 min at 20-25 °C. Then, remove the supernatant and resuspend to a density of 1.0 x 10⁷ cells per 100 µL of flow buffer-1 solution. Add the FITC selection cocktail (5 µL per 100 µL of cell suspension). Mix thoroughly by pipetting and incubate in the dark for 15 min at 20-25 °C.
- Add 5 µL of magnetic nanoparticles per 100 µL of cell suspension, pipette well, and incubate in the dark for 10 min at 20-25 °C.
- Transfer the cell suspension to a 5 mL flow cytometry tube and add flow buffer-1 to achieve a total volume of 2.5 mL. Place the flow cytometry tube in the magnet for 5 min.
- In a continuous motion, invert the magnet and decant the cell suspension containing cells that were not labeled with the FITC-CD31 antibody. Maintain the magnet and tube in the inverted position for 2-3 s and then remove the remaining liquid. Aspirate any droplets on the tube edge before returning the tube to an upright position.
- Pick up the flow cytometry tube from the magnet and add 2.5 mL of flow buffer-1 to wash the remaining CD31+ cells. Resuspend the cells by gently pipetting the cells up and down two or three times. Place the flow tube into the magnet for 5 min.
- Repeat steps 1.4.11-1.4.12 three times and then step 1.4.11 once more for a total of four washes.
- Remove the flow tube from the magnet and add the indicated amount of a suitable medium (e.g., human endothelial serum-free medium [hECSR] for extended EC culture or freezing medium for freezing) to the tube to resuspend the purified CD31+ cells. Reserve two 10 µL aliquots of the suspension, one for cell counting and the second to carry out flow cytometry analysis to assess the purity of CD31+ cells in post-MACS samples (Figure 2). If a flow cytometer is not available immediately, store the aliquot at 4 °C until analysis.
- If the next steps (through step 2) cannot be immediately carried out, freeze the CD31+ EPCs at this point. For expansion and selective passaging of EPCs, proceed to step 2.
NOTE: Vitronectin25-coated 12-well plates and the more stable hiPSC maintenance medium (mTeSR plus) can be used in place of basement membrane matrix-coated plates and hiPSC maintenance medium (mTeSR1). To prepare vitronectin-coated 12-well plates, dilute vitronectin with dilution buffer to a final concentration of 10 µg/mL and then transfer 500 µL of the diluted solution to each well of the 12-well plates. Leave the plates at 20-25 °C for at least 1 h. The seeding density of singularized hiPSCs is comparable to that used for basement membrane matrix-coated plates. Changing the culture medium or the matrix composition may impact the proliferation and spontaneous differentiation of hiPSCs, which typically require 1-2 weeks to adapt to new culture conditions. If the more stable hiPSC maintenance medium is used for hiPSC maintenance, this medium can be used for EPC differentiation instead of the hiPSC maintenance medium. In this case, the more stable hiPSC maintenance medium should be changed at Day -2 to remove ROCK inhibitor, and the exchange on Day -1 can be skipped.
2. Extended endothelial cell culture method (EECM) to differentiate brain microvascular endothelial cell-like cells (BMEC-like cells) and smooth muscle-like cells (SMLCs)
- Preparation of collagen-coated plates and reagents
- Prepare collagen-coated 6-well plates by dissolving 5 mg of crystalized collagen type IV in 5 mL of sterile water. Incubate overnight at 4 °C before aliquoting and storing at -20 °C. Dilute collagen IV aliquots 1:100 in sterile water to produce 10 µg/mL solutions and add 1 mL of 10 µg/mL collagen IV solutions to each well of the 6-well plates. Incubate the plates for at least 30 min at 37 °C. The plates can be stored at 37 °C for up to 1 week.
- Prepare a stock solution of human fibroblast growth factor 2 (FGF2) by dissolving 500 µg of FGF in 5 mL of Dulbecco's PBS, add 7.5% BSA to a final concentration of 0.1%, and aliquot the stock solution into 20-200 µL volumes. These can be stored at -20 °C for up to 3 months (Table 1). Stock solutions can be stored at 4 °C for up to 1 month; avoid freeze-thaw cycles. Prepare hECSR medium by adding 2 mL of B-27 supplement and 20 µL of FGF2 into 98 mL of hECSR medium (Table 1). The hECSR medium may be stored at 2-8 °C for up to 2 weeks.
- Prepare freezing medium for the EPCs, EECM-BMEC-like cells, and SMLCs by adding 15 mL of fetal bovine serum, 5 mL of DMSO, and 25 µL of ROCK inhibitor solution to 30 mL of hECSR medium (Table 1). The freezing medium may be stored at 2-8 °C for up to 2 weeks.
- Seeding EPCs for extended endothelial cell culture
- Remove collagen solution from the 6-well plates. Then, transfer 1.0-2.0 x 10⁵ purified CD31+ EPCs in 2 mL of hECSR medium containing 5 µM ROCK inhibitor (1:2,000 dilution). Place the plate in an incubator (37 °C, 5% CO2). Evenly distribute the cells by gently sliding the plates back and forth, then side to side.
- The next day, remove the hECSR medium containing ROCK inhibitor and add 2 mL of fresh hECSR medium without ROCK inhibitor. Exchange the hECSR medium every other day until 100% confluence is reached.
NOTE: If a regular feeding schedule cannot be maintained over a weekend, the medium can be replaced in the evening of the last working day of the week and again early in the morning after the weekend.
- Selective passage to purify EECM-BMEC-like cells and SMLCs
- Remove the hECSR medium from the 6-well plates containing a mixture of ECs and non-EC populations. Add 1 mL of dissociation reagent to each well.
- Monitor the cell morphology carefully under a microscope. When the ECs (but not non-ECs) appear bright and round (typically within 2-5 min), detach them by tapping the edge of the plate. Most non-ECs remain attached to the plate.
- Collect the detached ECs using a micropipette, taking care to avoid resuspending the non-ECs. Transfer the ECs to a 15 mL or 50 mL centrifuge tube containing 4 mL of DMEM/F12-10 per 1 mL of dissociation reagent.
- Add 2 mL of hECSR medium to the wells containing the remaining attached non-ECs to establish SMLCs. Place the plate in the incubator.
- Pipette the EC suspension in the centrifuge tube to mix thoroughly and reserve 10 µL of the suspension for cell counting. Centrifuge the remaining cells for 5 min at 200 x g at 20-25 °C. Remove the supernatant from the pellet and add 2 mL of hECSR medium per 1.0-2.0 x 10⁵ ECs.
- Upon removal of the collagen IV solution from a new 6-well plate, add 2 mL of EC suspension to each well, followed by incubation at 37 °C with 5% CO2. To evenly distribute the cells in the plate, gently move it in a back and forth and side to side motion on the incubator shelf.
- Replace the hECSR medium every other day until the ECs reach 100% confluency.
- Repeat steps 2.3.1-2.3.7 until a pure EC monolayer is obtained. If the following steps cannot be carried out, freeze the CD31+ ECs (see step 2.4.2). To analyze EC functions, proceed to step 3.
NOTE: In general, two or three selective passages are needed to obtain nearly pure cultures of ECs that are suitable for functional analyses, and we consider these cells as EECM-BMEC-like cells. After more than five or six passages, cell proliferation typically slows, although this variable depends on the hiPSC line. - To culture SMLCs, replace the hECSR medium every other day. To collect SMLC-conditioned medium (CM), pass the collected medium through a 0.22 µm filter upon each medium change. The CM can be used to upregulate the VCAM-1 expression of EECM-BMEC-like cells. Pool the SMLC-CM until the SMLCs reach 100% confluency.
- EPC, EECM-BMEC-like cell, and SMLC cryopreservation and thawing
- To freeze EPCs, following the final MACS wash (step 1.4.13), resuspend the EPCs in freezing medium rather than hECSR medium at a density of 1.0-2.0 x 10⁶ cells/mL. Distribute 1 mL of the cell suspension into cryotubes. Place the cryotubes into a controlled rate freezing device and quickly transfer them to -80 °C. For long-term storage, move the tubes to a liquid nitrogen tank 24 to 48 h after freezing.
- To freeze EECM-BMEC-like cells and SMLCs, after removing the medium from wells, add dissociation reagent (1 mL/well) and incubate the plate at 37 °C with 5% CO2 until the cells detach (5-7 min and 20-30 min for EECM-BMEC-like cells and SMLCs, respectively). Collect the cells in a 15 mL or 50 mL centrifuge tube containing 4 mL of DMEM/F12-10 per 1 mL of dissociation reagent.
- Pipette thoroughly to mix and reserve 10 µL of the cell suspension for cell counting. Pellet the cells by centrifuging at 200 x g for 5 min at 20-25 °C. Remove the supernatant and thoroughly resuspend the cells in freezing medium to a density of 1.0-2.0 x 10⁶ cells/mL. Distribute 1 mL of the cell suspension into fresh cryotubes.
- Place the cryotubes in a controlled rate freezing device and immediately transfer them to -80 °C. For long-term storage, the tubes can be transferred to a liquid nitrogen tank 24 to 48 h after freezing.
- For thawing EPCs, EECM-BMEC-like cells, and SMLCs, roll vials of cryotubes between the hands or incubate in a 37 °C water bath until the cells are nearly completely thawed. Add 500 µL of DMEM/F12-10 and gently transfer the cell suspension to a 15 mL tube containing 4 mL of DMEM/F12-10 medium. Wash the cryotube once by adding 1 mL of DMEM/F12-10 and then centrifuge the cells at 200 x g for 5 min at 20-25 °C.
- Aspirate the supernatant and resuspend the pellet in 2 mL of hECSR medium containing 5 µM ROCK inhibitor (1:2,000 dilution) to a density of 1.0-2.0 x 10⁵ cells per 2 mL for EPCs, and 2.0-3.0 x 10⁵ cells per 2 mL for EECM-BMEC-like cells and SMLCs. Distribute the cell suspension among the wells of the collagen-coated 6-well plates after aspirating the collagen solution.
- Gently move the plates back and forth, then side to side, on the shelf of an incubator at 37 °C, 5 % CO2 to evenly distribute the cells in the wells.
- The next day, exchange the medium with fresh hECSR medium lacking ROCK inhibitor. Exchange the hECSR medium every other day until 100% confluency is achieved. Then, proceed to selective passaging for EPCs (see step 2.3) and functional analyses for EECM-BMEC-like cells (see step 3). Before performing molecular characterization and functional assays, EECM-BMEC-like cells should be 100% confluent, which is typically achieved 2-3 days after thawing.
3. Validation of EECM-BMEC-like cells and SMLCs
- Permeability assay for small molecule tracers
- Assess the EECM-BMEC-like cell barrier integrity by measuring sodium fluorescein permeability, as described by Nishihara et al.26. Seed the EECM-BMEC-like cells on filter inserts to develop complete monolayers and measure the permeability of sodium fluorescein.
- Immunofluorescence staining to assess key molecules.
- For immunofluorescence staining to monitor the expression of junctional molecules, adhesion molecules, or cytoskeletal proteins of EECM-BMEC-like cells in monolayers or of SMLCs, use chamber slides, 96-well plates, or membranes with insert filters. Assess the EECM-BMEC-like cell expression of cell surface adhesion molecules with or without inflammatory cytokine stimulation, as described by Nishihara et al.26.
- Flow cytometry to analyze the expression of cell surface adhesion molecules on EECM-BMEC-like cells
- Use flow cytometry to assess the semi-quantitative expression of cell surface adhesion molecules involved in immune cell migration into the CNS, including ICAM-1, ICAM-2, VCAM-1, P-selectin, E-selectin, CD99, and platelet endothelial cell adhesion molecule-1 (PECAM-1), as described by Nishihara et al.26. Culture the EECM-BMEC-like cells with SMLC-conditioned medium in the presence and absence of inflammatory cytokines for 16-18 h.
- Immune cell adhesion assay under static conditions to assess the expression of functional adhesion molecules
- Use the method described by Nishihara et al.26 to determine whether the cell surface adhesion molecules of the EECM-BMEC-like cells are functional.
- Briefly, seed the EECM-BMEC-like cells onto a chamber slide at 5.5 x 10⁴/cm2 and grow to confluence. Approximately 24 h later, change the culture medium to SMLC-conditioned medium in the presence or absence of pro-inflammatory cytokines, and incubate the EECM-BMEC-like cells for an additional 16 h.
- On the day of the experiment, thaw cryopreserved immune cells (e.g., T cells or peripheral blood mononuclear cells [PBMCs]) with T-cell wash buffer (Table 1) and label with fluorescent dyes (e.g., cell tracker dyes) in T-cell medium (Table 1). Optimization of the culture medium for the immune cells should be tailored to the specific type of immune cells being studied.
- In a 16-well chamber slide, add 2 x 10⁴ Th1 cells to the EECM-BMEC-like cells. Specifically, when working with effector T cells such as Th1 cells, it has been observed that they exhibit greater attachment to EECM-BMEC-like cells as compared to PBMCs (Nishihara. et al. [2022]). Consequently, the number of PBMCs to be added to the EECM-BMEC-like cells needs to be higher compared to pure effector T cells.
- Incubate the immune cells with the monolayer of EECM-BMEC-like cells for 30 min in migration assay medium (Table 1). After 30 min, wash the slide gently, twice by immersing in a jar containing Dulbecco's PBS and subsequently fix with 2.5% glutaraldehyde solution at 4 °C for 2 h.
- After fixation, wash the slide twice by immersing in a jar containing Dulbecco's PBS and mount with a coverslip. Subsequently acquire fluorescence microscopy images of the center of the monolayer on the slides for counting immune cells attached to EECM-BMEC-like cell monolayers.
Results
Permeability assay
The permeability of sodium fluorescein was calculated by measuring the fluorescence intensity of the medium collected from the lower chamber at 15, 30, 45, and 60 min. A total of 150 µL of medium is sampled at each time point and the missing volume of 150 µL is replaced with hECSR medium. the fluorescence intensity is read using a fluorescent plate reader (485 nm excitation/530 nm emission) and the correct signals, clearance volumes, and permeabilities are calculated using a previously described formula18 (Table 2). It is recommended to confirm whether the fluorescence intensity of sodium fluorescein increases over time. Multiple filters-at least triplicates-should be used for one assay to ensure reproducibility. For healthy control-derived EECM-BMEC-like cells, the sodium fluorescein (376 Da) permeability should be below 0.3 x 10⁻³ cm/min. To confirm the formation of a confluent EECM-BMEC-like cell monolayer, immunofluorescence staining for junctional proteins of the EECM-BMEC-like cells of each filter used in the permeability assays should be performed following this assay.
Immunofluorescence staining
Immunofluorescence staining of EECM-BMEC-like cell junctional molecules, including claudin-5, occludin, and VE-cadherin1, was used to assess cell morphology and the presence of continuous and mature junctions (Figure 4). The monolayers of EECM-BMEC-like cells on the membranes of the filter inserts were fixed with cold methanol (-20 °C) for 20 s, blocked with blocking buffer (Table 1), and then incubated with primary and secondary antibodies. The EECM-BMEC-like cells exhibited spindle like shapes and zigzag shaped junctions, both of which are characteristic morphological features of BMECs27. Stimulation of the EECM-BMEC-like cells seeded on chamber slides with pro-inflammatory cytokines, such as tumor necrosis factor-α (TNF-α) and interferon-γ (INF-γ) (0.1 ng/mL TNF-α + 2 IU/mL IFN- γ) diluted in SMLC-derived conditioned medium, upregulated the expression of adhesion molecules, such as ICAM-1 and VCAM-128 (Figure 5). Representative images of smooth muscle cell markers, including α-smooth muscle actin (SMA), calponin, and smooth muscle protein 22-Alpha (SM22a)29, are shown in Figure 6. SMLCs seeded on the chamber slide were fixed with 4% paraformaldehyde for 10 min, blocked with blocking buffer, and then incubated with primary and secondary antibodies.
Flow cytometry analysis of cell surface adhesion molecule expression by EECM-BMEC-like cells
Representative results for cell surface expression of endothelial adhesion molecules on EECM-BMEC like cells are displayed in Figure 7. Stimulation with pro-inflammatory cytokines, like TNF-α and INF-γ, upregulated the cell surface expression of several adhesion molecules, including ICAM-1, VCAM-1, and P-selectin. Cultivating EECM-BMEC-like cells with SMLC-conditioned medium enhanced endothelial VCAM-1 cell surface expression. The effect of the induction of VCAM-1 cell surface expression may vary between batches of SMLC-conditioned medium. It is recommended that several batches of conditioned medium harvested from SMLCs, derived from the same hiPSC source, be stored when differentiating SMLCs, in order to verify which batch induces the appropriate expression of VCAM-1.
Immune cell adhesion assay under static conditions
The number of attached immune cells correlated to the expression level of functional adhesion molecules on the surface of EECM-BMEC-like cells. Stimulation with inflammatory cytokines upregulated the expression of endothelial adhesion molecules and promoted the increased number of immune cells that adhered to EECM-BMEC-like cell monolayers (Figure 8). The current experiment demonstrated the functionality of adhesion molecules on EECM-BMEC-like cells, making this model suitable for studying immune cell-EC interactions.
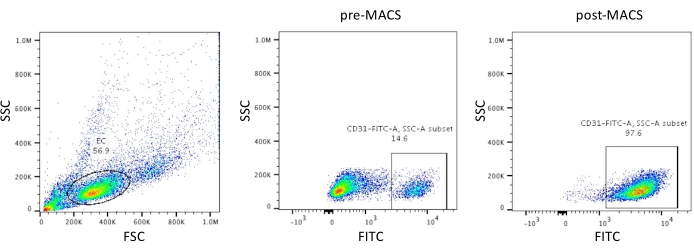
Figure 2: Purification of CD31+ ECs. Dot plots of representative flow cytometry data from scatter gating of ECs and FITC-labeled CD31 staining of cell populations before (step 1.4.7) and after (step 1.4.14) MACS. MACS improves the purity of CD31+ EPCs in the population. Abbreviations: SSC = side scatter; FSC = forward scatter; FITC = fluorescein isothiocyanate; MACS = magnetic activated cell sorting. Please click here to view a larger version of this figure.
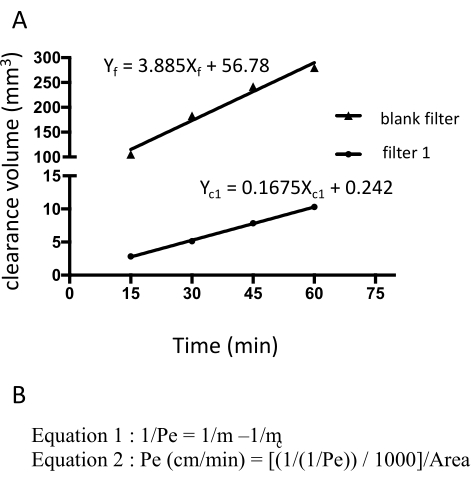
Figure 3: EECM-BMEC-monolayer permeability (10-3 cm/min) calculated from the raw fluorescence intensity of sodium fluorescein. The linear slope of clearance volume is calculated using linear regression for each filter (Figure 3A). The permeability of sodium fluorescein is calculated using two formulas (Figure 3B). (A) The linear slope of clearance volume versus time was calculated using linear regression for filter 1 (mc1) and the blank filter (mf). The mc1 and mf are coefficients of Xc1 and Xf, respectively. (B) Formula for calculating fluorescein permeability (Pe) using mc and mf (Formula 1). Pe units were converted using the surface area of a filter (Formula 2). Please click here to view a larger version of this figure.
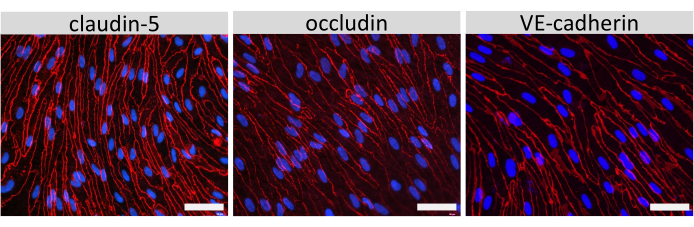
Figure 4: EECM-BMEC-like cells display mature cellular junctions. Immunofluorescence staining for claudin-5, occludin, or VE-cadherin (red) in EECM-BMEC-like cells grown on membranes of insert filters. Nuclei were stained using 4′,6-diamidino-2-phenylindole (DAPI) (blue). Staining was performed on the exact same filter inserts used for the permeability assays. Scale bar = 50 µm. Please click here to view a larger version of this figure.
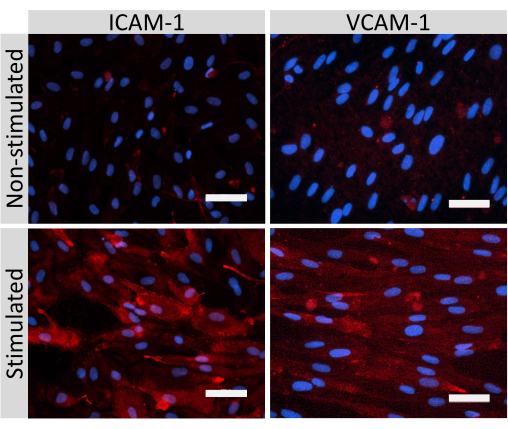
Figure 5: Expression of endothelial adhesion molecules by EECM-BMEC-like cells. Immunofluorescence staining was performed on EECM-BMEC-like cells grown on membranes of filter inserts in the presence of SMLC-derived CM. Immunostaining for ICAM-1 or VCAM-1 (red) is shown for non-stimulated and 1 ng/mL TNF-α + 20 IU/mL IFN- γ stimulated EECM-BMEC-like cells. Nuclei were stained with DAPI (blue). Scale bar = 50 µm. Please click here to view a larger version of this figure.
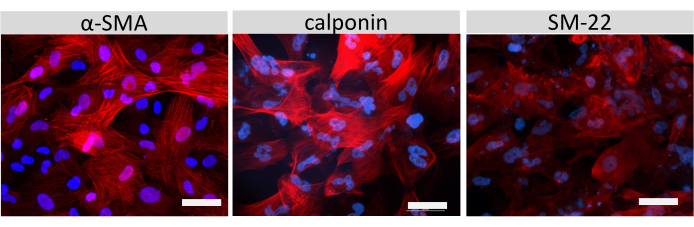
Figure 6: Characterization of SMLCs. Immunocytochemistry of α-smooth muscle actin (SMA), calponin, or smooth muscle protein 22-Alpha (SM22a) (red) for SMLCs grown on chamber slides is shown. Nuclei were stained with DAPI (blue). Scale bar = 50 µm. Please click here to view a larger version of this figure.
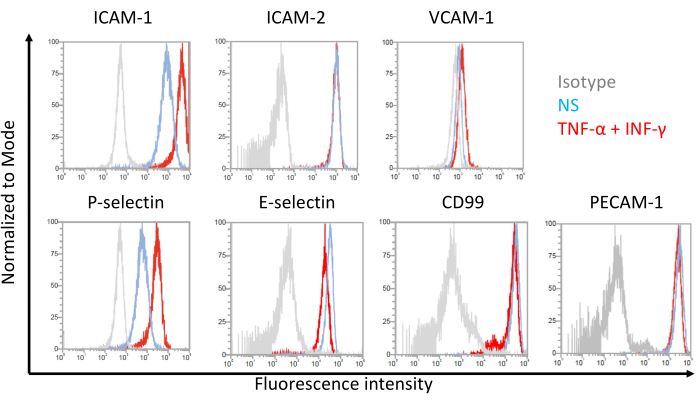
Figure 7: Endothelial cell surface expression of adhesion molecules on EECM-BMEC-like cells. Results of flow cytometry analysis of EC surface adhesion molecule expression on EECM-BMEC-like cells is shown. EECM-BMEC-like cells were cultured using SMLC-derived conditioned medium. Blue, red, and gray lines of the histogram overlays show the non-stimulated (NS) condition, 1 ng/mL TNF-α + 20 IU/mL IFN-γ-stimulated condition, and isotype control, respectively. The cell surface expression of endothelial adhesion molecules, including intercellular adhesion molecule 1 (ICAM-1), ICAM-2, vascular cell adhesion molecule 1 (VCAM-1), P-selectin, E-selectin, CD99, and platelet endothelial cell adhesion molecule-1 (PECAM-1) were assessed. Please click here to view a larger version of this figure.
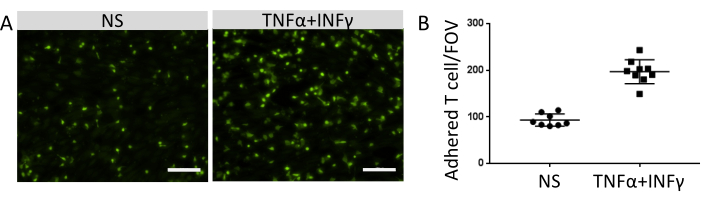
Figure 8: Adhesion of immune cells on EECM-BMEC-like cells. (A) Images of fluorescently labeled adherent immune cells on non-stimulated (NS) and 0.1 ng/mL TNF-α + 2 IU/mL IFN-γ-stimulated (TNF-α + IFN-γ) EECM-BMEC-like cell monolayers. The images correspond to the centers of the wells. Scale bar = 50 µm. (B) The number of fluorescently labeled immune cells on monolayers of NS and TNF-α + IFN-γ-stimulated EECM-BMEC-like cells. Adherent immune cells/fields of view (FOVs) were automatically counted using FIJI software. Dots represent the number of attached T cells. Bars show the mean value, and error bars show the standard deviation (SD) of eight trials. Please click here to view a larger version of this figure.
Table 1: Details of specific reagents for the assays. The name and exact amount of ingredients for each specific reagent are described. Please click here to download this Table.
Table 2: Example of raw data of the fluorescence plate reader for Pe calculation. Numbers in boldface type are the raw fluorescence intensity of sodium fluorescein measured by a plate reader. In order to accurately analyze the data, it is necessary to remove the background signal from the raw values and account for any signal loss resulting from sampling the bottom chamber, and subsequently correct the signal. For example, after subtracting the background, the 15 min sample exhibits a signal of 100 relative fluorescence units (RFU), and the 30 min sample exhibits a signal of 150 RFU. The corrected signal at 30 min is (150 RFU + the missing values at 15 min [100 RFU x 150 µL/1,500 µL]), which is 150 RFU + 10 RFU = 160 RFU. The clearance volume = (1,500 x [SB,t])/(ST,60 min), where 1,500 is the volume of the bottom chamber (1,500 µL), SB,t is the corrected signal at time t, and ST,60 min is the signal of the top chamber at 60 min. Please click here to download this Table.
Discussion
Critical points and troubleshooting
Before starting EPC differentiation, researchers should ensure that no spontaneous cell differentiation events have occurred in the hiPSC cultures. The absence of spontaneously differentiated cells and the use of pure hiPSC colonies is critical for obtaining reproducible results. The hiPSC seeding density on Day -3 is important for obtaining a high purity of CD31+ EPCs after MACS. The seeding density for each hiPSC line and each passage may require optimization. Depending on the hiPSC line and passage number, the seeding density can range between 75 x 103 to 400 x 103 hiPSCs per well of a 12-well plate (20-100 x 103/cm2). The minimum density checkpoint of hiPSCs is the cell density on Day 2. The hiPSCs should reach 100% confluency by Day 2 at the latest. If the hiPSCs are not confluent by Day 2, the purity of CD31+ EPCs after MACS will usually be quite low. In this case, the hiPSC seeding density can be increased. If large numbers of differentiating cells detach from the plate around Day 3 to Day 5, the initial hiPSC seeding density can be decreased. The 7-8 µM CHIR99021 in our experience is the optimal concentration for the hiPSCs lines used here, but the concentration may need to be optimized for other hiPSC lines that may respond differently to the inhibitor treatment. The purity of CD31+ EPCs should be confirmed before and after MACS. Before continuing MACS, the pre-sorted cell mixture should be >10% CD31+ cells. CD31+ cell percentages of <6% typically result in <80% EPCs after MACS. Optimization of the initial seeding density and/or the CHIR99021 concentration is needed in this situation.
For successful selective passaging and generation of pure EC monolayers, the post-MACS purity of CD31+ EPCs is critical. If the purity after MACS is <90%, one or two additional washes are recommended (steps 1.4.11-1.4.12). Ideally, the post-MACS purity should be >95%. The EPC seeding density on collagen-coated plates should be optimized according to the hiPSC line to achieve 100% confluency within 3-7 days. Waiting until the ECs are 100% confluent will usually lead to successful selective passage. However, even for 100% confluent ECs, some hiPSC lines' SMLCs also detach early. In this case, selective passaging at lower confluency (e.g., ≤80%) may be effective. If some SMLCs detach earlier than ECs, the ECs often cannot be rescued from the mixed EC-SMLC population. In this case, shortening the activation time for the dissociation reagent in passaging ECs and repetitive selective passaging may be helpful. The use of a commercial dissociation reagent rather than trypsin as a dissociation reagent is beneficial for selective passaging, as trypsin does not allow the separate detachment of ECs and SMLCs. Our permeability assays using small molecule tracers and testing of tight junction and adhesion molecule expression levels indicate that EPCs, EECM-BMEC-like cells, and SMLCs can be stored in liquid nitrogen for at least 2 years.
Significance and limitations of the method
The method differentiates CD31+ EPCs from hiPSCs through the use of chemical GSK-3 inhibitors to activate Wnt/β-catenin signaling. After positive selection of CD31+ EPCs by MACS, EPCs are cultured in a defined endothelial medium that promotes differentiation into mixed endothelial and SMLC populations. Selective passaging of these mixed populations with different adhesive properties allows the separation of ECs from SMLCs. After one or two passages, EECM-BMEC-like cells exhibit barrier properties and the expression of endothelial adhesion molecules that recapitulate those of primary human BMECs. Co-culture with SMLCs or their supernatants induces the cytokine-induced expression of VCAM-1.
In vivo, the BBB maintains CNS homeostasis by establishing low paracellular and transcellular permeability of molecules, through the transport of nutrients via specific transporters and the control of immune cell trafficking into the CNS. For studies of the BBB, a suitable model that displays the respective molecules and functions of interest is essential. Production of EECM-BMEC-like cells using defined reagents and samples from patients or healthy subjects provides a scalable human BBB model. The advantages of a model using EECM-BMEC-like cells over other BBB models are: 1) a morphology and endothelial transcriptome profile30 that resembles that of primary human BMECs; 2) the presence of mature tight junctions; 3) desirable barrier properties; and 4) the robust expression of endothelial adhesion molecules, including ICAM-1, ICAM-2, VCAM-1, E- and P-selectin, CD99, melanoma cell adhesion molecule (MCAM), and activated leukocyte cell adhesion molecule (ALCAM)22. Thus, this model is particularly useful for studying interactions between immune cells and BMECs. Although the permeability of small molecule tracers is higher for EECM-BMEC-like cells than that previously reported for iPSC-derived BMEC-like cells14,15, the barrier properties do compare quite well to those described for primary human BMECs. This similarity indicates that EECM-BMEC-like cells are likely to be a good in vitro model of the BBB. E-selectin expression on EECM-BMEC-like cells under physiological conditions must be taken into account when using this model to study non-inflamed BBBs that lack constitutive E-selectin expression in vivo31. In our previous study, we demonstrated that EECM-BMEC-like cells could phenocopy the BBB, as observed in the brains of MS patients with respect to disrupted tight junctions. This results in a higher permeability of small molecules and increased expression of functional adhesion molecule, mediating the increased adhesion and transmigration of immune cells across the BMEC-like cells32. Furthermore, we showed that the activation of Wnt/β-catenin signaling can ameliorate the disruption of tight junctions and increased VCAM-1 expression in MS-derived EECM-BMEC-like cells32. These results indicate that the model is indeed useful to study the role of the BBB in neuroimmunological diseases, such as MS.
Taken together, EECM-BMEC-like cells are a promising tool for in-depth understanding of pathophysiological mechanisms at the level of the BBB and as a tool to develop new therapeutic targets for BBB stabilization. In the future, the model can be applied to study BBB dysfunction in a wider spectrum of diseases and could open avenues for novel therapeutic approaches.
Disclosures
BE received a grant from Biogen to study extended dosing of Natalizumab on T-cell migration across the blood-brain barrier and a grant from CSL Behring to investigate the molecular underpinnings of blood-brain barrier dysfunction in neurological disorders. HN and BE are inventors of the provisional US patent applications related to the EECM-BMEC-like cells (63/084980 and 63/185815).
Acknowledgements
HN was supported by the Uehara Memorial Foundation, an ECTRIMS Postdoctoral Research Exchange Fellowship, JSPS under the Joint Research Program implemented in association with SNSF (JRPs) Grant No. JPJSJRP20221507 and KAKENHI Grant No. 22K15711, JST FOREST Program (Grant Number JPMJFR2269, Japan), YOKOYAMA Foundation for Clinical Pharmacology Grant No. YRY-2217, the ICHIRO KANEHARA FOUNDATION, the Narishige Neuroscience Research Foundation, the NOVARTIS Foundation (Japan) for the Promotion of Science, and the YAMAGUCHI UNIVERSITY FUND. BE was supported by the Swiss MS Society and the Swiss National Science Foundation (grants 310030_189080 and ZLJZ3_214086) and Strategic Japanese-Swiss Science and Technology Programme (SJSSTP) grant IZLJZ3_214086.
Materials
| Name | Company | Catalog Number | Comments |
|---|---|---|---|
| 0.22 mm Syringe filter | TPP | 99722 | |
| 15 mL Centrifuge tube | Falcon | 352196 | |
| 40 μm Falcon cell strainer | Falcon | 352340 | |
| 5 mL Round-bottom tube | SPL | 40005 | |
| 50 mL Centrifuge tube | Falcon | 352070 | |
| 96-Well plate, round bottom | SPL | 34096 | |
| Accutase | Sigma-Aldrich | A6964-500ml | |
| Acetic acid | Sigma-Aldrich | 695092 | |
| Advanced DMEM/F12 | Life Technologies | 12634 | |
| All-in-One Fluorescence Microscope | Keyence | BZ-X810 | |
| B-27 Supplement (503), serum free | Thermo Fischer Scientific | 17504044 | |
| Bovine serum albumin (BSA), 7.5% in dPBS | Sigma-Aldrich | A8412 | |
| CellAdhere Dilution Buffer | STEMCELL Technologies | ST-07183 | |
| CellTracker Green CMFDA Dye | Invitrogen | C7025 | |
| Chamber slides | Thermo Fischer Scientific | 178599 | |
| CHIR99021 | Selleck Chemicals | S1263 | |
| Collagen IV from human placenta | Sigma-Aldrich | C5533 | |
| Corning tissue culture plates (12-well) | Corning | 3512 | |
| Corning tissue culture plates (6-well) | Corning | 3506 | |
| Cryo tube innercap 2.0 mL | Watson | 1396-201S | |
| Dimethylsulfoxide (DMSO), sterile | Sigma-Aldrich | D2650 | |
| DMEM (13), [+] 4.5 g/L D-glucose, [-] L-glutamine, [-] pyruvate | Thermo Fischer Scientific | 31053-028 | |
| Dulbecco’s (d) PBS (without calcium, magnesium) | Thermo Fisher | 14190250 | |
| Dulbecco’s modified Eagle’s medium/nutrient mixture F-12 (DMEM-F12) | Thermo Fischer Scientific | 11320074 | |
| EasySepFITC Positive Selection Kit II | STEMCELL Technologies | 18558 | |
| EasySepMagnet | Stemcell Technologies | 18000 | |
| Ethylenediaminetetraacetic Acid Solution0.02% in DPBS | Sigma | E8008-100ML | |
| Fetal Bovine Serum, qualified | Thermo Fischer Scientific | 10270106 | |
| Fibronectin from bovine plasma | Sigma-Aldrich | F1141 | |
| Ficoll-Paque PLUS | Sigma-Aldrich | GE17144002 | |
| FIJI software (Version 2.0.0) | Image J, USA | ||
| FlowJo version10 | BD | ||
| Fluorescein sodium salt | Sigma-Aldrich | F6377 | |
| GlutaMAX Supplement | Thermo Fischer Scientific | 35050-061 | |
| Glutaraldehyde solution | Sigma-Aldrich | G6257 | |
| HCL | Sigma-Aldrich | H1758 | |
| HEPES buffer solution | Thermo Fischer Scientific | 15630-056 | |
| Human Endothelial Serum Free Medium (hESFM) | Thermo Fischer Scientific | 11111-044 | |
| Human fibroblast growth factor 2 (FGF2) | Tocris | 233-FB-500 | |
| iPS human induced pluripotent stem cells | Riken RBC | HPS1006 | |
| Kanamycin Sulfate (100x) | Thermo Fischer Scientific | 15160-047 | |
| L-Ascorbic acid 2-phosphate sesquimagnesium salt hydrate | Sigma-Aldrich | A8960-5G | |
| L-Glutamine 200 mM (1003) | Thermo Fischer Scientific | 25030-024 | |
| Matrigel, growth factor reduced | Corning | 354230 | |
| MEM NEAA (1003) | Thermo Fischer Scientific | 11140-035 | |
| Methanol | Sigma-Aldrich | 32213 | |
| Mowiol | Sigma-Aldrich | 81381 | |
| mTeSR Plus-cGMP | STEMCELL Technologies | ST-100-0276 | |
| mTeSR1 complete kit (basal medium plus 53 supplement) | STEMCELL Technologies | 85850 | |
| NaCl | Sigma-Aldrich | 71376 | |
| Paraformaldehyde | Millipore | 104005 | |
| Pen Strep | Thermo Fischer Scientific | 15140-122 | |
| Recombinant Human IFN-gamma Protein | R&D Systems | 285-IF-100 | |
| Recombinant Human IL-2 | BD Biosciences | 554603 | |
| Recombinant Human TNF-alpha Protein | R&D Systems | 210-TA-020 | |
| ROCK inhibitor Y-27632 | Tocris | 1254 | |
| RPMI medium 1640 | Thermo Fischer Scientific | 21875-034 | |
| Scalpel | FEATHER | 2975-11 | |
| Skim milk | BD Biosciences | 232100 | |
| Sodium azide (NaN3) | Sigma-Aldrich | 71290 | |
| Sodium pyruvate | Thermo Fischer Scientific | 11360-039 | |
| Transwells, PC Membrane, 0.4 mm, 12 mm, TC-Treated | Corning | 3401 | |
| Tris base | Sigma-Aldrich | 93362 | |
| Triton X-100 | Sigma-Aldrich | X100 | |
| Vitronectin XF | STEMCELL Technologies | 078180 | |
| Water, sterile, cell culture | Sigma-Aldrich | W3500 |
References
- Castro Dias, M., Mapunda, J. A., Vladymyrov, M., Engelhardt, B. Structure and junctional complexes of endothelial, epithelial and glial brain barriers. International Journal of Molecular Sciences. 20 (21), 5372(2019).
- Engelhardt, B., Sorokin, L. The blood-brain and the blood-cerebrospinal fluid barriers: function and dysfunction. Seminars in Immunopathology. 31 (4), 497-511 (2009).
- Marchetti, L., Engelhardt, B. Immune cell trafficking across the blood-brain barrier in the absence and presence of neuroinflammation. Vascular Biology. 2 (1), H1-H18 (2020).
- Yang, C., Hawkins, K. E., Dore, S., Candelario-Jalil, E. Neuroinflammatory mechanisms of blood-brain barrier damage in ischemic stroke. American Journal of Physiology. Cell Physiology. 316 (2), C135-C153 (2019).
- Nishihara, H., Engelhardt, B. Brain barriers and multiple sclerosis: novel treatment approaches from a brain barriers perspective. Handbook of Experimental Pharmacology. 273, 295-329 (2020).
- Pan, Y., Nicolazzo, J. A. Altered blood-brain barrier and blood-spinal cord barrier dynamics in amyotrophic lateral sclerosis: Impact on medication efficacy and safety. British Journal of Pharmacology. 179 (11), 2577-2588 (2022).
- Sweeney, M. D., Sagare, A. P., Zlokovic, B. V. Blood-brain barrier breakdown in Alzheimer disease and other neurodegenerative disorders. Nature Reviews Neurology. 14 (3), 133-150 (2018).
- Desai, B. S., Monahan, A. J., Carvey, P. M., Hendey, B. Blood-brain barrier pathology in Alzheimer's and Parkinson's disease: implications for drug therapy. Cell Transplantation. 16 (3), 285-299 (2007).
- Song, H. W., et al. Transcriptomic comparison of human and mouse brain microvessels. Scientific Reports. 10 (1), 12358(2020).
- Lecuyer, M. A., et al. Dual role of ALCAM in neuroinflammation and blood-brain barrier homeostasis. Proceedings of the National Academy of Sciences. 114 (4), E524-E533 (2017).
- Weksler, B. B., et al. Blood-brain barrier-specific properties of a human adult brain endothelial cell line. The FASEB Journal. 19 (13), 1872-1874 (2005).
- DeStefano, J. G., Jamieson, J. J., Linville, R. M., Searson, P. C. Benchmarking in vitro tissue-engineered blood-brain barrier models. Fluids and Barriers of the CNS. 15 (1), 32(2018).
- Lyck, R., et al. ALCAM (CD166) is involved in extravasation of monocytes rather than T cells across the blood-brain barrier. Journal of Cerebral Blood Flow and Metabolism. 37 (8), 2894-2909 (2017).
- Lippmann, E. S., et al. Derivation of blood-brain barrier endothelial cells from human pluripotent stem cells. Nature Biotechnology. 30 (8), 783-791 (2012).
- Qian, T., et al. Directed differentiation of human pluripotent stem cells to blood-brain barrier endothelial cells. Science Advances. 3 (11), e1701679(2017).
- Cecchelli, R., et al. A stable and reproducible human blood-brain barrier model derived from hematopoietic stem cells. PLoS One. 9 (6), e99733(2014).
- Hollmann, E. K., et al. Accelerated differentiation of human induced pluripotent stem cells to blood-brain barrier endothelial cells. Fluids and Barriers of the CNS. 14 (1), 9(2017).
- Stebbins, M. J., et al. Differentiation and characterization of human pluripotent stem cell-derived brain microvascular endothelial cells. Methods. 101, 93-102 (2016).
- Praca, C., et al. Derivation of brain capillary-like endothelial cells from human pluripotent stem cell-derived endothelial progenitor cells. Stem Cell Reports. 13 (4), 599-611 (2019).
- Al-Ahmad, A. J. Comparative study of expression and activity of glucose transporters between stem cell-derived brain microvascular endothelial cells and hCMEC/D3 cells. American Journal of Physiology. Cell Physiology. 313 (4), C421-C429 (2017).
- Canfield, S. G., et al. An isogenic neurovascular unit model comprised of human induced pluripotent stem cell-derived brain microvascular endothelial cells, pericytes, astrocytes, and neurons. Fluids and Barriers of the CNS. 16 (1), 25(2019).
- Nishihara, H., et al. Advancing human induced pluripotent stem cell-derived blood-brain barrier models for studying immune cell interactions. The FASEB Journal. 34 (12), 16693-16715 (2020).
- Lu, T. M., et al. Pluripotent stem cell-derived epithelium misidentified as brain microvascular endothelium requires ETS factors to acquire vascular fate. Proceedings of the National Academy of Sciences. 118 (8), e2016950118(2021).
- Lian, X., et al. Efficient differentiation of human pluripotent stem cells to endothelial progenitors via small-molecule activation of WNT signaling. Stem Cell Reports. 3 (5), 804-816 (2014).
- Aisenbrey, E. A., Murphy, W. L. Synthetic alternatives to Matrigel. Nature Reviews Materials. 5 (7), 539-551 (2020).
- Nishihara, H., et al. Differentiation of human pluripotent stem cells to brain microvascular endothelial cell-like cells suitable to study immune cell interactions. STAR Protocols. 2 (2), 100563(2021).
- Calabria, A. R., Weidenfeller, C., Jones, A. R., de Vries, H. E., Shusta, E. V. Puromycin-purified rat brain microvascular endothelial cell cultures exhibit improved barrier properties in response to glucocorticoid induction. Journal of Neurochemistry. 97 (4), 922-933 (2006).
- Engelhardt, B., Capture Ransohoff, R. M. crawl, cross: the T cell code to breach the blood-brain barriers. Trends in Immunology. 33 (12), 579-589 (2012).
- Duband, J. L., Gimona, M., Scatena, M., Sartore, S., Small, J. V. Calponin and SM 22 as differentiation markers of smooth muscle: spatiotemporal distribution during avian embryonic development. Differentiation. 55 (1), 1-11 (1993).
- Gastfriend, B. D., et al. Wnt signaling mediates acquisition of blood-brain barrier properties in naïve endothelium derived from human pluripotent stem cells. eLife. 10, e70992(2021).
- Eppihimer, M. J., Wolitzky, B., Anderson, D. C., Labow, M. A., Granger, D. N. Heterogeneity of expression of E- and P-selectins in vivo. Circulation Research. 79 (3), 560-569 (1996).
- Nishihara, H., et al. Intrinsic blood-brain barrier dysfunction contributes to multiple sclerosis pathogenesis. Brain. 145 (12), 4334-4348 (2022).
Reprints and Permissions
