Adipose-derived mesenchymal stromal cells (AdMSCs) have potent immunomodulatory properties useful for treating diseases associated with inflammation. We demonstrate how to isolate and culture murine AdMSCs and primary mixed glia, stimulate AdMSCs to upregulate anti-inflammatory genes and growth factors, assess migration of AdMSCs, and co-culture AdMSCs with primary mixed prion-infected glia.
Method Article
Adipose-Derived Mesenchymal Stromal Cells Co-Cultured with Primary Mixed Glia to Reduce Prion-Induced Inflammation
In This Article
Summary
Abstract
Mesenchymal stromal cells (MSCs) are potent regulators of inflammation through the production of anti-inflammatory cytokines, chemokines, and growth factors. These cells show an ability to regulate neuroinflammation in the context of neurodegenerative diseases such as prion disease and other protein misfolding disorders. Prion diseases can be sporadic, acquired, or genetic; they can result from the misfolding and aggregation of the prion protein in the brain. These diseases are invariably fatal, with no available treatments.
One of the earliest signs of disease is the activation of astrocytes and microglia and associated inflammation, which occurs prior to detectable prion aggregation and neuronal loss; thus, the anti-inflammatory and regulatory properties of MSCs can be harvested to treat astrogliosis in prion disease. Recently, we showed that adipose-derived MSCs (AdMSCs) co-cultured with BV2 cells or primary mixed glia reduce prion-induced inflammation through paracrine signaling. This paper describes a reliable treatment using stimulated AdMSCs to decrease prion-induced inflammation.
A heterozygous population of AdMSCs can easily be isolated from murine adipose tissue and expanded in culture. Stimulating these cells with inflammatory cytokines enhances their ability to both migrate toward prion-infected brain homogenate and produce anti-inflammatory modulators in response. Together, these techniques can be used to investigate the therapeutic potential of MSCs on prion infection and can be adapted for other protein misfolding and neuroinflammatory diseases.
Introduction
Glial inflammation plays a key role in a variety of neurodegenerative diseases, including Parkinson's, Alzheimer's, and prion disease. Although abnormal protein aggregation is attributed to much of disease pathogenesis and neurodegeneration, glial cells also play a part in exacerbating this 1,2,3. Therefore, targeting glial-induced inflammation is a promising therapeutic approach. In prion disease, the cellular prion protein (PrPC) misfolds to the disease-associated prion protein (PrPSc), which forms oligomers and aggregates and disrupts homeostasis in the brain 4,5,6.
One of the earliest signs of prion disease is an inflammatory response from astrocytes and microglia. Studies suppressing this response, either by removal of microglia or modification of astrocytes, have generally shown no improvement on, or worsened, disease pathogenesis in animal models 7,8,9. Modulating glial inflammation without eliminating it is an intriguing alternative as a therapeutic.
Mesenchymal stromal cells (MSCs) have taken the stage as a treatment for a variety of inflammatory diseases, due to their ability to modulate inflammation in a paracrine manner 10,11. They have shown the ability to migrate to sites of inflammation and respond to signaling molecules in these environments by secreting anti-inflammatory molecules, growth factors, microRNAs, and more 10,12,13. We have previously demonstrated that MSCs derived from adipose tissue (denoted AdMSCs) are able to migrate toward prion-infected brain homogenate and respond to this brain homogenate by upregulating gene expression for anti-inflammatory cytokines and growth factors.
Moreover, AdMSCs can decrease the expression of genes associated with Nuclear Factor-kappa B (NF-κB), the Nod-Like Receptor family pyrin domain containing 3 (NLRP3) inflammasome signaling, and glial activation, in both BV2 microglia and primary mixed glia 14. Here, we provide protocols on how to isolate both AdMSCs and primary mixed glia from mice, stimulate AdMSCs to upregulate modulatory genes, assess AdMSC migration, and co-culture AdMSCs with prion-infected glia. We hope that these procedures can provide a foundation for further investigation of the role of MSCs in regulating glial-induced inflammation in neurodegenerative and other diseases.
Protocol
Mice were bred and maintained at Colorado State's Lab Animal Resources, accredited by the Association for Assessment and Accreditation of Lab Animal Care International, in accordance with protocol #1138, approved by the Institutional Animal Care and Use Committee at Colorado State University.
1. Isolating and infecting primary cortical mixed glia with prions
- To isolate primary mixed glia containing both astrocytes and microglia, obtain C57Bl/6 mouse pups aged zero to two days old.
NOTE: This protocol is adapted from previous protocols 15,16. - Euthanize pups one at a time by decapitation and extract their brain, separating and discarding the cerebellum and brain stem.
- Place the brain in a 3 cm Petri dish containing cold MEM/EBSS with 2x Penicillin/streptomycin/neomycin (PSN). Under a dissecting scope, separate brain hemispheres and remove and discard the midbrain. Remove and discard the hippocampus and meninges from the cortex.
- Place both cortical hemispheres in a 50 mL conical tube containing 5 mL of MEM/EBSS + 2x PSN and place on ice.
- In a tissue culture hood, remove the media from the 50 mL conical tube by gently aspirating with a pipet, leaving the cortical tissue pieces at the bottom of the tube. With a coated glass pipet, add 10 mL of prewarmed dissociation media and triturate the tissue with the glass pipet 10-20x.
- Transfer the suspension to a 50 mL beaker containing a small stir bar and place on a stir plate at the lowest setting, approximately 30 rpm, for 10 min. Remove the beaker from the stir plate and set it at a 30° angle for 3 min to allow the tissue to settle at the bottom. Remove the cell suspension (supernatant) and transfer to a new 50 mL conical tube on ice.
- Add DNase-I (4,000 U/mL) to 10 mL of dissociation media and resuspend the tissue and stir for an additional 10 min. Repeat by adding fresh dissociation media (without DNase-I) 2-4 additional times (one time for every two mouse pups used), and transferring the cell suspension to the 50 mL conical tube on ice, until only fibrous tissue remains in the bottom of the beaker.
- Centrifuge the cell suspension in the conical tube for 10 min at 1,000 × g at 4 °C. Aspirate the supernatant and replace with glial growth medium. Count the cells with a hemocytometer and plate the cells at a density of 106 in 10 cm cell-culture treated dishes. Place in an incubator at 37 °C with 5% CO2.
- After 24 h, remove the media and replace it with fresh glial media. Let the cells reach 100% confluence within 2 weeks; then, split and plate them for experimentation.
- For in vitro prion infection, plate glia at 100,000 cells per well in 6-well plates and allow to reach 80%-100% confluence. Expose brain homogenates, both prion and normal, diluted to 20% in PBS to UV light for 30 min prior to adding to cell culture. Aspirate media off glia to be infected, and to each well, add 1.5-2 mL of glial growth media containing a final volume of 0.1% normal or prion brain homogenate.
- After 72 h, aspirate off the media and wash the cells with PBS to remove any residual brain homogenate. Replace with fresh glial growth media (containing no brain homogenates).
- To isolate AdMSCs cells, use a serological pipet and gently aspirate the adipose tissue along with ~1 mL of HBSS/Trypsin solution. Transfer to a 4 cm Petri dish containing 2 mL of DMEM/F12 media with 200 U/mL DNase-I and 400 U/mL collagenase/Dispase mixture. With small scissors, cut the chunks of adipose tissue into small pieces (less than 5 mm in size) and incubate at 37 °C for 1.5 h.
- Transfer the contents of the Petri dish to a 50 mL conical tube with a serological pipet and triturate the mixture ~10x with the pipet. Make sure the tissue breaks apart easily and forms a relatively homogeneous mixture. Centrifuge the mixture at 4 °C for 5 min at 1,000 × g to pellet the stromal vascular fraction, which will appear red.
- Aspirate the supernatant carefully and wash the pellet with 5 mL of prewarmed sterile PBS and centrifuge at 4 °C at 1,000 × g for 3 min. Aspirate the supernatant and resuspend the pellet in 1 mL of AdMSC media (low glucose DMEM containing L-glutamine and supplemented with 15% heat-inactivated fetal bovine serum (hiFBS), 1% amino acids, 1% non-essential amino acids, and 1% PSN).
- Place a 40 µm cell strainer on top of a fresh sterile 50 mL conical tube and pipet the cell suspension through the strainer to remove any non-dissociated tissue. Add 9 mL of AdMSC media to a 10 cm cell culture-treated dish and pipet the strained cell suspension into the dish. Place in an incubator at 37 °C with 5% CO2.
- Remove and replace with fresh AdMSC media the following day. Wait for the cells to become 80-90% confluent when they will be ready to be passaged between 72 h and 96 h.
- Isolate AdMSCs as described above and passage twice to obtain a consistent homogeneous population 14. Wash cells twice with sterile PBS and pipet 2 mL of prewarmed trypsin (0.25%) onto each plate. Incubate cells at 37 °C for 5 min or until they become fully dislodged from the plate. Add 8 mL of prewarmed AdMSC media to each plate, pipet to mix the cell suspension, transfer to the conical tube, and centrifuge at 1,000 × g at 4 °C to pellet.
- Resuspend AdMSCs in 3-10 mL of media (depending on the number of plates used) and count cells using a hemocytometer. Plate 100,000 cells/well in 6-well plates containing AdMSC media. Place in an incubator at 37 °C with 5% CO2 overnight.
- The following day, stimulate cells with either cytokines or brain homogenate.
- For cytokine-stimulated cells, make AdMSC media containing either 10 ng/mL TNFα or 200 ng/mL IFNγ. Use fresh media for control wells.
- For prion-infected brain homogenate treatments, obtain 20% brain homogenate (in PBS) from terminally infected prion mice (22L or RML strains). Make AdMSC mediawith a final concentration of 0.1% prion-infected or normal brain homogenate for controls.
- Aspirate media off the wells and pipet 1.5 mL of cytokine- or brain homogenate-containing media to corresponding wells. Perform in triplicate. Return plates to the incubator.
- Remove the media, wash cells 2x with prewarmed PBS, isolate RNA by adding 350 mL of lysis buffer containing 1% βME to each well, and use a cell lifter to remove cell lysates. Perform RNA isolation following the mini kit manufacturer's protocol, including a DNase digestion step. For RT-qPCR, reverse-transcribe 25 ng of RNA per sample and amplify cDNA with SYBR Green and primers for each gene at 10 mM. Analyze mRNA expression using the 2-ΔΔCT method and normalize to the expression of reference gene β-actin 17.
NOTE: All RT-PCR was done following MIQE guidelines. - Plate BV2 microglia at 50,000 cells per well, or primary mixed glia at 100,000 cells per well in a 6-well plate. Treat BV2 cells the following day with media containing 0.1% prion-infected or normal brain homogenate. For mixed glia, wait until cells are 80-90% confluent to infect with brain homogenate.
- Incubate cells in media containing brain homogenate for 72 h. Wash cells 2x with PBS to remove remaining brain homogenate and add fresh media and return to incubator.
- Use AdMSCs at passage 3 for co-culture. If stimulating AdMSCs, use media containing 10 ng/mL TNFα and treat for 24 h prior to co-culturing with BV2 or mixed glia. Wash stimulated AdMSCs 3x with PBS to remove any remaining TNFα.
- Trypsinize AdMSCs as described in step 1.15 and resuspend in AdMSC media.
- Spin AdMSC suspension at 1,000 × g at 4 °C for 5 min. During this time, replace media on BV2 cells or mixed glia with 2 mL per well of AdMSC media and place inserts for 6-well plates with a pore size of 0.4 micrometers into half of the wells. Add 2 mL of AdMSC media to each insert and an additional 2 mL of media to wells that do not receive inserts.
- When finished pelleting AdMSCs, resuspend the pellet in AdMSC media. Count AdMSCs with a hemocytometer and add 50,000-100,000 cells to each insert.
- For BV2 cells, incubate co-cultures for 24 h. For mixed glia, incubate for as few as 24 h and as many as 7 days.
- After incubation with AdMSCs for the desired time, remove the inserts and discard, or place them in a new 6-well plate, wash inserts 2x with PBS, add buffer provided by RNA isolation kit to the mixed glia or BV2 cells, and scrape inserts to analyze AdMSC RNA.
- Treat AdMSCs at passage 2 with media containing 10 ng/mL TNFα. The following day, wash cells with prewarmed sterile PBS 3x and incubate in serum-free AdMSC media for 4 h.
- To perform migratory cell assay, add 25,000 AdMSCs per insert and incubate cells for 24 h at 37 °C. During this time, migratory cells will move from the top chamber of the insert and adhere to the underside of the insert. Carefully aspirate the contents of both the well and inserts and wash 2x with PBS, leaving 1 mL of PBS in each well to ensure that the inserts remain damp on each side.
- One at a time, using forceps, remove the inserts and gently but thoroughly wipe the top chamber with a cotton swab to remove any cells that have not migrated. Aspirate the remaining PBS and pipet 500 μL of crystal violet solution to both the well and top chamber of the insert, ensuring that the insert membrane is fully submerged.
- Incubate inserts for 1 h in crystal violet solution at room temperature. To best retain color, perform the next steps quickly, with only one insert at a time.
- Aspirate crystal violet solution from the well and top chamber of the insert and wash 3x with PBS. Wipe the top chamber again with a cotton swab.
- Place the insert in a well in a new 24-well plate containing 1 mL of PBS. Place the plate above an inverted microscope with a camera attached. Using the 10x objective, take images of four random areas toward the center of the insert, focusing only on the bottom side of the insert.
- After performing this with each well, upload images to the image processing software of choice, and adjust the background to enhance the contrast with the purple-stained cells. Count the cells manually with a cell counter.
Results
Stimulating AdMSCs with TNFα or interferon-gamma (IFNγ) for 24 h induces changes in the expression of anti-inflammatory molecules and growth factors. Treating AdMSCs with TNFα or interferon-gamma (IFNγ) increases TNF-stimulated gene 6 (TSG-6) mRNA, whereas TNFα, but not IFNγ, causes an increase in transforming growth factor beta-1 (TGFβ-1) mRNA. Stimulation with TNFα or IFNγ induces an increase in vascular endothelial growth factor (VEGF)mRNA, but no change in the expression of fibroblast growth factor (FGF) mRNA (Figure 1A). These data suggest that AdMSCs likewise respond to factors in prion-infected brain homogenate, likely a milieu of cytokines and damage-associated molecular patterns (DAMPs) 18,19,20. We show that culturing AdMSCs for 24 h in media containing 0.1% normal brain homogenate (NBH) or Rocky Mountain Laboratories (RML) strain mouse-adapted scrapie brain homogenate increases expression of TSG-6 mRNA. Treatment with RML, but not NBH, increased mRNA for TGFβ-1, VEGF, and FGF (Figure 1B).
To assess the role AdMSCs play in decreasing inflammation in both microglia and astrocytes, primary mixed glia were infected with 0.1% NBH or 22L mouse-adapted scrapie. At 7 days post infection, a co-culture system was established by adding AdMSCs to inserts and co-cultures for 7 days (Figure 2A). Analysis of the mixed glia demonstrated a significant increase in mRNA for the inflammatory cytokines CCL2, CCL5, and IL1β, and the astrocyte marker S100β, in cells infected with 22L compared to NBH. No significant changes were seen in mRNA expression for TNFα. After co-culturing for 7 days with AdMSCs, a decrease in CCL2, CCL5, and IL1β mRNA was seen in both NBH-treated and 22L-infected cells, but no significant changes were seen in TNFα mRNA expression. Co-culturing with AdMSCs also decreases the pan-astrocyte marker S100β and the reactive astrocyte marker C3 in both NBH and 22L-treated glia (Figure 2B).
The BV2 microglia cell line was treated with NBH or RML to assess changes specific to microglia after culturing with AdMSCs. Because stimulating AdMSCs with TNFα causes an increase in the production of the anti-inflammatory gene, as described above, AdMSCs were stimulated for 24 h prior to co-culturing with BV2 cells. At 6 days post prion exposure, BV2 cells were co-cultured with AdMSCs (Figure 2C). RNA was isolated after 24 h. Although we do not show any differences in inflammatory markers between NBH and RML-treated BV2 cells, we show that AdMSCs drastically decrease the transcription of pro-inflammatory markers in BV2 cells. A significant decrease was seen in the inflammatory cytokines IL1β, IL-6, and TNFα and the complement protein C1qa for both NBH-treated and RML-treated BV2 cells. Co-culturing with AdMSCs decreased the M1 microglial gene CD-16 and increased mRNA for Arg-1, a marker for M2 microglia, in both NBH-treated and RML-treated BV2 cells (Figure 2D).
Not only does stimulating MSCs increase the production of anti-inflammatory molecules and growth factors, but it also improves their ability to migrate to areas of inflammation 13,21. Here, we demonstrate an in vitro assay to assess AdMSC migration toward the prion-infected brain. AdMSCs can be stimulated with TNFα for 24 h, then serum-starved for 4 h, then added to inserts above wells containing media only, or media with 1% NBH or RML (Figure 3A). After 24 h, some cells migrate toward media only and NBH-containing media, but there is increased migration of cells toward RML-containing media (Figure 3B,C).
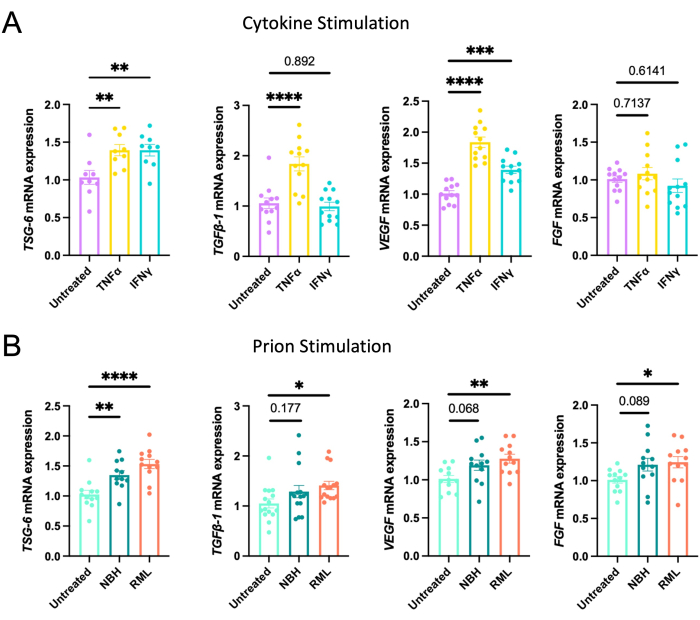
Figure 1: Induction of the expression of anti-inflammatory genes and growth factors after stimulating AdMSCs with cytokines or prion-infected brain homogenate. AdMSCs at passage 3 were stimulated for 24 h with (A) 10 ng/mL TNFα, which induced the expression of mRNA for TSG-6, TGFβ-1, and VEGF, or with 200 ng/mL IFN-α for 24 h induced the expression of TSG-6 and VEGF. (B) Stimulation for 24 h with 0.1% NBH induced expression of TSG-6 mRNA. Stimulation with 0.1% RML prion-infected brain homogenate induced expression of mRNA for TSG-6, TGFβ-1, VEGF, and FGF. One-way ANOVA with post-hoc Tukey's test, *p < 0.05, **p < 0.01, ***p < 0.001, ****p < 0.0001, error bars = SEM. Combined data from four separate experiments, each with three technical replicates. This figure is adapted from Hay et al.22 Abbreviations: AdMSCs = adipose-derived mesenchymal stromal cells; TNFα = tumor necrosis factor alfa; IFN-α = interferon-gamma; TSG-6 = TNF-stimulated gene 6; TGFβ-1 = transforming growth factor beta-1; VEGF = vascular endothelial growth factor; NBH = normal brain homogenate; RML = Rocky Mountain Laboratory prion strain. Please click here to view a larger version of this figure.
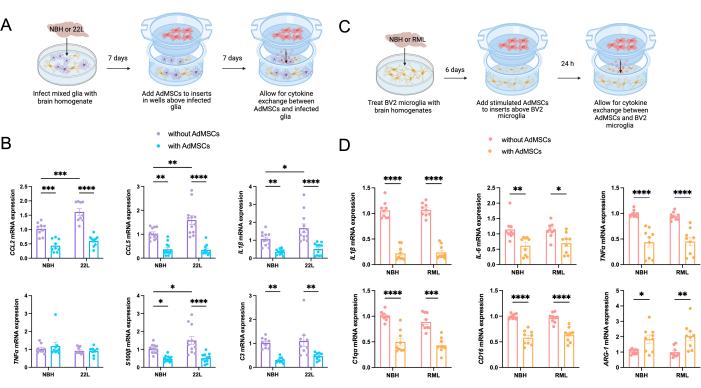
Figure 2: Decrease in markers of inflammation in prion-treated primary mixed glia and BV2 microglia following co-culture with AdMSCs. (A) Primary mixed glia were infected with 0.1% NBH or 22L prion-infected brain homogenate for 72 h, thoroughly washed, then cultured in normal media for 96 additional h. AdMSCs were added to inserts above the corresponding wells. Glia-AdMSC cocultures were incubated for an additional 7 days, for a total of 14 days from the initial infection. (B) Glia infected with 22L showed increased expression of mRNA for the inflammatory markers CCL2, CCL5, and IL1β, in addition to the astrocyte marker S100β compared to those treated with NBH. Co-culturing with AdMSCs decreased expression of the inflammatory cytokines CCL2, CCL5, and IL1β, but not TNFα, for both NBH and 22L-infected cells, as well as decreasing expression of S100β and C3, which together are markers of reactive astrocytes. (C) BV2 microglia were treated with 0.1% NBH or RML prion-infected brain homogenate for 72 h, thoroughly washed, then cultured in normal media for 72 additional h. AdMSCs were stimulated with 10 ng/mL TNFα for 24 h, then added to inserts above corresponding wells. BV2-AdMSC co-cultures were incubated for 24 h, for a total of 7 days from initial brain homogenate treatments. (D) BV2s co-cultured with AdMSCs showed a decrease in mRNA for the inflammatory markers IL1β,IL-6, and TNFα, and the complement protein C1qa. Additionally, AdMSCs decreased the M1 microglia gene CD-16 and increased the M2 microglia marker Arg-1. Two-way ANOVA with post-hoc Tukey's test, *p < 0.05, **p < 0.01, ***p < 0.001, ****p < 0.0001, error bars = SEM. Combined data from three separate experiments, each with three technical replicates. This figure is adapted from Hay et al.14. Abbreviations: AdMSCs = adipose-derived mesenchymal stromal cells; IL = interleukin; TNFα = tumor necrosis factor alfa; NBH = normal brain homogenate; 22L = 22L mouse-adapted scrapie prion strain. Please click here to view a larger version of this figure.
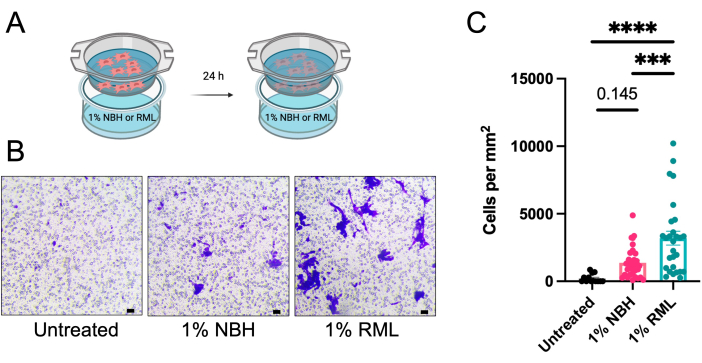
Figure 3: AdMSCs migration towards prion-infected brain homogenate in an in vitro model. AdMSCs were stimulated for 24 h with 10 ng/mL TNFα, then serum-starved for 4 h. (A) They were plated in inserts with a pore size of 8 µm above media alone, or media containing 1% NBH, or 1% RML prion-infected brain homogenate, and incubated for 24 h. (B) AdMSCs were stained with crystal violet solution and cells that had migrated to the bottom side of the insert were imaged and counted manually. (C) Migration of AdMSCs toward NBH-containing media is not significantly more than toward untreated media. However, AdMSCs show significant migration toward media containing 1% RML. Data are a combination of three biological replicates each with three technical replicates, with four fields of vision for each technical replicate. One-way ANOVA with post-hoc Tukey's test, **p < 0.001, ****p < 0.0001, error bars = SEM. Scale bars = 10 µm (B). This figure is adapted from Hay et al.14. Abbreviations: AdMSCs = adipose-derived mesenchymal stromal cells; TNFα = tumor necrosis factor alfa; NBH = normal brain homogenate; RML = Rocky Mountain Laboratory mouse-adapted scrapie prion strain. Please click here to view a larger version of this figure.
Table 1: Murine primer sequences for reverse transcriptase quantitative PCR. Please click here to download this Table.
Discussion
Here we demonstrate a reliable and relatively inexpensive protocol for assessing the effects of adipose-derived mesenchymal stromal cells (AdMSCs) in decreasing prion-induced inflammation in a glial cell model. AdMSCs can easily be isolated and expanded in culture for use in as little as 1 week. This protocol consistently produces a heterologous population of cells that express markers consistent with those of mesenchymal stromal cells by immunofluorescence and flow cytometry, and retain immunological function when introduced to cytokines or prion-infected brain homogenate 14. The data shown here indicate that AdMSCs upregulate anti-inflammatory cytokines and growth factors when exposed to these stimuli. This property can be harnessed to "stimulate" AdMSCs to produce molecules that promote the decrease in inflammation. Stimulating AdMSCs with proinflammatory cytokines may increase their production of specific genes of interest 14,23,24, including anti-inflammatory genes and growth factors such as TSG-6, TGFβ-1, and VEGF. Treatment with brain homogenate from prion-infected animals increases the production of TSG-6, TGFβ-,1 VEGF, and FGF (Figure 1), as detected by qRT-PCR. Different prion strains can have different structures, tissue tropisms, and clinical signs, which poses difficulties when developing therapeutics25. However, they induce a similar inflammatory profile in animal models19. To highlight their universal effectiveness in response to inflammation, we have demonstrated that AdMSCs respond to both 22L and RML, two strains of mouse-adapted scrapie, to upregulate the expression of anti-inflammatory molecules14,22. We also see similar protection although less significant in normal, non-prion infected, brain homogenates (NBH). These brain homogenates contain circulating inflammatory cytokines and tissue, stimulating BV2 cells to phagocytose-a known phenomenon of microglial cells26,27.
Co-culturing with AdMSCs can be done with prion-infected primary mixed glia or BV2 microglia to reduce inflammatory markers (Figure 2). However, there are specific limitations to each type of culture. Once primary mixed glia reach confluency, they can grow for up to 2 months and can maintain prion infection from 7 to 28 days 14. From our experience, BV2 cells can be difficult to culture for more than 7 days before they become 90-100% confluent and can spontaneously activate and die. Lastly, AdMSCs can be stimulated prior to co-culturing which may enhance their anti-inflammatory profile 14,23,24, but they also show anti-inflammatory abilities without stimulation. Here, we demonstrate the abilities of AdMSCs to decrease inflammation in an in vitro model of BV2 microglia and primary mixed glia that have been exposed to prion-infected brain homogenates. Co-culturing with AdMSCs results in a decrease in mRNA for inflammatory cytokines such as CCL2, CCL5, and IL1β, as well as a decrease in the markers of reactive astrocytes, S100β and C3 in primary mixed glia. Co-culturing AdMSCs with BV2 microglia leads to a reduction in mRNA for IL1β and IL-6. TNFα and C1qa, two molecules produced by microglia that contribute to the development of neurotoxic astrocytes, were also decreased when BV2 microglia were co-cultured with AdMSCs. mRNA for the M1 microglia marker CD-16 was decreased, and the M2 microglia marker Arg-1 was increased in co-cultured BV2 cells. Together, these data suggest that AdMSCs polarize microglia to an M2 protective phenotype and astrocytes to a homeostatic non-toxic phenotype. Our recent work using AdMSCs to combat in vivo prion disease in a mouse model further corroborates these in vitro findings22. Further investigation by our research group is forthcoming to characterize the specific factors that are being secreted by AdMSCs responsible for modifying glial inflammation. Previous literature demonstrates that BV2 microglia do not up-regulate inflammatory genes at the same level that primary microglia do in response to inflammogens such as LPS28 and is supported by these data when comparing BV2 microglia (Figure 3) to primary glia (Figure 2). Furthermore, previous research demonstrates that inflammatory response is further exacerbated in mixed glial cultures containing both astrocytes and microglia14, suggesting that prion-induced inflammatory response is increased due to glial-glial communication.
We demonstrate the ability of TNFα-stimulated AdMSCs to migrate toward prion-infected brain homogenate in an in vitro model (Figure 3). AdMSCs can be stimulated prior to migration assays and this may promote their migratory abilities 13,14,21, or MSCs can remain unstimulated and migrate to prion brain homogenate in vitro, as was done in the protocol from which this migration assay was adapted 29. The factors used to stimulate AdMSCs, the length of time allotted for migration, and the stimulus the cells migrate towards are some of many variables that can be assessed using this AdMSC migration assay.
The mechanisms AdMSCs utilize to decrease markers of glial inflammation appear to vary depending on the length of co-culturing and the type of cells the AdMSCs are co-cultured with. Therefore, this protocol lends itself to be adapted to answer a variety of questions in the context of prion disease and can be expanded to investigate the use of AdMSCs in other inflammatory diseases. Here, we demonstrate changes in primary mixed glia derived from C57Bl/6 mice. These changes occur after cells are exposed to 22L prion-infected brain homogenate for 7 days and cultured with AdMSCs for an additional 7 days. This protocol focuses on changes at the mRNA level, but evaluating changes on the protein level with enzyme-linked immunosorbent assay or western blot may be beneficial. Factors to consider manipulating include isolating glia from various strains of mice and changing the length of AdMSC exposure or time of infection, as mixed glia may retain infectious prions for more than 28 days 14. Here, we use BV2 cells, a microglia cell line, but primary microglia and ex vivo microglia may have more biological relevance. Additionally, the source of prions can be modified to use purified prions 30 or brain homogenates from various strains, as these should demonstrate variation in inflammatory properties 19. Moreover, MSC co-cultures have been used to downregulate inflammation in macrophages exposed to toxins such as lipopolysaccharide 31, and this protocol has the potential to be adapted for uses outside of prion and other neuroinflammatory diseases.
Disclosures
The authors declare no conflicts of interest.
Acknowledgements
The authors thank Lab Animal Resources for their animal husbandry. Our funding sources for this manuscript include the Boettcher Fund, the Murphy Turner Fund, CSU College of Veterinary Medicine, and the Biomedical Sciences College Research Council. Figure 2A, Figure 2C, and Figure 3A were created with BioRender.com.
Materials
| Name | Company | Catalog Number | Comments |
|---|---|---|---|
| 0.25% Trypsin | Cytiva | SH30042.01 | |
| 5 mL serological pipets | Celltreat | 229005B | |
| 6-well tissue culture plates | Celltreat | 229106 | |
| 10 cm cell culture dishes | Peak Serum | PS-4002 | |
| 10 ml serological pipets | Celltreat | 229210 | |
| 15 mL conical tubes | Celltreat | 667015B | |
| 50 mL conical tubes | Celltreat | 667050B | |
| BV2 microglia cell line | AcceGen Biotech | ABC-TC212S | |
| Cell lifter | Biologix Research Company | 70-2180 | |
| Crystal violet | Electron Microscopy Sciences | 12785 | |
| Dispase | Thermo Scientific | 17105041 | |
| DMEM/F12 | Caisson Labs | DFL14-500ML | |
| DNase-I | Sigma Aldrich | 11284932001 | |
| Essential amino acids | Thermo Scientific | 11130051 | |
| Ethanol (100%) | EMD Millipore | EX0276-1 | |
| Fetal bovine serum (heat inactivated) | Peak Serum | PS-FB4 | Can be purchased as heat inactivated or inactivated in the laboratory |
| Formaldehyde | EMD Millipore | 1.04003.1000 | |
| Glass 10 mL serological pipet | Corning | 7077-10N | |
| Hank’s Balances Salt Solution | Sigma Aldrich | H8264-500ML | |
| Hemocytometer/Neubauer Chamber | Daigger | HU-3100 | |
| High Glucose DMEM | Cytiva | SH30022.01 | |
| low glucose DMEM containing L-glutamine | Cytiva | SH30021.01 | |
| MEM/EBSS | Cytiva | SH30024.FS | |
| non-essential amino acids | Sigma-Aldrich | M7145-100M | |
| Paraformaldehyde (16%) | MP Biomedicals | 219998320 | |
| Penicillin/streptomycin/neomycin | Sigma-Aldrich | P4083-100ML | |
| Phosphate buffered saline | Cytiva | SH30256.01 | |
| Recombinant Mouse IFN-gamma Protein | R&D Systems | 485-MI | |
| Recombinant Mouse TNF-alpha (aa 80-235) Protein, CF | R&D Systems | 410-MT | |
| RNeasy mini kit | Qiagen | 74104 | |
| Sigmacote | Sigma Aldrich | SL2-100ML | Coat inside of glass pipets by aspirating up and down twice in Sigmacote and allowing to dry thoroughly. Wrap in aluminum foil and autoclave pipets 24 h later. |
| Stemxyme | Worthington Biochemical Corporation | LS004106 | Collagenase/Dispase mixture |
| Sterile, individually wrapped cotton swab | Puritan Medical | 25-8061WC | |
| Thincert Tissue Culture Inserts, 24 well, Pore Size=8 µm | Greiner Bio-One | 662638 | |
| Thincert Tissue Culture Inserts, 6 well, Pore Size=0.4 µm | Greiner Bio-One | 657641 |
References
- Liddelow, S. A., et al. Neurotoxic reactive astrocytes are induced by activated microglia. Nature. 541 (7638), 481-487 (2017).
- Smith, H. L., et al. Astrocyte unfolded protein response induces a specific reactivity state that causes non-cell-autonomous neuronal degeneration. Neuron. 105 (5), 855-866 (2020).
- Hong, S., et al. Complement and microglia mediate early synapse loss in Alzheimer mouse models. Science. 352 (6286), 712-716 (2016).
- Collinge, J., Clarke, A. R. A general model of prion strains and their pathogenicity. Science. 318 (5852), 930-936 (2007).
- Gajdusek, D. C. Transmissible and non-transmissible amyloidoses: autocatalytic post-translational conversion of host precursor proteins to beta-pleated sheet configurations. J Neuroimmunol. 20 (2-3), 95-110 (1988).
- Come, J. H., Fraser, P. E., Lansbury, P. T. A kinetic model for amyloid formation in the prion diseases: importance of seeding. Proceedings of the National Academy of Sciences of the United States of America. 90 (13), 5959-5963 (1993).
- Hartmann, K., et al. Complement 3(+)-astrocytes are highly abundant in prion diseases, but their abolishment led to an accelerated disease course and early dysregulation of microglia. Acta Neuropathologica Communications. 7 (1), 83(2019).
- Carroll, J. A., Race, B., Williams, K., Striebel, J., Chesebro, B. Microglia are critical in host defense against prion disease. Journal of Virology. 92 (15), e00549(2018).
- Bradford, B. M., McGuire, L. I., Hume, D. A., Pridans, C., Mabbott, N. A. Microglia deficiency accelerates prion disease but does not enhance prion accumulation in the brain. Glia. 70 (11), 2169-2187 (2022).
- Li, M., Chen, H., Zhu, M. Mesenchymal stem cells for regenerative medicine in central nervous system. Frontiers in Neuroscience. 16, 1068114(2022).
- Sanchez-Castillo, A. I., et al. Switching roles: beneficial effects of adipose tissue-derived mesenchymal stem cells on microglia and their implication in neurodegenerative diseases. Biomolecules. 12 (2), 219(2022).
- Fu, X., et al. Mesenchymal stem cell migration and tissue repair. Cells. 8 (8), 784(2019).
- Xiao, Q., et al. TNF-alpha increases bone marrow mesenchymal stem cell migration to ischemic tissues. Cell Biochemistry and Biophysics. 62 (3), 409-414 (2012).
- Hay, A. J. D., Murphy, T. J., Popichak, K. A., Zabel, M. D., Moreno, J. A. Adipose-derived mesenchymal stromal cells decrease prion-induced glial inflammation in vitro. Scientific Reports. 12 (1), 22567(2022).
- Kirkley, K. S., Popichak, K. A., Afzali, M. F., Legare, M. E., Tjalkens, R. B. Microglia amplify inflammatory activation of astrocytes in manganese neurotoxicity. Journal of Neuroinflammation. 14 (1), 99(2017).
- Popichak, K. A., Afzali, M. F., Kirkley, K. S., Tjalkens, R. B. Glial-neuronal signaling mechanisms underlying the neuroinflammatory effects of manganese. Journal of Neuroinflammation. 15 (1), 324(2018).
- Livak, K. J., Schmittgen, T. D. Analysis of relative gene expression data using real-time quantitative PCR and the 2(-Delta Delta C(T)) Method. Methods. 25 (4), 402-408 (2001).
- Hass, R., Otte, A. Mesenchymal stem cells as all-round supporters in a normal and neoplastic microenvironment. Cell Communication and Signaling: CCS. 10 (1), 26(2012).
- Carroll, J. A., et al. Prion strain differences in accumulation of PrPSc on neurons and glia are associated with similar expression profiles of neuroinflammatory genes: comparison of three prion strains. PLoS Pathogens. 12 (4), 1005551(2016).
- Carroll, J. A., Race, B., Williams, K., Chesebro, B. Toll-like receptor 2 confers partial neuroprotection during prion disease. PLoS One. 13 (12), e0208559(2018).
- Yu, Y., et al. Hypoxia and low-dose inflammatory stimulus synergistically enhance bone marrow mesenchymal stem cell migration. Cell Proliferation. 50 (1), e12309(2017).
- Hay, A. J. D., et al. Intranasally delivered mesenchymal stromal cells decrease glial inflammation early in prion disease. Frontiers in Neuroscience. 17, 1158408(2023).
- English, K., Barry, F. P., Field-Corbett, C. P., Mahon, B. P. IFN-gamma and TNF-alpha differentially regulate immunomodulation by murine mesenchymal stem cells. Immunology Letters. 110 (2), 91-100 (2007).
- Hemeda, H., et al. Interferon-gamma and tumor necrosis factor-alpha differentially affect cytokine expression and migration properties of mesenchymal stem cells. Stem Cells and Development. 19 (5), 693-706 (2010).
- Carta, M., Aguzzi, A. Molecular foundations of prion strain diversity. Current Opinion in Neurobiology. 72, 22-31 (2022).
- Yu, F., et al. Phagocytic microglia and macrophages in brain injury and repair. CNS Neuroscience and Therapeutics. 28 (9), 1279-1293 (2022).
- Sinha, A., et al. Phagocytic activities of reactive microglia and astrocytes associated with prion diseases are dysregulated in opposite directions. Cells. 10 (7), 1728(2021).
- Stansley, B., Post, J., Hensley, K. A comparative review of cell culture systems for the study of microglial biology in Alzheimer's disease. Journal of Neuroinflammation. 9, 115(2012).
- Shan, Z., et al. Therapeutic effect of autologous compact bone-derived mesenchymal stem cell transplantation on prion disease. Journal of General Virology. 98 (10), 2615-2627 (2017).
- Johnson, T. E., et al. Monitoring immune cells trafficking fluorescent prion rods hours after intraperitoneal infection. Journal of Visualized Experiments. (45), e2349(2010).
- Liu, F., et al. MSC-secreted TGF-beta regulates lipopolysaccharide-stimulated macrophage M2-like polarization via the Akt/FoxO1 pathway. Stem Cell Research and Therapy. 10, 345(2019).
Reprints and Permissions
