A method was developed to visualize dye extravasation due to blood-brain barrier (BBB) breakdown by administering two fluorescent dyes to mice at different time points. The use of glycerol as a cryoprotectant facilitated immunohistochemistry on the same sample.
Method Article
Evaluation of Blood-Brain Barrier Breakdown in a Mouse Model of Mild Traumatic Brain Injury
In This Article
Summary
Abstract
Fluorescent dyes are used to determine the extent of dye extravasation that occurs due to blood-brain barrier (BBB) breakdown. Labeling with these dyes is a complex process influenced by several factors, such as the concentration of dyes in the blood, permeability of brain vessels, duration of dye extravasation, and reduction in dye concentration in the tissue due to degradation and diffusion. In a mild traumatic brain injury model, exposure to blast-induced shock waves (BSWs) triggers BBB breakdown within a limited time window. To determine the precise sequence of BBB breakdown, Evans blue, and fluorescein isothiocyanate-dextran were injected intravascularly and intracardially into mice at various time points relative to BSW exposure. The distribution of dye fluorescence in brain slices was then recorded. Differences in the distribution and intensity between the two dyes revealed the spatiotemporal sequence of BBB breakdown. Immunostaining of the brain slices showed that astrocytic and microglial responses correlated with the sites of BBB breakdown. This protocol has broad potential for application in studies involving different BBB breakdown models.
Introduction
Blood-brain barrier (BBB) breakdown and dysfunction are caused by systemic inflammation, infections, autoimmune diseases, injuries, and neurodegenerative diseases1. In mild traumatic brain injury (mTBI) resulting from exposure to blast-induced shock waves (BSWs), a significant correlation has been observed between the intensity of BSWs and the amount of fluorescent dye leakage due to BBB breakdown2,3,4. One notable feature of BBB breakdown in mTBI is that it begins immediately or within a few hours after exposure to BSWs and is usually a transient process that lasts for about a week before delayed, chronic neurological disorders emerge3,5,6,7. Although the details remain unclear, BBB breakdown is part of the long-lasting pathological cascade and may also serve as a prognostic factor in mTBI6. Therefore, understanding the spatial and temporal distributions of BBB breakdown in the brain is important.
Fluorescent dyes are used to determine the extent of BBB breakdown3,8. Because the blood concentration of the dyes and the magnitude and extent of BBB breakdown change over time, caution is required when interpreting images of dye extravasation. For instance, the absence of dye extravasation does not necessarily indicate the absence of BBB breakdown. No BBB breakdown may be detected before or after an increase in the dye's blood concentration. Even if the dye successfully accumulated where BBB breakdown occurred, it may have been lost over time after the breakdown ceased. In general, water-soluble and biologically inert substances are quickly excreted in the urine9. Therefore, to determine whether BBB breakdown occurs at a specific time, the most reliable results are obtained when a fluorescent dye is administered into the bloodstream for a short period immediately before fixing the animal. Commercially available fluorescein isothiocyanate (FITC)-dextran with a specific molecular weight should be used in this manner.
Evans blue is a widely recognized blue azo dye with a strong affinity for serum albumin. The dye exhibits red fluorescence when excited by green light in biological systems2. Due to its inert nature, the Evans blue-serum albumin complex remains in the blood for up to 2 h, making it a useful 69 kDa tracer for labeling regions with a compromised BBB for at least this duration10,11. Therefore, it is important to consider potential uncertainties surrounding the pharmacokinetics and toxicity of Evans blue9. However, a recent study showed that Evans blue continues to accumulate in areas where the BBB is absent or disrupted7. This feature enabled Evans Blue to record the history of the BBB breakdown, while FITC-dextran was used to record the BBB breakdown at a specific time point after the BSW exposure. Although Evans blue can be administered intravenously or intraperitoneally10, intravenous administration is preferred for time-sensitive experiments. This study aimed to demonstrate the use of Evans blue and FITC-dextran to detect the spatiotemporal distribution of BBB breakdown following exposure to BSW.
Second, the study presented a technique for freezing brain slices after observing the fluorescence of BBB breakdown and preparing thinner slices suitable for immunohistochemical procedures. The use of glycerol as a mounting medium and cryoprotectant simplifies the immunohistochemistry process. By comparing images of BBB breakdown with those from immunohistochemistry, the spatiotemporal distribution of BBB breakdown can be correlated with the tissue response of the same sample.
Protocol
All experiments were conducted in accordance with the ethical guidelines for animal experiments established by the National Defense Medical College (Tokorozawa, Japan). The study protocol was approved by the Committee for Animal Research at the National Defense Medical College (approval no. 23011-1). Male C57BL/6J mice aged 8 weeks and weighing 19-23 g were used in this study. As illustrated in Figure 1, a single Evans blue injection and FITC-dextran perfusion were performed at various time points in relation to a single BSW exposure. Details of the reagents and equipment used are listed in the Table of Materials.
1. Anesthesia
NOTE: This is a modified protocol that increases the amount of medetomidine by 2.5 times compared with the original one12. The dosages for medetomidine hydrochloride, midazolam, and butorphanol were 0.75 mg/kg, 4 mg/kg, and 5 mg/kg, respectively.
- Prepare a mixture of medetomidine hydrochloride (75 µg/mL), midazolam (400 µg/mL), and butorphanol (500 µg/mL) in physiological saline.
- Administer the mixture intraperitoneally to anesthetize the mouse (10 µL/g)13.
- After approximately 5-10 min, verify sufficient anesthesia by observing the lack of tail pinch and pedal withdrawal reflexes.
- Keep the mouse warm until it recovers from the effects of anesthesia.
2. BSW exposure
NOTE: An in-house shock tube was used in this study14.
- Anesthetize the mouse as described in step 1.
- Position the mouse 5 cm away from the exit end of the shock tube, ensuring its body axis is parallel to but not aligned with the tube's axis.
- Deliver a single BSW exposure with a peak overpressure of 25 kPa to the head.
NOTE: Keep the mouse warm until it recovers from the effects of anesthesia. Regularly monitor the condition of the treated mouse. If signs of distress, such as difficulty feeding or drinking, hunching, or prolonged abnormal appearance without signs of recovery, are observed, euthanize the mouse and terminate the experiment early. Avoid administering analgesics, as they may potentially affect the glial response.
3. Evans blue injection into the tail vein
NOTE: Evans blue solution should be administered intravenously without anesthesia. In the presence of anesthesia, the dye often does not penetrate the body sufficiently, likely due to decreased blood pressure and body temperature13. Evans blue was administered at a dose of 100 mg/kg.
- Prepare the Evans blue solution (4% w/v in saline) in a microtube, then vortex and store it in the dark before use.
- Inject the solution into the tail vein (2.5 µL/g)13.
4. Transcardial perfusion with FITC-dextran solution and fixation
- Add heparin to phosphate-buffered saline (PBS) to obtain a concentration of 1 U/mL, then add FITC-dextran to the heparinized PBS to achieve a concentration of 3 mg/mL.
- Completely dissolve the FITC-dextran powder before use. To do this, gently shake the solution for 30 min or more. Before use, carefully check for any undissolved FITC-dextran powder. If any remains, continue shaking until it is completely dissolved.
- Anesthetize the mouse as described in step 1.
- Proceed with the standard perfusion fixation protocol using a peristaltic pump15,16. First, perfuse with heparinized PBS containing FITC-dextran for 2 min at a rate of 4.0 mL/min. Then, perfuse with 10% formalin neutral buffer solution or 4% paraformaldehyde-PBS for 2 min at a rate of 4.0 mL/min, followed by 8 min at a rate of 3.5 mL/min.
- Carefully remove the brain using surgical scissors and tweezers15,16. After dissection, post-fix the brain overnight in the same fixative (i.e., 10% formalin neutral buffer solution or 4% paraformaldehyde-PBS) at 4 °C.
- On the following day, replace the fixative with PBS.
5. Brain tissue processing
NOTE: Even if perfusion fixation is complete, Evans blue and FITC-dextran may disperse into the buffer. Therefore, the procedures leading up to step 6.8 should be completed within a week after perfusion fixation. Additionally, avoid exposing the sample to light.
- Prepare a 24-well plate with 500 µL of 20% glycerol in phosphate buffer (PB; pH 7.4) in each well.
- Using a brain slicer, cut the brain coronally into 12 slices, each 1 mm thick.
- Transfer each slice into the corresponding well of the 24-well plate and store it at 4 °C for at least 2 h.
- Replace the solution with 50% glycerol-PB and store it at 4 °C for at least 2 h.
- Finally, replace the solution with 100% glycerol. For immediate microscopic observation, allow the slices to stand for at least 2 h at room temperature or store them at 4 °C. The slices will now be translucent and ready for microscopic observation.
6. Fluorescence measurement of dye extravasation
NOTE: Fluorescence labeling efficiency varies from mouse to mouse. Therefore, fluorescence intensity needs to be normalized. Fluorescence values are expressed relative to those within the gigantocellular reticular nucleus (GRN) because this region is minimally affected by BSW treatment.
- Add 500 µL of glycerol to the bottom of a 35-mm glass-bottom dish.
- Transfer the slice to the glycerol solution and cover its surface with a coverglass.
- Remove excess glycerol from the edge of the coverglass.
- Measure the fluorescence intensity of the slice under a fluorescence microscope.
- After microscopic measurement, return the slice to the well.
- Repeat the measurement for all 12 slices.
- Add 500 µL of PB to each well and store the 24-well plate at 4 °C overnight; on the following day, the slices will be saturated with 50% glycerol-PB.
- Replace the solution with 30% glycerol-PB and store it at 4 °C for at least 2 h.
- Perform the procedures in step 7 within a few weeks.
7. Cryosectioning and immunohistochemistry
- Prepare a 24-well plate by adding 1000 µL of a mixture of equal volumes of tissue freezing medium and 30% glycerol-PB to well 1. Then, add 1000 µL of tissue freezing medium to well 2.
- Transfer the slice to well 1 and shake the plate at 4 °C for 1 h.
- Transfer the slice to well 2 and shake the plate at 4 °C for 1 h.
- Quickly freeze the slice with isopentane using dry ice, taking care not to bend the slice. Store the slices at -80 °C until cryosectioning.
- Cryosection the slice to a thickness of 6 µm. After drying on the microscope slide, store the sections at -80 °C.
- For antigen retrieval17, immerse the sections in 10 mM sodium citrate (pH 6.0), heat to 100 °C once, and then maintain at 98 °C for 1 h.
- Wash the sections extensively in distilled water. The sections are now ready for immunohistochemical staining.
Results
Figure 1A shows the time course of dye injection in relation to the onset of BSW, with a peak overpressure of 25 kPa. In the 'Post' protocol, Evans blue solution was administered intravascularly 2 h before FITC-dextran perfusion, which was conducted 6 h, 1 day, 3 days, and 7 days after BSW exposure. In the 'Pre' protocol, Evans blue solution was injected immediately before BSW exposure. In the 'Post' protocol, the concentration of Evans blue is expected to reach its maximum approximately 2 h before perfusion fixation, whereas in the 'Pre' protocol, it is expected to reach its maximum around the time of BSW exposure (Figure 1B). The concentration of FITC-dextran in the brain-blood vessels was maintained constant for 2 min during perfusion.
Evans blue labeling showed that BBB breakdown started within 6 h and continued until 7 days after BSW exposure (Figure 2A). Notably, BBB breakdown did not occur immediately after BSW exposure, as there was no Evans blue dye extravasation at 3 h in the 'Pre' protocol (Figure 2B). Surprisingly, long-term labeling with Evans blue indicated its cumulative nature in the 'Pre' protocol (Figure 2B)7.
The use of two distinct dyes, each introduced at intervals of 2 h or more, allowed the examination of temporal changes in BBB integrity by comparing their distribution. Figure 3 shows fluorescence images of the slices that exhibited a significant difference in the distribution of Evans blue and FITC-dextran.
Numerous fluorescence hotspots of various sizes were observed. Although some hotspots were bright enough to rank among the top 0.1% of pixels, many were only slightly brighter than the surrounding tissues. The discrepancy between the dyes suggests that changes occurred within this interval. Hotspots displaying only Evans blue fluorescence indicated ongoing BBB breakdown at the time of Evans blue injection, which was later repaired by the FITC-dextran injection. In contrast, hotspots showing only FITC-dextran fluorescence suggested that BBB disruption occurred between the two dye injections. Lastly, hotspots exhibiting fluorescence from both dyes indicated continuous BBB breakdown during the entire injection period.
Figure 4A presents the number of hotspots positive for Evans blue (including both Evans blue-only and Evans blue/FITC-dextran double-positive hotspots), FITC-dextran (including both FITC-dextran-only and Evans blue/FITC-dextran double-positive hotspots), or both dyes (only Evans blue/FITC-dextran double-positive hotspots). In the 'Pre' protocol at 3 h, numerous FITC-dextran-only hotspots were observed. At 6 h and 1 day in the 'Post' protocol, both Evans blue-only and FITC-dextran-only hotspots were detected. However, at 3 days and 7 days in the 'Post' protocol, the hotspots were predominantly positive for both dyes. These findings suggest that BBB breakdown occurred at 3 h, was remodeled by 1 day, and persisted until 7 days after BSW exposure (Figure 4B). Importantly, the extent of BBB breakdown tended to decrease by 7 days, as previously mentioned.
Following the completion of the dye extravasation experiments, immunohistochemical staining of the slices was carried out7. The immunohistochemical image scans were consistently compared with those of the dye extravasations, confirming that the carry-over effect of the fluorescent substances was practically negligible7. As shown in Figure 5, clusters of reactive astrocytes were closely associated with sites of BBB breakdown. Further observations revealed that activated and amoeboid microglia were present alongside reactive astrocytes 3 days after BSW exposure.
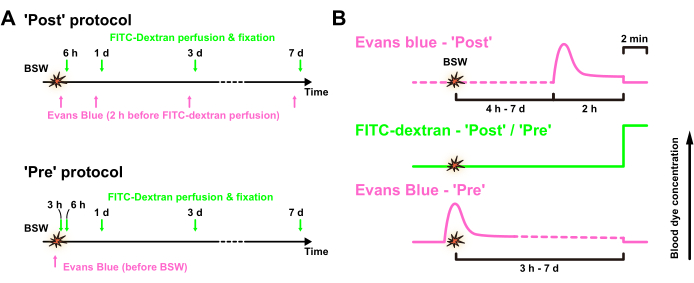
Figure 1: Experimental design. (A) Time course of the experiment. Evans blue solution was intravenously injected after ('Post' protocol) or immediately before ('Pre' protocol) BSW exposure, whereas FITC-dextran was transcardially perfused for 2 min before fixation. (B) Expected concentrations of Evans blue and FITC-dextran in the blood vessels in the 'Post' and 'Pre' protocols, respectively. BSW, blast-induced shock waves; FITC, fluorescein isothiocyanate. This figure is adapted from Nishii et al.7. Please click here to view a larger version of this figure.
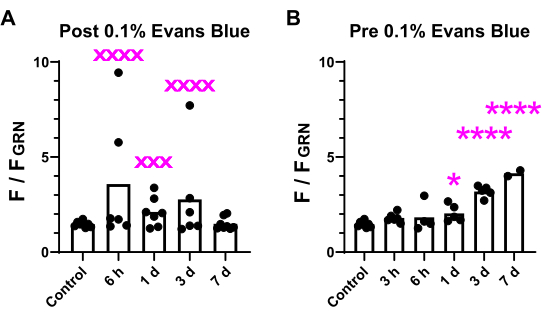
Figure 2: Comparison of fluorescence intensity in brain slices. The fluorescence intensity of the brightest 0.1% of pixels in the brain was assessed across all 12 slices and compared between the 'Post' (A) and 'Pre' (B) conditions. The variability and significance of the differences are indicated. xxx denotes p < 0.001; xxxx denotes p < 0.0001 (p values from F-test). *p < 0.05; ****p < 0.0001 (analysis of variance with Dunnett's multiple comparisons post hoc test). This figure is adapted from Nishii et al.7. Please click here to view a larger version of this figure.
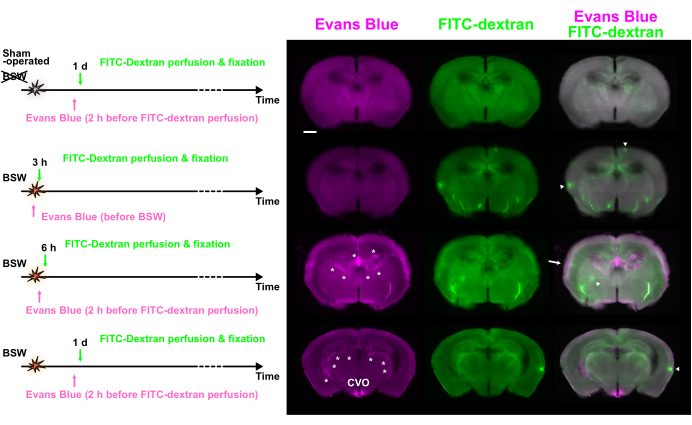
Figure 3: BBB breakdown observed at various time points using double labeling with Evans blue and FITC-dextran. Evans blue (magenta), FITC-dextran (green), and merged images are shown. The dye injection protocols are presented on the left side. Some hotspots showed predominant fluorescence of Evans blue (arrow) or FITC-dextran (arrowheads). Asterisks indicate the choroid plexus and related vessels. BBB, blood-brain barrier; FITC, fluorescein isothiocyanate; CVO, circumventricular organs of the third ventricle. Scale bar: 1 mm. This figure is adapted from Nishii et al.7. Please click here to view a larger version of this figure.
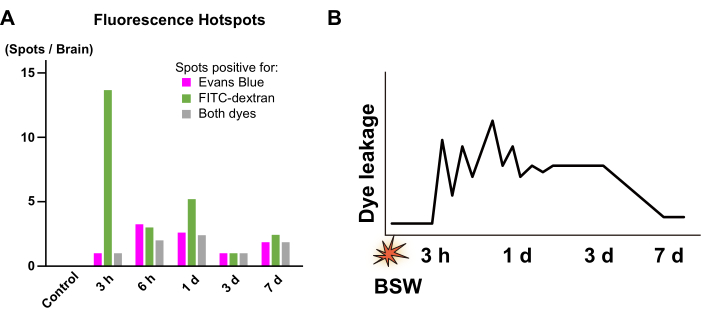
Figure 4: Quantification of the fluorescence hotspots. (A) Numbers of the hotspots positive for Evans blue (magenta), FITC-dextran (green), and both dyes (gray). They were collected from the images obtained at 3 h in the 'Pre' protocol as well as from the images obtained at 6 h, 1 day, 3 days, and 7 days in the 'Post' protocol. From 3 h to 1 day, a significant portion of the fluorescence hotspots showed a between-dye mismatch, whereas, from 3 days to 7 days, such mismatch was hardly observed. (B) Scheme summarizing the time course of BBB breakdown. The vertical axis conceptually represents the intensity of dye leakage due to BBB breakdown. The zigzag pattern from 3 h to 1 day indicates that the location and intensity of dye leakage are unstable during this period. FITC, fluorescein isothiocyanate; BBB, blood-brain barrier; BSW, blast-induced shock waves. This figure is adapted from Nishii et al.7. Please click here to view a larger version of this figure.

Figure 5: Expression of GFAP and Iba1 as markers for astrocytes and microglia, respectively. Each column of the figure contains fluorescence images of dye extravasation with Evans blue or FITC-dextran, along with GFAP or Iba1 immunohistochemical images. The color bar indicates normalized fluorescence intensities of Evans blue and FITC-dextran using those within GRN. The dye injection protocols are presented on the left side. The slice of 1 day in the 'Pre' protocol shows fluorescence of both Evans blue and FITC-dextran, whereas the slice of 3 days in the 'Pre' protocol shows only fluorescence of Evans blue (arrows). The regions denoted by the arrows in the dye extravasation images align with the immunohistochemical images. Arrowheads indicate clusters of reactive astrocytes. The polyclonal GFAP antibody labeled astrocytes in and around the white matter as well as in nervous tissue adjacent to the pia mater. As a result, astrocytes within and close to the dcw are labeled in this figure. The magnified images corresponding to the frame or arrow in the Iba1 column are depicted in the insets. Scale bars: 1 mm and 200 µm for the dye extravasation and immunohistochemical images, respectively. GFAP, glial fibrillary acidic protein; Iba1, ionized calcium-binding adapter molecule 1; FITC, fluorescein isothiocyanate; BSW, blast-induced shock waves; dcw, deep cerebral white matter. This figure is adapted from Nishii et al.7. Please click here to view a larger version of this figure.
Discussion
A novel double-labeling technique using Evans blue and FITC-dextran was used to accurately visualize the precise spatiotemporal distribution of BBB breakdown in a single brain. In the low-intensity BSW model, noticeable variations in the extent, location, and degree of dye extravasation were observed in examined brains (Figure 2 and Figure 3). Between-dye mismatches revealed that BBB breakdown commenced approximately 3 h after BSW exposure, with substantial remodeling occurring by day 1 and continuing through day 7 (Figure 4). In severe cases, active microglia were recruited to the sites of BBB breakdown, and clusters of reactive astrocytes were closely linked to these areas (Figure 5). By performing immunohistochemistry on the same slices used for dye extravasation analysis, a precise correlation was established between glial reactions and dye extravasation. For more detailed data and analysis, please refer to Nishii et al.7.
Because FITC-dextran was perfused at a constant concentration for an identical duration immediately before perfusion fixation, the distribution and intensity of the dye likely accurately represent the extent of BBB breakdown at the time of perfusion fixation. However, it has been demonstrated in a previous report that the fluorescence of FITC-dextran tends to be weak in a low-intensity BSW model7. Labeling with Evans blue for a longer duration was advantageous, as it could detect more subtle changes in BBB breakdown (Figure 2). However, owing to the longer duration of labeling, caution may be required when interpreting fluorescent images of Evans blue. The blood concentration of Evans blue was the highest immediately after injection and gradually decreased over a few hours (Figure 1)11. It is speculated that the intensity of labeling would correlate with the severity and duration of BBB breakdown as well as the blood concentration of Evans blue; however, it would decrease exponentially once repaired. All of these factors vary from time to time and from one experiment to another. Therefore, a conclusion should not be drawn from a single image of dye extravasation, and statistical considerations are always necessary.
Depending on the purpose of the experiment, it might be interesting to change the molecular weight as well as the combination of dyes. In this study, a combination of Evans Blue and FITC-dextran was used. After binding with serum albumin, Evans blue behaved as a 69-kDa tracer, and the 40-kDa FITC-dextran used in this study showed a similar extent of BBB breakdown as Evans blue. The spatiotemporal distribution of BBB breakdown was systematically investigated using a combination of dyes that emit different fluorescence7. In a previous study that utilized a combination of Evans blue and sodium fluorescein (376 Da), sodium fluorescein, owing to its smaller molecular weight, could label a broader range of BBB breakdown after BSW exposure3. In other studies, combinations of Evans blue and higher-molecular-weight FITC-dextran were used to compare the extent of BBB breakdown18,19. All previous reports administered Evans blue and FITC-dextran almost simultaneously. The unique aspect of the protocol presented here is that the two dyes were introduced at different time points, allowing for the examination of the temporal progression of BBB breakdown.
The cumulative nature of Evans blue may prove beneficial in different BBB breakdown models. Because it records the history of BBB breakdown, an understanding of the onset and progression of the disease may be facilitated. Researchers should be aware of the positive and negative characteristics of dyes and utilize them to the fullest extent9. This protocol has a broad range of applications for various BBB breakdown models.
Disclosures
The authors have nothing to disclose.
Acknowledgements
We thank Mayumi Watanabe for the cryosectioning technique. This work was supported by an Advanced Research on Military Medicine grant from the Ministry of Defense, Japan.
Materials
| Name | Company | Catalog Number | Comments |
|---|---|---|---|
| 10% Formalin Neutral Buffer Solution | FUJIFILM Wako Chemicals | 062-01661 | |
| Anti GFAP, Rabbit | DAKO-Agilent | IR524 | |
| Anti Iba1, Rabbit | FUJIFILM Wako Chemicals | 019-19741 | |
| Chicken anti-Mouse IgG (H+L) Cross-Adsorbed Secondary Antibody, Alexa Fluor 488 | Thermo Fisher Scientific | A-21200 | |
| Cryo Mount | Muto Pure Chemicals | 33351 | tissue freezing medium |
| Domitor | Orion Corporation | medetomidine | |
| Donkey anti-Rabbit IgG (H+L) Highly Cross-Adsorbed Secondary Antibody, Alexa Fluor 546 | Thermo Fisher Scientific | A10040 | |
| Evans Blue | Sigma-Aldrich | E2129 | |
| Falcon 24-well Polystyrene Clear Flat Bottom Not Treated Cell Culture Plate, with Lid, Individually Wrapped, Sterile, 50/Case | CORNING | 351147 | |
| Fluorescein isothiocyanate–dextran average mol wt 40,000 | Sigma-Aldrich | FD40S | FITC-dextran |
| Glass Base Dish 27mm (No.1 Glass) | AGC TECHNO GLASS | 3910-035 | 35 mm glass bottom dish |
| IX83 Inverted Microscope | OLYMPUS | ||
| MAS Hydrophilic Adhesion Microscope Slides | Matsunami Glass | MAS-04 | |
| Matsunami Cover Glass (No.1) 18 x 18mm | Matsunami Glass | C018181 | |
| Midazolam Injection 10mg [SANDOZ] | Sandoz | ||
| Paraformaldehyde EMPROVE ESSENTIAL DAC | Merck Millipore | 1.04005.1000 | |
| Peristaltic Pump | ATTO | SJ-1211 II-H | |
| RODENT BRAIN MATRIX Adult Mouse, 30 g, Coronal | ASI INSTRUMENTS | RBM-2000C | brain slicer |
| Vetorphale | Meiji Animal Health | VETLI5 | butorphanol |
References
- Sweeney, M. D., Zhao, Z., Montagne, A., Nelson, A. R., Zlokovic, B. V. Blood-brain barrier: From physiology to disease and back. Physiol Rev. 99 (1), 21-78 (2019).
- Kabu, S., et al. Blast-associated shock waves result in increased brain vascular leakage and elevated ros levels in a rat model of traumatic brain injury. PLoS One. 10 (5), e0127971(2015).
- Kuriakose, M., Rama Rao, K. V., Younger, D., Chandra, N. Temporal and spatial effects of blast overpressure on blood-brain barrier permeability in traumatic brain injury. Sci Rep. 8 (1), 8681(2018).
- Yeoh, S., Bell, E. D., Monson, K. L. Distribution of blood-brain barrier disruption in primary blast injury. Ann Biomed Eng. 41 (10), 2206-2214 (2013).
- Readnower, R. D., et al. Increase in blood-brain barrier permeability, oxidative stress, and activated microglia in a rat model of blast-induced traumatic brain injury. J Neurosci Res. 88 (16), 3530-3539 (2010).
- Shetty, A. K., Mishra, V., Kodali, M., Hattiangady, B. Blood-brain barrier dysfunction and delayed neurological deficits in mild traumatic brain injury induced by blast shock waves. Front Cell Neurosci. 8, 232(2014).
- Nishii, K., et al. Evans blue and fluorescein isothiocyanate-dextran double labeling reveals the precise sequence of vascular leakage and glial responses after exposure to mild-level blast-associated shock waves. J Neurotrauma. 40 (11-12), 1228-1242 (2023).
- Hoffmann, A., et al. High and low molecular weight fluorescein isothiocyanate (FITC)-dextrans to assess blood-brain barrier disruption: Technical considerations. Transl Stroke Res. 2 (1), 106-111 (2011).
- Saunders, N. R., Dziegielewska, K. M., Møllgård, K., Habgood, M. D. Markers for blood-brain barrier integrity: How appropriate is Evans blue in the twenty-first century and what are the alternatives. Front Neurosci. 9, 385(2015).
- Manaenko, A., Chen, H., Kammer, J., Zhang, J. H., Tang, J. Comparison Evans blue injection routes: Intravenous versus intraperitoneal, for measurement of blood-brain barrier in a mice hemorrhage model. J Neurosci Methods. 195 (2), 206-210 (2011).
- Yen, L. F., Wei, V. C., Kuo, E. Y., Lai, T. W. Distinct patterns of cerebral extravasation by Evans blue and sodium fluorescein in rats. PLoS One. 8 (7), e68595(2013).
- Kawai, S., Takagi, Y., Kaneko, S., Kurosawa, T. Effect of three types of mixed anesthetic agents alternate to ketamine in mice. Exp Anim. 60 (5), 481-487 (2011).
- Machholz, E., Mulder, G., Ruiz, C., Corning, B. F., Pritchett-Corning, K. R. Manual restraint and common compound administration routes in mice and rats. J Vis Exp. 67, e2771(2012).
- Satoh, Y., et al. Molecular hydrogen prevents social deficits and depression-like behaviors induced by low-intensity blast in mice. J Neuropathol Exp Neurol. 77 (9), 827-836 (2018).
- Gage, G. J., Kipke, D. R., Shain, W. Whole animal perfusion fixation for rodents. J Vis Exp. 65, e3564(2012).
- Selever, J., Kong, J. Q., Arenkiel, B. R. A rapid approach to high-resolution fluorescence imaging in semi-thick brain slices. J Vis Exp. 53, e2807(2011).
- Jiao, Y., et al. A simple and sensitive antigen retrieval method for free-floating and slide-mounted tissue sections. J Neurosci Methods. 93 (2), 149-162 (1999).
- Nagaraja, T. N., Keenan, K. A., Fenstermacher, J. D., Knight, R. A. Acute leakage patterns of fluorescent plasma flow markers after transient focal cerebral ischemia suggest large openings in blood-brain barrier. Microcirculation. 15 (1), 1-14 (2010).
- Xu, Y., et al. Quantifying blood-brain-barrier leakage using a combination of Evans blue and high molecular weight fitc-dextran. J Neurosci Methods. 325, 108349(2019).
Reprints and Permissions
