The presence of mast cells in the inner margin and peritumor areas of hepatocellular carcinoma after resection confers a favorable prognosis. This study endorses QuPath image analysis software as a promising platform that could meet the need for reproducibility, consistency, and accuracy in digital pathology.
Method Article
Mast Cells in the Microenvironment of Hepatocellular Carcinoma Confer Favorable Prognosis: A Retrospective Study using QuPath Image Analysis Software
In This Article
Summary
Abstract
The insights provided by in-situ detection of immune cells within hepatocellular carcinoma (HCC) might present information on patient outcomes. Studies investigating the expression and localization of immune cells within tumor tissues are associated with several challenges, including a lack of precise annotation for tumor regions and random selection of microscopic fields of view. QuPath is an open-source, user-friendly software that could meet the growing need for digital pathology in whole-slide image (WSI) analysis.
The infiltration of HCC and adjacent tissues by CD1a+ immature dendritic cells (iDCs), CD117+ mast cells, and NKp46+ natural killer cells (NKs) cells was assessed immunohistochemically in representative specimens of 67 patients with HCC who underwent curative resection. The area fraction (AF) of positively stained cells was assessed automatically in WSIs using QuPath in the tumor center (TC), inner margin (IM), outer margin (OM), and peritumor (PT) area. The prognostic significance of immune cells was evaluated for time to recurrence (TTR), disease-free survival (DFS), and overall survival (OS).
The AF of mast cells was significantly greater than the AF of NKs, and the AF of iDCs was significantly lower compared to NKs in each region of interest. High AFs of mast cells in the IM and PT areas were associated with longer DFS. In addition, high AF of mast cells in IM was associated with longer OS.
Computer-assisted analysis using this software is a suitable tool for obtaining prognostic information for tumor-infiltrating immune cells (iDCs, mast cells, and NKs) in different regions of HCC after resection. Mast cells displayed the greatest AF in all regions of interest (ROIs). Mast cells in the peritumor region and IM showed a positive prognostic significance.
Introduction
The spatial organization and abundance of tumor-infiltrating immune cells have been proven to impact survival in different cancers, hepatocellular carcinoma (HCC) included1,2,3,4. The prognostic significance of tumor-infiltrating lymphocytes in cancers was first shown on hematoxylin and eosin (H&E) stained sections5,6. Then, a pioneer study by Galon et al. using immunohistochemistry (IHC) demonstrated associations of the densities of CD3+ and CD8+ T cells in colon cancer tissue with prognosis4.
IHC is a gold standard for visualizing, quantifying, and mapping immune cells within tumor tissue for further association with clinical outcomes7. IHC presents several advantages, such as low cost, widespread availability, and compatibility with formalin-fixed paraffin-embedded (FFPE) tissue8. However, accurate assessment of IHC-stained immune cells is a big challenge. Traditional scoring in selected microscopic fields of view is time-consuming and no longer sufficient to ensure the high-quality, reproducible, objective analysis essential for candidate biomarker selection and reliable clinical correlation9. Whole-slide scans can be assessed as a whole image or after subsampling10.
Computerized quantitative assessment of the abundance of immune cells in tissue samples can ensure practical, accurate, reliable, and clinically relevant data11. QuPath is a free, open-source software that enables the digital image analysis of IHC-stained slides and maximizes the amount of information yielded from individual samples12.
Since immature dendritic cells (iDCs), natural killer (NK) cells, and mast cells are involved in anti-tumor immune responses and were shown to correlate with patients' outcomes13,14,15, we here present a step-by-step protocol for assessing their spatial distribution in FFPE HCC tissue and exploring their prognostic impact. CD1a is expressed mainly on the membrane of immature dendritic cells, the density of which has been associated with clinical outcomes in a variety of human tumors16,17. Mast cells can play a protumor or anti-tumor role within the tumor microenvironment (TME)18. They can support angiogenesis and facilitate metastasis19. Conversely, it has been reported that mast cells can mediate tumor cell apoptosis through the production of IL-420. Anti-CD117 staining is commonly used to visualize and quantify mast cells within the tumor tissue21. NK cells are thought to contribute to the surveillance and control of HCC22 by killing cancer cells23. NKp46 expression by NK is a crucial parameter for their anti-tumor activity24. However, NKp46+ NK cells correlated positively with tumor diameter in HCC patients25. Despite this, little is known about their correlation with patient survival.
We aimed to quantitatively assess the abundance of CD1a+ iDCs, CD117+ mast cells, and NKp46+ NK cells in different regions of HCC and highlight their prognostic significance. A total of 70 consecutive patients with pathologically confirmed stage I-IV HCC, who were eligible for resection according to BCLC guidelines and underwent curative-intent liver resection at Pilsen University Hospital between 1997 and 2019, were included in the current retrospective study. Pathology reports of the patients were reviewed. None of the patients included in this study had distant metastases nor had received neoadjuvant therapy such as chemotherapy or radiotherapy before surgery. A total of 3 patients with poor-quality histological specimens were excluded, and the remaining 67 patients were included in the study (Table 1).
Protocol
This protocol was part of a study conducted in accordance with the ethical standards set out in the Declaration of Helsinki (2013 version); it was approved by the Ethics Committee of the Faculty of Medicine and the University Hospital in Pilsen (118/2021, 11 March 2021). Figure 1 shows a summary of the employed methods.
1. Selection of FFPE tissue blocks
- Retrieve FFPE block identifiers from patient files with the help of treating physicians or pathologists.
- Request the FFPE blocks from the local pathology archive.
- For each patient, select 2-3 FFPE blocks containing viable tumor tissue, preferentially with the surrounding peritumor area and non-tumor liver.
NOTE: It is advised to obtain an expert pathologist's opinion for this selection. Histological assessment of the non-tumor liver, along with anamnestic, clinical, and laboratory data was used to define the underlying etiology of HCC.
2. Deparaffinization and rehydration of FFPE tissue
- Cut one or two tissue sections of 4 µm thickness from each of the FFPE tissue blocks on a microtome.
NOTE: The thickness of the sections can be between 3 µm and 5 µm without noticeable staining impact; however, a thickness of 4 µm is the standard. - Place the sections in a water bath (42˚C) to remove wrinkles.
- Mount the slides by picking them up and placing them on a positively charged glass microscopic slide. Then, apply the slides for drying at ambient temperature (AT) for 24 h.
- Place the slides in a thermostat (56 ˚C) for 1 h.
- Use an autostainer to deparaffinize the sections in dewax solution-1 (30 s at 72 °C), dewax solution-2 (10 s at 72 °C), dewax solution-3 (10 s at AT), ethanol 96%-1 (10 s), ethanol 96%-2 (10 s), and ethanol 96%-3 (10 s).
- Use an autostainer to rehydrate the sections in wash solution-1 (10 s, AT), wash solution-2 (10 s, AT), and wash solution-3 (5 min, AT).
3. Performing IHC in a fully automated stainer
NOTE: IHC is performed according to the manufacturer's protocol. The steps are briefly explained below.
- Antigen retrieval method
- Retrieve antigen using the heat-induced epitope retrieval (ER) procedure in an ER solution with a high pH (e.g., Tris-EDTA): ER solution-1 (10 s, AT), ER solution-2 (10 s, AT), ER solution-3 (20 min at 100 ˚C), ER solution-4 (12 min, AT).
- Rinse the slide in a wash solution for 3x (30 s each) and 1x (3 min).
- Block endogenous peroxidase using the Peroxide Block solution for 5 min at AT.
- Rinse in a wash solution for 3x (30 s each).
- Block nonspecific binding of antibodies with a protein block for NKp46 only for 30 min. at AT.
- Binding with primary antibodies: Incubate with primary antibodies for 15 min at AT, then rinse with a wash solution for 3x (30 s each).
- For secondary antibody binding, follow the steps described below.
- Incubate with horseradish peroxidase-conjugated secondary antibodies for 8 min at AT.
- Rinse with a wash solution for 2x (2 min each) and 1x with deionized water.
- Visualize the reaction by rinsing the slides with diaminobenzidine (DAB) solution and then incubating them with the DAB solution for 10 min at AT.
- Rinse for 3x (30 s) with deionized water.
- Counterstain the sections with Mayer's hematoxylin.
- Rinse with deionized water for 1x (30 s), wash solution for 1x (30 s), and deionized water for 1x (30 s).
- Use a fully automated slide stainer to dehydrate the sections in ethanol 70% (2 min), ethanol 80% (2 min), ethanol 96%-1 (3 min), ethanol 96%-2 (3 min), ethanol 100% (3 min), xylene-1 (4 min), xylene-2 (4 min), and xylene-3 (4 min).
- Use a fully automated glass coverslipper to mount the sections on the slides into a mounting medium.
NOTE: Negative and positive (tonsils) tissue control samples were used throughout.
4. Obtaining whole-slide scans
- Scan the stained slides using the 20x objective and moderate-high density of focusing on a whole-slide scanner.
5. IHC analysis using the software
- Create a project for the IHC images in the software.
- Download and open QuPath-0.4.3 (or higher).exe
- Create a new folder with a suitable name.
- Click the Create Project button in the upper left corner of the software and select the newly created folder.
- Drag scanned images into the software window. When a new window automatically pops up, select Set Image Type > H-DAB and click Import (Figure 2).
- Observe the list of images in the left window of the menu; double-click to open the image.
- Select from the main menu at the top File to Save the images as a project.
NOTE: The software can handle a wide range of image formats, including many whole slide formats. However, tiff format is preferred to prevent the loss of raw data and associated metadata.
- Annotate regions of interest
- Select the Brush tool or the Wand tool from the main menu at the top to annotate the tumor area. For discontinuous regions of the tumor, follow steps 5.2.1.1-5.2.1.3.
- Annotate them separately.
- Press and hold the Ctrl key while selecting all tumor regions
- Right-click and select Edit Multiple > Merge Selected.
- Make sure that the tumor annotation is selected (borders have a yellow color).
- Click Automate in the main menu and select Show Script Editor.
- Copy the script available in Supplementary File 1 or at https://petebankhead.github.io/qupath/scripts/2018/08/08/three-regions.htmls and paste it in the Script Editor, then click Run. The ROIs: tumor center (TC), inner margin (IM), outer margin (OM), and peritumor area (PT) will be created and labeled automatically.
- For an alternative way to create regions of interest, follow steps 5.2.5.1-5.2.5.5.
- Select the Polyline tool from the main menu at the top to draw a border separating the malignant cell nests and adjacent non-tumor tissue.
- Select the resulting border. Select from the main menu at the top Objects > Annotation > Expand annotations > 500 µm for Expansion Radius > Flat for Line Cap. Activate Remove Interior and activate Constrain to parent.
- Right-click the resulting annotation, Edit Single > Split. Two separate annotations will be extended automatically as 500 µm-wide regions on each side of the border.
- Name the annotated regions appropriately for IM and OM by right-clicking the annotation on the list on the left, selecting Set Properties, and entering the name.
- The TC represents the remaining tumor area. Extend the 500 µm-wide PT area adjacent to the OM using the same procedure.
NOTE: Annotated slides and QuPath AF detections were reviewed by an expert histopathologist.
- Select the Brush tool or the Wand tool from the main menu at the top to annotate the tumor area. For discontinuous regions of the tumor, follow steps 5.2.1.1-5.2.1.3.
- Optimization of pixel classification
- Select the Rectangle tool from the main menu. Then annotate a region, which contains all types of pixels to be distinguished (e.g., hematoxylin, DAB, and background).
- From the main menu, select Analyze > Preprocessing > Estimate Stain Vector.
- When the window Visual Stain Editor automatically pops up, select Auto > OK, and set H- DAB estimated as the name for the stain vector.
- For an alternative method, follow steps 5.3.4.1-5.3.4.3.
- Select the Rectangle tool from the main menu and annotate a small region of a typical nucleus stained with hematoxylin.
- Select Image from the left menu and double-click on Stain 1 > Yes.
- Select the Rectangle tool from the main menu and annotate a small region of positive staining with DAB. Select Image from the left menu and double-click on Stain 2 > Yes.
- Assessment of area fraction of positive immune cells using the Pixel Classification option.
- From the main menu, click Classify > Pixel classification > Create thresholder.
- Select High for the Resolution > Channel: DAB > Prefilter: Gaussian > Sigma: 0.5 > (Figure 3) Threshold: (0.2-0.3) > Above Threshold: Positive > Below Threshold: Negative.
- For the region, select Any Annotation, type a name for the Classifier > Save > Measure > OK. The DAB-positive cells will be changed to red color (Figure 4).
- Copy the results from the left side menu to a spreadsheet.
- Or open Measure in the upper main menu, select Show Annotation Measurements > Copy to Clipboard, and paste results into a spreadsheet.
- To close the image, right-click > Multi View > Close Viewer.
NOTE: Before quantification, any artifacts were eliminated. The threshold was adjusted for each case with a weak specific positive staining. The correctness of annotations and pixel classification was first crosschecked and then reviewed by a senior histopathologist. All analyses were done in a blind fashion. More information about the analysis of IHC using the software can be found at https://forum.image.sc/tag/QP.
6. Statistical methods and data analysis
- The study endpoints were time to recurrence (TTR), disease-free survival (DFS), and overall survival (OS). Patients without relapse or death were censored at their last follow-up.
NOTE: Continuous nonnormally distributed data are expressed as median (min-max). Proportions are expressed as raw data (percentages). Area fractions of immune cells in different regions of interest (ROIs) were compared by Friedman ANOVA, followed by Wilcoxon matched pairs test with Bonferroni correction. Because of the nonparametric distribution of most of the variables, the Spearman correlation was used to evaluate the associations between pairs of ordinal or quantitative variables. To determine the prognostic value of individual predictors for endpoints, an univariable followed by multivariable Cox regression analysis was performed. Hazard ratios (HR) were calculated. HR was showing the relative risk for the combined intermediate high group compared to 1 for the low group. All survival estimates were calculated by the Kaplan-Meier method and compared between groups by the log-rank test. GraphPad Prism 9.0 (GraphPad Software LLC) was used for the statistical analyses. A 2-sided p-value < 0.05 was considered statistically significant.
Results
The demographics and clinical characteristics of the patients are presented in Table 1. The median age of the patients was 69 years, and most were males (77.6%). Regarding the etiology of HCC, chronic non-viral hepatitis was the most frequent background disease, with a prevalence of non-alcoholic steatohepatitis (NASH) (23.9%). Only 15 patients (22.4%) had cirrhosis as a background disease. A majority of patients (68.7%) had TNM stage I. More detailed clinical and pathology findings were described in our previously published work2,26.
Outcomes
At the last follow-up, tumor recurrence was observed in 29 (41.8%) patients, of which 89.7% had local recurrence and 38 (56.7%) patients had died. At 5 years after surgery, the proportion of DFS was 33.2%, the proportion OS was 49.4%, and the recurrence-free proportion (RFP) was 48.7% (Table 2).
Distribution of immune cells in different regions of interest
The CD117-protein was found predominantly in the cytoplasmic membrane of rounded cells (Figure 5A). In the TC and IM, they were mostly localized in the stroma and in the perivascular space. In the OM and PT areas, the CD117+ cells were observed in the tumor capsule and in the perivascular space.
The NKp46-protein was found mostly in the cytoplasmic membrane of rounded cells, which were present inside sinusoid-like spaces in the TC and IM, as well as being associated with the stroma (Figure 5B). In the OM and PT area, NKp46+ cells were observed in capsules around tumor nests and in the stroma of portal tracts.
The CD1a-protein was found in the TC and IM, mostly in the cytoplasmic membrane of rounded cells (scattered or in aggregates) in the stroma, inside and along the boundaries of sinusoid-like spaces (Figure 5C). In the PT area, CD1a+ DC was observed inside and along the boundaries of sinusoids and within the biliary epithelium in the portal tracts.
The AF of mast cells was significantly greater than the AF of NKp46+ cells (p < 0.001) (Figure 6). CD1a+ iDCs in each ROI showed the lowest AF compared to mast cells and NK cells (p < 0.001) (Figure 6). The AF of CD117+ and NKp46+ cells in TC or IM were significantly smaller than those in the PT area and OM (p < 0.001) (Figure 6). For CD1a+ cells, the AF did not differ significantly between regions.
Significant associations for individual immune cells between all ROIs are shown in Table 3. Figure 7 shows the heat map for significant associations between different immune cells within different regions. The AF of CD117 + mast cells in TC correlated significantly with the AF of CD1a in the TC and IM.
Prognostic value of clinical and pathology variables
Among the clinical and pathology variables, only younger age was associated with a greater risk of recurrence (HR = 0.96, CI: 0.93-0.99, p = 0.007), whereas no variable was associated with DFS and OS (Table 4).
Prognostic values of infiltrating immune cells
A high AF of CD117+ mast cells in IM was associated with longer DFS (HR = 0.48, CI: 0.241 - 0.935, p = 0.031) and OS (HR = 0.34, CI: 0.167 - 0.703, p = 0.004) (Figure 8, Table 5). In addition, a high AF of CD117+ mast cells in the PT area was associated with longer DFS (HR = 0.48, CI: 0.247 - 0.945, p = 0.034) (Figure 8, Table 5). Contrastingly, the AFs of iDC and NK cells were not associated with any of the outcomes. CD117+ mast cells in the inner margin retained significant associations with DFS (HR = 0.46, CI: 0.23-0.91, p = 0.027) and OS (HR = 0.33, CI: 0.16-0.68, p = 0.003) after adjustment for TNM stage (Table 6). As for mast cells in the PT region, the association with DFS also remained significant (HR = 0.47, CI: 0.24-0.93, p = 0.029) (Table 6).
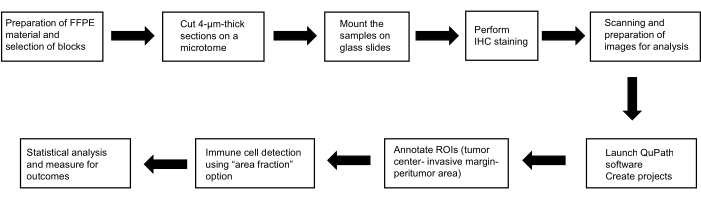
Figure 1: Representative schematic for the methods. Schematic diagram of the flow of work for identification of the prognostic role of mast cells, dendritic cells, and natural killer cells in HCC. Abbreviations: FFPE, formalin-fixed paraffin-embedded; H&E, Hematoxylin and Eosin; ROIs, regions of interest. Please click here to view a larger version of this figure.
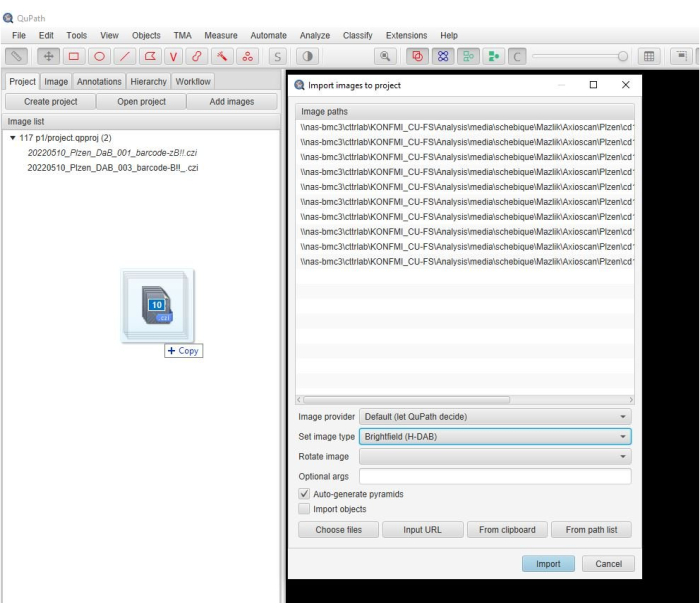
Figure 2: Screenshot of the software window. A descriptive screenshot showing the step of importing images into a project in the software. Please click here to view a larger version of this figure.
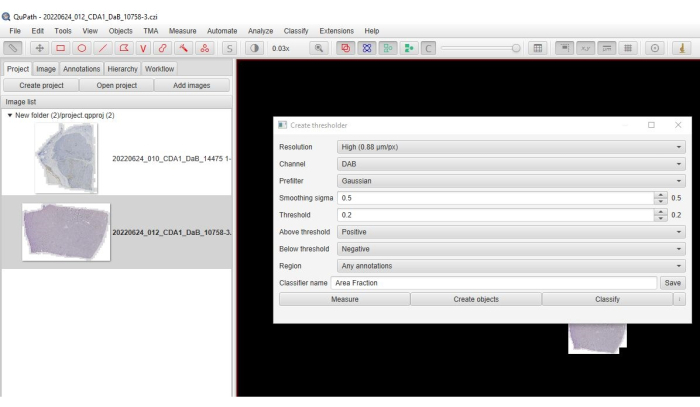
Figure 3: Screenshot of the option of area fraction. A screenshot from the software showing the selected parameters to quantify the area fraction of positive staining. Please click here to view a larger version of this figure.
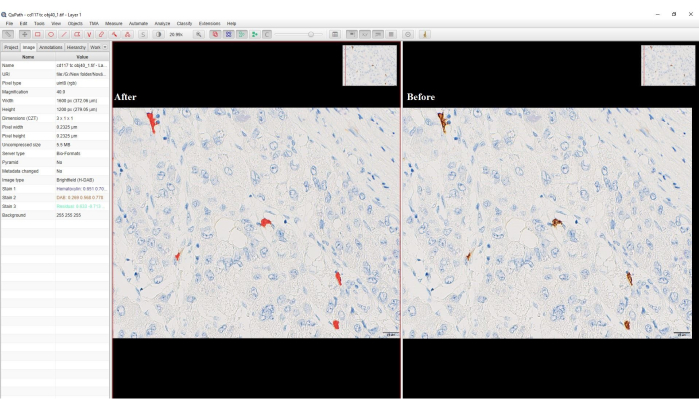
Figure 4: Screenshot of the option of pixel classification. Screenshot from the software showing the DAB positive cells before and after pixel classification. The brownish DAB staining has been converted to red color after pixel classification. Please click here to view a larger version of this figure.

Figure 5: Representative immunostaining of innate immune cells in HCC patients. Representative immunostaining of (A) CD117+, (B) NKp46+, and (C) CD1a+ cells in TC (400x) and TIM (200x) of HCC. Abbreviations: HCC, hepatocellular carcinoma; TC, tumor center; TIM, tumor invasive margin, with inner margin (IM) and outer margin (OM). The dotted line represents a border between the tumor and non-tumor tissue. Please click here to view a larger version of this figure.
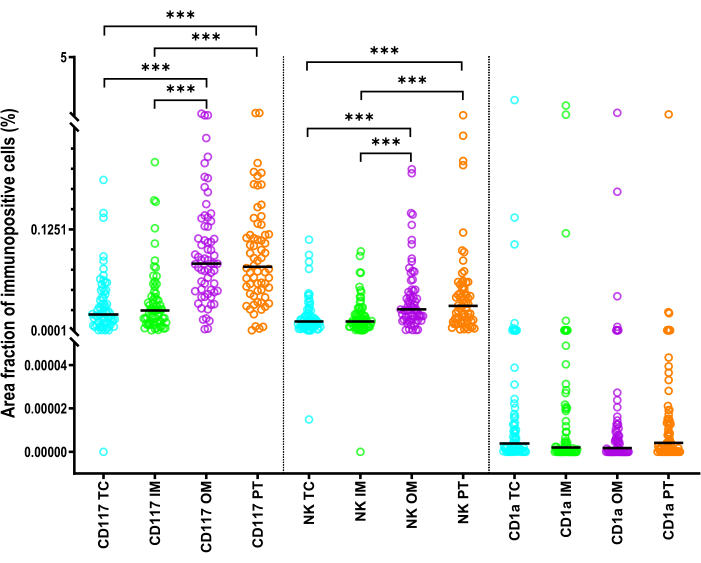
Figure 6: Statistics describing the area fraction of innate immune cells in HCC patients. Statistics for the area fraction of CD1a+ dendritic cells, CD117+ mast cells, and NKp46+ NK cells) in the TC, IM, OM, and PT areas of HCC. Black lines are medians.Wilcoxon matched pairs test with Bonferroni correction was used for comparisons. Abbreviations: HCC, hepatocellular carcinoma; TC, tumor center; IM, inner margin; OM, outer margin; PT, peritumor area. ***: p <0.001 Please click here to view a larger version of this figure.
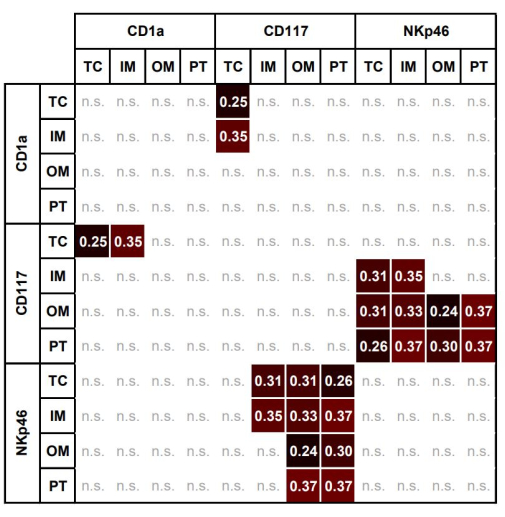
Figure 7: Heat map of significant correlations between area fractions of mast cells, DCs, and NKs in different regions of interest. Heat map of significant correlations between area fractions of CD117+ mast cells, CD1a+ DCs, and NKp46+NKs in TC, IM, OM, and PT (Spearman ρ, p < 0.05). Abbreviations: TC, tumor center; IM, inner margin; OM, outer margin; PT, peritumor area; DC, dendritic cells; NK, natural killer cells. Please click here to view a larger version of this figure.
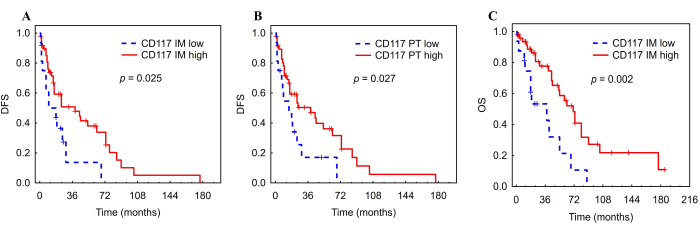
Figure 8: Kaplan-Meier DFS and OS curves for tumor-infiltrating mast cells in HCC patients. Kaplan-Meier analysis of DFS and OS according to low vs. high AF of tumor-infiltrating mast cells in the inner margin (A, C) and PT (B) of HCC. Abbreviations: HCC, hepatocellular carcinoma; DFS, disease-free survival; IM, inner invasive; PT, peritumor area. The figure has been adapted with permission from Ali et al.26. Please click here to view a larger version of this figure.
Table 1: Clinical background of enrolled hepatocellular carcinoma patients. Clinical background of enrolled cases of hepatocellular carcinoma. Abbreviations: NAFLD, non-alcoholic fatty liver disease. Please click here to download this Table.
Table 2: Estimated probability of outcomes in Kaplan-Meier analysis. The estimated probability of RFP, DFS, and OS in Kaplan-Meier analysis. Abbreviations: RFP, recurrence-free proportion; DFS, disease-free survival; OS, overall survival. Please click here to download this Table.
Table 3: Correlation between the area fraction of tumor-infiltrating mast cells, dendritic cells, and natural killer cells in different ROIs. Spearman correlation (ρ) between the area fraction of tumor-infiltrating mast cells, dendritic cells, and natural killer cells in different ROIs, p < 0.038. Abbreviations: TC, tumor center; IM, inner margin; OM, outer margin; PT, peritumor area; ROIs, regions of interest. Please click here to download this Table.
Table 4: Univariable analysis of clinical and pathology variables associated with time to recurrence (TTR), disease-free survival (DFS), and overall survival (OS). "No", female gender or "A" were the reference categories for dichotomous variables. Bold values indicate statistical significance at the p < 0.05 level. Abbreviations: HR, hazard ratio; CI, confidence interval; TTR, time to recurrence; DFS, disease-free survival. Please click here to download this Table.
Table 5: Univariable analysis of the association of area fraction of CD117+ mast cells, CD1a+denderitic cells and NKp46+natural killer cells with TTR, DFS, and OS per individual region of interest using the Cox regression (67 HCC patients). The area fraction of immune cells per area section (mm2) was converted into percentiles and then categorized into low (0-25 percentile) vs high (25-100 percentile). Hazard ratios show the relative risk compared with 1 for the low AF. Bold values indicate statistical significance at the p < 0.05 level. Abbreviations: AF, area fraction; DFS, disease-free survival; OS, overall survival; HR, hazard ratio. Please click here to download this Table.
Table 6: The area fraction of CD117+ mast cells per individual ROI associated with disease-free survival and overall survival (multivariable analysis). Multivariable analysis of the association of the area fraction of CD117+ mast cells with DFS and OS in the IM and PT area using Cox regression (67 HCC patients). The area fraction of immune cells per area section (mm2) was converted into percentiles and then categorized into low (0-24 percentile) vs high (25-100 percentile). Hazard ratios show the relative risk compared with 1 for the low AF. Bold values indicate statistical significance at the p > 0.05 level. Abbreviations: AF, area fraction; DFS, disease-free survival; OS, overall survival; HR, hazard ratio. Please click here to download this Table.
Supplementary File 1: Script for creating ROI. Please click here to download this File.
Discussion
By means of monitoring the in situ immune organization in TME, the field of immuno-oncology can add new cancer prognostic and predictive biomarkers. Our previously published paper on the role of adaptive immune cells in the TME of HCC showed positive prognostic associations of CD3+ and CD8+ T cells as well as CD20+ B cells in selected ROIs to the time to recurrence2. Here, image analysis software QuPath was used to assess the abundance of CD1a+ iDCs, CD117+ mast cells, and NKp46+ NK cells in several distinct regions of HCC and evaluated their prognostic significance. Due to the irregular shapes of some innate immune cells, their quantification can be inaccurate. This is why evaluating the area fraction of immune-positive cells was the optimal option. Among the three cell types, only CD117+ mast cells demonstrated significant prognostic impact: a higher AF of mast cells in the IM and the PT area was associated with longer survival.
Mast cells were the most abundant in all ROIs, and the association of their AF in the peritumor area and inner margin with better survival reflects the anti-tumor role of mast cells. Mast cells can be attracted into the TME by tumor-cell-released chemoattractants, such as SCF or CCL1518. Mast cells can affect anti-tumor response by direct cytotoxicity to tumor cells27 or by secreting pro-inflammatory cytokines that can inhibit tumor growth18. Increased mast cell density was protective against the recurrence of prostate cancer28, gastric cancer27, and HCC after liver transplantation29. A comprehensive investigation consisting of a larger cohort of 245 HCC patients found a positive correlation between more significant mast cell infiltration in tumor samples and more prolonged survival after tumor resection30. Rohr-Udilova et al. reported similar results of greater densities of mast cells in surrounding HCC tissue; however, only intratumor mast cell density was associated with a lower recurrence rate29.
In this study, mast cells exerted an anti-tumor effect in IM and PT liver only. The TME of different tumors is heterogeneous concerning the spatial distribution of immune cells31. The prognostic significance of immune cells in TME is also critically related to their spatial distribution32,33. Different approaches to annotating the tumor invasive margin have been proposed, including a whole margin of different widths4,34,35, inner and outer margins, again with differing widths36,37, with or without PT2,7. We followed the reproducible, standardized methodology from the International Immunooncology Biomarkers Working Group to define the invasive margin as a 1 mm region centered on the border separating the malignant cell nests from the host tissue and representing the central tumor as the remaining tumor area38. Since the earlier study highlighted significant differences in the results of inner and outer invasive margin2, those regions (each 500 µm in width) have been analyzed separately. The spatial immune profiling of the peritumor area has its distinct predictive importance39,40, and therefore, the PT area was included, too.
The analysis of TC, tumor margin, and PT liver was performed in WSIs as opposed to the option of evaluating selected fields of view in the respective regions. Whole slide imaging is a potentially rich source of data41. Since we did not perform subsampling, the "true expected value" were obtained in a time-efficient manner10. In addition, this system was reasonable because only 1 or 2 slides per block were analyzed, which enabled us to avoid the bias of patch selection42. The slow workflow challenged us in the previous study when stereology was applied for the quantification of immune cells2.
IHC allows direct localization of CD1a+ iDCs, NKp46+NK, and CD117+ mast cell expression in liver tissue, quantification of their distributions, and, therefore, sub-classification of the cohort. IHC analysis gives this study important advantages over biochemical assays in solubilized tissue, which may lead to false negative results when only a few biomarker-positive cells are present43 and do not reflect the regional reaction of immune cells to histopathological features44. IHC is also preferable over analysis in H&E-stained sections. Studies on colorectal cancer and small-cell lung cancer showed that the assessment of H&E-stained sections could provide robust, quantitative tumor-immune biomarkers45,46,47; however, limitations to reflect the actual presence of specific subtypes are still present.
High quality of tissue sections and IHC staining is a prerequisite for an accurate assessment. High background, edge artifacts, and specific but undesirable staining (e.g., staining of endothelial cells of liver sinusoidal spaces with anti-CD4 antibodies) may corrupt all results. A CD56 antibody was the first choice in the current study to detect natural killer cells but was replaced with the NKp46 antibody due to the expression of CD56 in immature bile ducts. The selection of the most appropriate marker in terms of specificity, robust staining pattern, and stability in FFPE blocks represents another issue to consider. For instance, CD117 was chosen instead of tryptase because tryptase expression may be strongly downregulated, besides, cells that do not express CD117 are not mast cells48.
QuPath gives the option to smooth the borders of ROI from the outside and to remove any artifacts, large vessels, necrotic tissue, unspecific staining, background, and aggregation of erythrocytes that should not be a part of the ROI. The operator needs to select the ROI and press the "Alt" key while annotating those artifacts.Unspecific staining was eliminated in this study as artifacts before quantification so that it did not affect the results. In case of systematically low specific staining or high background, the protocol should be reviewed to avoid possible bias. The threshold was adjusted for each case with a weak specific positive staining. Before any routine use, the protocol should be optimized. All analyses should be done in a blind fashion and ideally, the accuracy of thresholding deserves crosschecking.
QuPath is a user-friendly, intuitive, extensible, open-source solution for digital pathology and whole slide image analysis9, tested previously for image analysis in HCC49 and different cancers50,51. The easy operation of the software for WSIs and the options for annotation of regions of interest (e.g., tumoral or peritumoral areas) are the main advantages.
Application of existing, modified, or de novo created scripts may substantially speed up the analysis. The script to create annotations for ROIs was applied, which enabled fast and accurate regional segmentation instead of manual delineation. The script is not fixed, and it can be readily customized to less than 500 µm margins for regions with insufficient tissue boundaries. The width of the IM, OM, or PT area can be customized via Automate > Show script editor > adapting the line 30 Double Expand Margin Microns = 500 µm to the available width > Run. ROIs can be also added or removed. In general, the workflows in the software are not fixed, and the operator is free to develop and modify them.
A plethora of available software tools for pathological image analysis, including CellProfiler, ImageJ, Fiji, Microscopy Image Browser, and others, are available now. However, QuPath distinguishes itself through a set of advantages such as open-source architecture, user-friendly interface, algorithm customization capabilities, and integration of advanced machine-learning tools. Those features collectively position this image analysis software as a robust choice for the nuanced analysis of cancer tissues in the realm of digital pathology.
QuPath showed the lowest variability compared to commercial software HALO (IndicaLab) and QuantCenter (3DHistech) for the detection of Ki67 expression in breast cancer52. The software also possesses the potential to be instructed to run a script for all project images in a reproducible batch-processing manner.
QuPath enabled us to create quantitative continuous data instead of ordinal (semi-quantitative) ones. Ordinal data obtained by visual scoring is fraught with problems due to subjectivity in interpretation, inter-observer variability, and poor reproducibility53. The promptness of the current analysis was improved by the fact that individuals without extensive histopathology background and programming expertise can perform automatic analysis, provided that the accuracy of annotations was checked by a pathologist. A study on head and neck tumors demonstrated QuPath's suitability for fast and reproducible assessment of the prognostic value of CD57+ tumor-infiltrating lymphocytes50. The study also showed a substantial concordance between human observers and QuPath. High concordance between manual observation and assessment using QuPath was also presented in oral cancer54 and breast cancer55. The aforementioned paper compared the IHC quantification of 5 clinical breast cancer biomarkers using QuPath and 2 commercial software products (Definiens Tissue Studio and inForm) with a manual scoring by a pathologist. Throughout this study, QuPath consistently exhibited the best performance as well as the least time to set up and apply, thus showing to be an excellent future alternative to visual monitoring and commercial software. Even compared to ImageJ, the best-known open-source software for biomedical image analysis, QuPath excels at dealing with large-size WSIs56.
There is an open online forum for QuPath where users post their questions about methods of digital pathology and present an active and engaged community to support the development of tools for image analysis (https://forum.image.sc/tag/qupath).
The cohort used in this study was unique and not representative of the general population with HCC because it encompassed only patients who were eligible for liver resection. Generally, a minority of patients with HCC (20%-30%) are eligible for liver resection57. This could also be a reason why fewer patients had confirmed cirrhosis because patients with this etiology of HCC probably had higher Child-Pugh scores and were not considered resectable. The cohort was also rather small, and most of the patients had an early TNM stages of the disease. Therefore, extrapolation of the results to other populations should be made with caution.
In the current study, the abundance of innate immune cells in the HCC microenvironment has been estimated through the assessment of their AF, as precise counting of irregularly shaped immune cells like dendritic cells can prove difficult. On the other hand, the area fraction of immune cells usually strongly correlates with their densities58. Immunoperoxidase labeling provides data for localization of the antigen, area fraction, or density of cells that express it, but the intensity of staining is non-linearly related to the amount of antigen. Therefore, IHC should not be used to quantitatively assess the expression level of a particular protein. The accuracy of the method also depends on the uniformity of section thickness, image quality, and selected resolution for pixel classification. Any results of image analysis should be validated and treated with caution. Since a single marker cannot fully capture the complexity of immune cells, more IHC markers and multiplex staining are needed to obtain a reliable picture of the immune TME of HCC. Using only a single IHC marker for phenotyping immune cells represents an approximation, and the results should be interpreted with caution.
Using the QuPath image analysis software to evaluate IHC-stained slides enabled us to assess the distribution and area fraction of local iDCs, mast cells, and NKs in tumor and peritumor of HCC patients and then to analyze their relationships with prognosis. The abundance of mast cells in the inner margin and peritumor liver of HCC is associated with longer DFS and OS, highlighting the anti-tumor effects of those innate immune cells. QuPath's analytical workflow is user-friendly, fast, and easy to use, with helpful default settings and easy data export. This software has been endorsed as a promising platform for digital image analysis, which could meet the need for reproducibility, consistency, and accuracy in digital pathology.
Disclosures
There are no financial conflicts of interest to disclose.
Acknowledgements
We acknowledge the contributions of Mgr. Ondřej Šebesta (Vinicna Microscopy Core Facility, Faculty of Science, Charles University) for whole slide scanning and the project "e-Infrastruktura CZ" (e-INFRA LM2018140), which supplied us with the computational resources for this study. Technicians Jana Dosoudilova and Jan Javurek are acknowledged for their excellent technical assistance. This research was funded by the European Union's Horizon 2020 research and innovation program, grant N°856620, and the Ministry of Health of the Czech Republic, grant AZV NU21-03-00506, and by the Cooperatio Program (Surgical disciplines). The Vinicna Microscopy Core Facility is co-financed by the Czech-BioImaging large RI project LM2023050.
Materials
| Name | Company | Catalog Number | Comments |
|---|---|---|---|
| Anti-CD1a | Leica Biosystems | PA0235 | Identifier- immature dendritic cells; RTU, Protocol F, ER2/20 min |
| Anti-CD117 | Leica Biosystems | PA0007 | Identifier- mast cells; RTU, Protocol F, ER2/20 min |
| BOND Plus Microscope Slides | Leica Biosystems, Germany | S21.2113.A | |
| BOND RXm | Leica Biosystems | 49.1501 | Fully Automated IHC Stainer |
| Bond Aspirating Probe Cleaning Kit | Leica Biosystems | CS9100 | |
| Bond Dewax Solution | Leica Biosystems | AR9222 | |
| Bond Polymer Refine Detection Kit | Leica Biosystems | DS9800 | |
| BondTM Epitope Retrieval 2 | Leica Biosystems | AR9640 | |
| BondTM Primary Antibody Diluent | Leica Biosystems | AR9352 | |
| BondTM Wash Solution 10X Concentrate | Leica Biosystems | AR9590 | |
| Computer Specifications: Intel(R) Core(TM) i5-10500 CPU @ 3.10GHz 3.10 GHz Installed RAM: 128 G | Intel | A 64-bit operating system that has Windows 7. Any computer with Java-based operating system and Excel available | |
| Coverslips | Leica Biosystems, Germany | 14071135636 | |
| CV Mount | Leica Biosystems, Germany | 14046430011 | |
| CV5030 Fully Automated Glass Coverslipper | Leica Biosystems | 149CVTS5025 | |
| Drying Oven UN30 | Memmert GmbH | UN30 | |
| GraphPad Prism 9.0 | GraphPad Software LLC | Version 12 | |
| Human NKp46/NCR1 Antibody, Monoclonal Mouse IgG2B Clone # 195314 | R&D Systems, Inc., United States | MAB1850 | Identifier- natural killer cells; Dilution 1:150, Protocol F + BLOK, ER2/20 min |
| Leica HI1210 - Water Bath | Leica Biosystems | 14041521466 | |
| Protein Block | Agilent Dako, United States | X0909 | |
| QuPath 0.3.2 or higher versions | version (QuPath v.0.3.2) | ||
| RM2235 Rotary Microtome | Leica Biosystems | 149AUTO00C1 | |
| ST5020 Multistainer Slide Stainer | Leica Biosystems | DEV-ST5010-CV5030 | |
| Statistica | StatSoft Inc. | version 7 | |
| Zeiss Axio Scan.Z1 | ScienceServices GmbH, Germany | 430038-9000-000 | Slide scanner |
References
- Du, M., Yin, Y. L., Xiao, L., Cai, Y. M., Ji, Y. Evaluating tumor-infiltrating lymphocytes in hepatocellular carcinoma using hematoxylin and eosin-stained tumor sections. World J Clin Cases. 10 (3), 856-869 (2022).
- Trailin, A., et al. T-and B-cells in the inner invasive margin of hepatocellular carcinoma after resection associate with favorable prognosis. Cancers (Basel). 14 (3), 604(2022).
- Xiao, N., et al. CD74+ macrophages are associated with favorable prognosis and immune contexture in hepatocellular carcinoma. Cancer Immunol Immunother. 71 (1), 57-69 (2022).
- Galon, J., et al. Type, density, and location of immune cells within human colorectal tumors predict clinical outcome. Science. 313 (5795), 1960-1964 (2006).
- Roxburgh, C. S. D., Salmond, J. M., Horgan, P. G., Oien, K. A., McMillan, D. C. Tumour inflammatory infiltrate predicts survival following curative resection for node-negative colorectal cancer. Eur J Cancer. 45 (12), 2138-2145 (2009).
- Klintrup, K., et al. Inflammation and prognosis in colorectal cancer. Eur J Cancer. 41 (17), 2645-2654 (2005).
- Kather, J. N., et al. Topography of cancer-associated immune cells in human solid tumors. Elife. 7, e36967(2018).
- Cho, J. Basic immunohistochemistry for lymphoma diagnosis. Blood Res. 57 (S1), 55-61 (2022).
- Bankhead, P., et al. QuPath: Open source software for digital pathology image analysis. Sci Rep. 7 (1), 16878(2017).
- Kolinko, Y., et al. Using virtual microscopy for the development of sampling strategies in quantitative histology and design-based stereology. Anat Histol Embryol. 51 (1), 3-22 (2022).
- Rodrigues, A., et al. Computer-assisted tumor grading, validation of PD-L1 scoring, and quantification of CD8-positive immune cell density in urothelial carcinoma, a visual guide for pathologists using QuPath. Surg Exp Pathol. 5, 12(2022).
- Hein, A. L., et al. QuPath digital immunohistochemical analysis of placental tissue. J Pathol Inform. 12, 40(2021).
- Lichterman, J. N., Reddy, S. M. Mast cells: A new frontier for cancer immunotherapy. Cells. 10 (6), 1270(2021).
- Veglia, F., Gabrilovich, D. I. Dendritic cells in cancer: the role revisited. Curr Opin Immunol. 45, 43-51 (2017).
- Wu, S. -Y., Fu, T., Jiang, Y. -Z., Shao, Z. -M. Natural killer cells in cancer biology and therapy. Mol Cancer. 19 (1), 120(2020).
- Kai, K., et al. Immunohistochemical analysis of the aggregation of CD1a-positive dendritic cells in resected specimens and its association with surgical outcomes for patients with gallbladder cancer. Transl Oncol. 14 (1), 100923(2021).
- Minesaki, A., Kai, K., Kuratomi, Y., Aishima, S. Infiltration of CD1a-positive dendritic cells in advanced laryngeal cancer correlates with unfavorable outcomes post-laryngectomy. BMC Cancer. 21 (1), 973(2021).
- Komi, D. E. A., Redegeld, F. A. Role of mast cells in shaping the tumor microenvironment. Clin Rev Allergy Immunol. 58 (3), 313-325 (2020).
- Maltby, S., Khazaie, K., McNagny, K. M. Mast cells in tumor growth: Angiogenesis, tissue remodelling and immune-modulation. Biochim Biophys Acta. 1796 (1), 19-26 (2009).
- Gooch, J. L., Lee, A. V., Yee, D. Interleukin 4 inhibits growth and induces apoptosis in human breast cancer cells. Cancer Res. 58 (18), 4199-4205 (1998).
- Brockmeyer, P., et al. High mast cell density indicates a longer overall survival in oral squamous cell carcinoma. Sci Rep. 7 (1), 14677(2017).
- Lee, H. A., et al. Natural killer cell activity is a risk factor for the recurrence risk after curative treatment of hepatocellular carcinoma. BMC Gastroenterol. 21 (1), 258(2021).
- Shimasaki, N., Jain, A., Campana, D. NK cells for cancer immunotherapy. Nat Rev Drug Discov. 19 (3), 200-218 (2020).
- Barrow, A. D., Martin, C. J., Colonna, M. The natural cytotoxicity receptors in health and disease. Front Immunol. 10, 909(2019).
- Guan, X., et al. Tumor-associated NK cells facilitate tumor growth via NKp46 in immunocompetent murine hepatocellular carcinoma. Immunol Lett. 258, 8-19 (2023).
- Ali, E., et al. Prognostic role of macrophages and mast cells in the microenvironment of hepatocellular carcinoma after resection. BMC Cancer. 24 (1), 142(2024).
- Lin, C., et al. Tryptase expression as a prognostic marker in patients with resected gastric cancer. Br J Surg. 104 (8), 1037-1044 (2017).
- Hempel, H. A., et al. Low intratumoral mast cells are associated with a higher risk of prostate cancer recurrence. Prostate. 77 (4), 412-424 (2017).
- Rohr-Udilova, N., et al. Morphometric analysis of mast cells in tumor predicts recurrence of hepatocellular carcinoma after liver transplantation. Hepatol Commun. 5 (11), 1939-1952 (2021).
- Lin, S. Z., et al. Prediction of recurrence and survival in hepatocellular carcinoma based on two cox models mainly determined by FoxP3+ regulatory T cells. Cancer Prev Res. 6 (6), 594-602 (2013).
- Jia, Q., Wang, A., Yuan, Y., Zhu, B., Long, H. Heterogeneity of the tumor immune microenvironment and its clinical relevance. Exp Hematol Oncol. 11 (1), 24(2022).
- Pyo, J. -S., Son, B. K., Lee, H. Y., Oh, I. H., Chung, K. H. Prognostic implications of intratumoral and peritumoral infiltrating lymphocytes in pancreatic ductal adenocarcinoma. Curr Oncol. 28 (6), 4367-4376 (2021).
- Yusa, T., et al. Survival impact of immune cells infiltrating peritumoral area of hepatocellular carcinoma. Cancer Sci. 113 (12), 4048-4058 (2022).
- Halama, N., et al. Localization and density of immune cells in the invasive margin of human colorectal cancer liver metastases are prognostic for response to chemotherapy. Cancer Res. 71 (17), 5670-5677 (2011).
- Zwing, N., et al. Analysis of spatial organization of suppressive myeloid cells and effector T cells in colorectal cancer-A potential tool for discovering prognostic biomarkers in clinical research. Front Immunol. 11, 550250(2020).
- Soeratram, T. T. D., et al. Prognostic value of T-cell density in the tumor center and outer margins in gastric cancer. Mod Pathol. 36 (9), 100218(2023).
- Gonzàlez-Farré, M., et al. Characterization and spatial distribution of the immune cell infiltrate in triple-negative breast cancer: a novel classification based on plasma cells and CD8+ T cells. Hum Pathol. 139, 91-105 (2023).
- Hendry, S., et al. Assessing tumor-infiltrating lymphocytes in solid tumors: A practical review for pathologists and proposal for a standardized method from the International Immunooncology Biomarkers Working Group: Part 1: Assessing the host immune response, TILs in invasive breast carcinoma and ductal carcinoma in situ, metastatic tumor deposits and areas for further research. Adv Anat Pathol. 24 (5), 235-251 (2017).
- Brück, O., et al. Spatial immunoprofiling of the intratumoral and peritumoral tissue of renal cell carcinoma patients. Mod Pathol. 34 (12), 2229-2241 (2021).
- Knebel, M., et al. Prognostic impact of intra- and peritumoral immune cell subpopulations in head and neck squamous cell carcinomas - comprehensive analysis of the TCGA-HNSC cohort and immunohistochemical validation on 101 patients. Front Immunol. 14, 1172768(2023).
- Lee, S., et al. Interactive classification of whole-slide imaging data for cancer researchers. Cancer Res. 81 (4), 1171-1177 (2021).
- Ciga, O., et al. Overcoming the limitations of patch-based learning to detect cancer in whole slide images. Sci Rep. 11 (1), 8894(2021).
- Rizzardi, A. E., et al. Quantitative comparison of immunohistochemical staining measured by digital image analysis versus pathologist visual scoring. Diagn Pathol. 7, 42(2012).
- Masuda, S., Nakanishi, Y. Application of immunohistochemistry in clinical practices as a standardized assay for breast cancer. Acta Histochem Cytochem. 56 (1), 1-8 (2023).
- Matsutani, S., et al. Tumor-infiltrating immune cells in H&E-stained sections of colorectal cancer tissue as a reasonable immunological biomarker. Anticancer Res. 38 (12), 6721-6727 (2018).
- Väyrynen, J. P., et al. Prognostic significance of immune cell populations identified by machine learning in colorectal cancer using routine hematoxylin and eosin-stained sections. Clin Cancer Res. 26 (16), 4326-4338 (2020).
- Zhou, G., et al. Clinical significance of tumor-infiltrating lymphocytes investigated using routine H&E slides in small cell lung cancer. Radiat Oncol. 17 (1), 127(2022).
- Horny, H. -P., Sotlar, K., Valent, P. Mastocytosis. Immunol Allergy Clin North Am. 34 (2), 315-321 (2014).
- Mi, H., Ho, W. J., Yarchoan, M., Popel, A. S. Multi-scale spatial analysis of the tumor microenvironment reveals features of cabozantinib and nivolumab efficacy in hepatocellular carcinoma. Front Immunol. 13, 892250(2022).
- de Ruiter, E. J., et al. Assessing the prognostic value of tumor-infiltrating CD57+ cells in advanced stage head and neck cancer using QuPath digital image analysis. Virchows Archiv. 481 (2), 223-231 (2022).
- Fanucci, K. A., et al. Image analysis-based tumor infiltrating lymphocytes measurement predicts breast cancer pathologic complete response in SWOG S0800 neoadjuvant chemotherapy trial. NPJ Breast Cancer. 9 (1), 38(2023).
- Acs, B., et al. Ki67 reproducibility using digital image analysis: an inter-platform and inter-operator study. Lab Invest. 99 (1), 107-117 (2019).
- Sobottka, B., et al. Establishing standardized immune phenotyping of metastatic melanoma by digital pathology. Lab Invest. 101 (12), 1561-1570 (2021).
- Moratin, J., et al. Digital pathology scoring of immunohistochemical staining reliably identifies prognostic markers and anatomical associations in a large cohort of oral cancers. Front Oncol. 11, 712944(2021).
- Bankhead, P., et al. Integrated tumor identification and automated scoring minimizes pathologist involvement and provides new insights to key biomarkers in breast cancer. Lab Invest. 98 (1), 15-26 (2018).
- Humphries, M. P., Maxwell, P., Salto-Tellez, M. QuPath: The global impact of an open source digital pathology system. Comput Struct Biotechnol J. 19, 852-859 (2021).
- Koh, J. H., et al. Liver resection versus liver transplantation for hepatocellular carcinoma within Milan criteria: a meta-analysis of 18,421 patients. Hepatobiliary Surg Nutr. 11 (1), 78-93 (2022).
- Eriksen, A. C., et al. Computer-assisted stereology and automated image analysis for quantification of tumor infiltrating lymphocytes in colon cancer. Diagn Pathol. 12 (1), 65(2017).
Reprints and Permissions
