This protocol illustrates a method for optogenetic stimulation of intrinsic cardiac neurons in transgenic mouse hearts. The approach described is used for investigating the kinetics of sudden cardiac neuron activation in ex vivo perfused hearts and the interactions between cholinergic and catecholaminergic activity.
Method Article
Optogenetic Activation of Intrinsic Cardiac Autonomic Neurons in Excised Perfused Mouse Hearts
In This Article
Summary
Abstract
A balance of cholinergic and catecholaminergic activation is necessary to maintain heart health. Interrogating the interaction between these pathways can be done using optogenetics through selective expression of channelrhodopsin-2 (ChR2) in cardiac autonomic neurons. Such cardiac applications of optogenetics allow for the study of the intrinsic release of neurotransmitters in a spatiotemporal manner. This method illustrates an ex vivo approach for specific optogenetic stimulation of cardiac neurons in perfused mouse hearts. Transgenic mice were bred to express ChR2 in either choline acetyltransferase (ChAT) or tyrosine hydroxylase (TH) neurons throughout the body. A micro-LED (465 nm) encased in a silicone elastomer was prepared for stimulating the neurons of the right atrium that innervate the sinoatrial node. The micro-LED was connected to a function generator set to pulse waves at 10 Hz with a 30 ms pulse width. Hearts with confirmed expression were excised and retrogradely perfused on a Langendorff system circulating Krebs-Henseleit solution. Electrocardiogram (ECG), temperature, and coronary flow rate were recorded using the LabChart software. Once the heart stabilized, the micro-LED was placed on the right atrium and tested for optimal heart rate response. An application of this approach combines the intrinsic release of cholinergic neurotransmitter (acetylcholine) during optogenetic activation of a ChAT-ChR2 mouse heart simultaneously with increasing exogenous catecholaminergic neurotransmitter (norepinephrine) added to the perfusate. The resulting changes in heart rate during the simultaneous cholinergic and catecholaminergic activation are presented. This method describes a valuable experimental approach for investigating the kinetics of sudden intrinsic autonomic neuron activation in perfused hearts and the interactions between cardiac cholinergic and catecholaminergic activity.
Introduction
Optogenetics is a method to introduce light-sensitive proteins (opsins) into targeted cell populations. This enables spatiotemporal modulation of specific cells and tissues that cannot be achieved using electrical or chemical means1. Cardiac applications of optogenetics have become increasingly popular over the past 15 years2. Photostimulation of excitatory opsins such as channelrhodopsin-2 (ChR2), a cation, in cardiac myocytes or neurons results in cellular depolarization, causing changes in heart rhythm3. There are two ways to selectively express opsins in cell populations using the Cre-lox approach: viral transduction4 and crossbreeding transgenic animals5. Selective expression of ChR2 in specific autonomic neurons can be accomplished by crossbreeding to create offspring that express ChR2 in either cholinergic or catecholaminergic neurons using cell-specific promoters6. One parent with a floxed ChR2 gene can be mated with a parent that expresses Cre recombinase under the control of a promoter such as tyrosine hydroxylase (TH, catecholaminergic neurons) or choline acetyltransferase (ChAT, cholinergic neurons). Offspring then expresses ChR2 in either TH or ChAT neurons throughout the body7.
The functional response of the heart to acute activation of autonomic neurons can be investigated using promoter-driven expression of ChR2 within specific neuronal populations, for example cholinergic or catecholaminergic neurons. Photostimulation pulse interval and intensity can be varied to control the depolarization rate of those ChR2-expressing neurons to study how levels of neural activation modulate cardiac function8. For this method, neurons will be used to refer to any cell bodies, axons, and/or axonal projections that are optogenetically activated for simplicity. It is also possible to combine photostimulation with chemical activation by the introduction of drugs or neurotransmitters to interrogate simultaneous effects on heart rhythm and contractility9. For example, optogenetic cholinergic stimulation can be combined with the injection of exogenous norepinephrine (NE) to examine the impact of concurrent autonomic activation in the heart. Conducting such studies using isolated perfused hearts has the advantage of providing a well-controlled experimental platform to study functional changes caused by photoactivation10. Changes in ECG morphology, heart rate, and coronary flow rate can be monitored while temperature, oxygenation, and perfusion pressure are tightly controlled.
The objective of this protocol is to present an experimental approach to activate a specific population of autonomic neurons in mouse hearts to study changes in heart rate. The construction and usage of a micro-LED device for optogenetic activation in perfused hearts is also presented. Hearts from mice expressing ChR2 in cholinergic or catecholaminergic neurons were excised and retrogradely perfused with an oxygenated Krebs-Henseleit solution at constant pressure. ChR2 expressed in the neurons of the right atrium (RA) were photostimulated at a pulse rate of 10 Hz with a 30 ms pulse width. Instantaneous heart rate was calculated using the RR interval and monitored for changes during photostimulation. An example experiment to study heart rate kinetics during intrinsic optogenetic ChAT neuron photostimulation simultaneously with beta-adrenergic activation using exogenous norepinephrine is also described.
Protocol
All animal protocols were approved by the George Washington University's Animal Care and Use Committee and followed the National Institute of Health's Guide for the Care and Use of Laboratory Animals.
1. Micro-LED light source construction
- Under a dissecting microscope in a well-ventilated area, solder the stripped ends of two insulated copper wires, at least 20 cm in length, to the contact points of a 465 nm micro-LED (Figure 1). Test the soldering by connecting the LED to a power source and turning it on.
- Cut the bottom 1 cm of a 200 µL filtered pipette tip. Push the filter out using a small-diameter rod. Insert the micro-LED with wires into the pipette tip so that the LED is flush with the end of the tip. Replace the filter at the top of the pipette tip to hold the LED and wires in place, and then superglue the edges of the LED to the pipette tip. Allow the superglue to dry.
- Prepare silicone elastomer by combining the base and curing agent in a ratio of 10:1 and mix well. Remove any bubbles from the mixture using a vacuum chamber or by centrifuging.
- Take a 0.5 mL centrifuge tube and score the sides to make removal of the LED easier (lubricant can also be added to the inside of the tube here if desired). Tape the outside of the tube to ensure no leaking. Pour approximately 0.2 mL of the silicon elastomer mixture into the tube and then place the micro-LED pipette tip into the tube, leaving at least 1 mm of space between the LED and the bottom of the tube. If bubbles have formed, tap the centrifuge tube on a hard surface to dislodge them.
NOTE: The pipette tip can be preemptively coated in silicone elastomer to reduce bubble formation when placing the LED. - Place the centrifuge tube micro-LED upright in a 50 °C lab oven or incubator and leave for at least 8 h or overnight. Wear heat-resistant gloves when interacting with the oven. Once the elastomer is hardened, remove the LED from the centrifuge tube. If the elastomer is still tacky, place it back in the oven.
- Once fully cured, remove any excess elastomer from the tip of the LED with a precision utility knife, leaving no more than 1 mm. Proper encapsulation of the LED will minimize the heating of the tissue during photostimulation.
- Determine the LED's optical power using an optical power meter. Turn on the power meter and adjust the wavelength settings to read 465 nm. Place the LED in line with a photodiode power sensor and turn the LED on with the function generator. The optical power meter will produce a reading in watts. Calculate irradiance by dividing the power reading by the area of the illuminated surface (0.88 mm2).
NOTE: Ideal irradiance should be approximately 2.4 mW/mm2 for appropriate activation of ChR211.
2. Experimental preparation
- Breed mice in accordance with previous publication to express ChR2 in either cholinergic neurons (ChAT-ChR2) or catecholaminergic neurons (TH-ChR2)12 (Figure 2). Confirm expression of TH-Cre or ChAT-Cre in mice used for experiments using a genotyping approach as described previously12.
- Prepare at least 225 mL of Krebs-Henseleit (KH) solution (in mM: 118 NaCl, 4.7 KCl, 1.25 CaCl2, 0.57 MgSO4, 25 NaHCO3, 1.17 KH2PO4, 6 glucose) and filter using 0.2 µm cellulose nitrate membrane filter. Adjust pH to 7.4 when oxygenated using 95% O2 and 5% CO2.
- Rinse the Langendorff perfusion system with purified water prior to the experiment and remove any excess water before beginning the experiment.
- Add a 10 µm membrane filter to the system before any KH is circulated. Turn on the water baths set to maintain perfusate temperature at 37 °C at flow rates between 2-5 mL/min.
- Add 175 mL of KH to the perfusion system and begin circulation. Bubble the solution with 95% O2 / 5% CO2 to provide adequate oxygenation.
NOTE: KH circulating volume will vary from system to system depending on tubing and reservoir sizes. - Calibrate the flow meter by halting flow through the perfusion system with a stopcock and pressing the Zero Button on the flow meter.
- Prepare a physiological data acquisition software such as LabChart to have 12 channels: heart bath temperature, aortic perfusate temperature, ECG leads I-III plus four additional computed leads, heart rate calculation, flow rate, and function generator output to track LED pulses.
- Using the channel reserved for heart rate, calculate heart rate in LabChart with the cyclic measurements feature set to detect mouse ECG on Lead I. LabChart's Cardiac Axis extension uses Lead I and Lead II to calculate Lead III, aVR, aVL, and aVF.
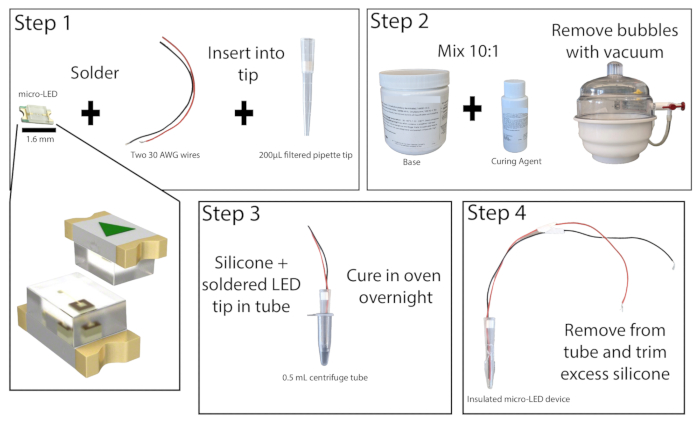
Figure 1: Micro-LED construction. Simplified overview of steps for constructing micro-LED light source. Two wires are soldered to the micro-LED and inserted into a 200 µL pipette tip, then superglued (Step 1). Silicone elastomer is mixed at a 10:1 ratio and placed in a vacuum chamber to remove bubbles (Step 2). The silicone elastomer is poured into a microcentrifuge tube, and the micro-LED pipette tip is inserted and allowed to cure overnight (Step 3). The insulated micro-LED is then removed from the tube, and excess silicone should be trimmed (Step 4). Please click here to view a larger version of this figure.
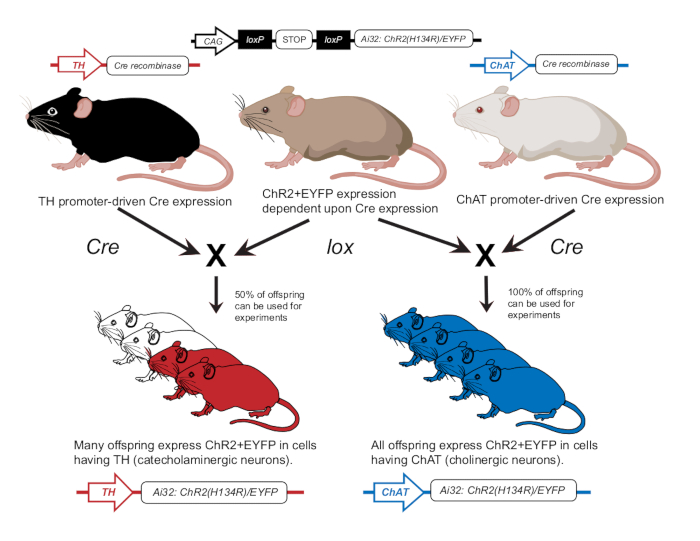
Figure 2: Transgenic mouse breeding scheme. A parent mouse with the lox-dependent ChR2 gene is crossbred with another mouse with a Cre promoter. A parent mouse with tyrosine hydroxylase (TH) Cre promoter will produce heterozygous offspring where 50% will express ChR2 in catecholaminergic cells. A parent mouse with choline acetyltransferase (ChAT) Cre promoter will produce homozygous offspring where 100% will express ChR2 in cholinergic cells. Expression is confirmed via genotyping. This figure has been modified with permission from12. Please click here to view a larger version of this figure.
3. Heart excision and perfusion
- Prior to excision, administer 250 units of heparin (approximately 8 U/g) by intraperitoneal injection using a 1 mL syringe. Wait at least 10 minutes before continuing the procedure.
- Place an adult mouse in an anesthesia induction chamber. Administer ~4% isoflurane and wait till the respiration rate slows and deepens. Remove the mouse from the chamber and verify the cessation of a pain reflex by toe pinch before performing cervical dislocation.
- Hold the xiphoid process with a pair of forceps and cut into the abdominal cavity using surgical scissors. Open the thoracic cavity by carefully cutting through the diaphragm. Cut through the ribs to expose the heart and lungs. Gently grab the lungs and excise the heart and lungs.
- Place the heart into a dish of heparinized KH. Remove the lungs and any large pieces of fat. Place the cleaned heart into a 2nd dish of heparinized KH under a dissecting microscope set to 2x magnification. Locate aorta and slide it over the cannula using fine forceps. Secure the heart to a cannula using 4-0 silk suture.
NOTE: Cannulation can be done over ice to reduce the metabolic activity of the heart. - Flush a bolus injection of heparinized KH through the cannula to remove blood from the coronaries before being placed on the perfusion system.
- Connect the cannulated heart to the perfusion system and place it in the PDMS dish filled with perfusate. Place ECG needle electrodes into the PDMS dish according to Einthoven's triangle13. Acclimate the heart for at least 5 min.
- Rotate the heart so that the left atrium is accessible and cut a ~1 mm hole in the left atrium with a pair of micro self-opening scissors. Insert a 1 mm diameter tube through this slice into the left ventricle to release perfusate trapped there.
NOTE: Having a dissecting microscope to look at the heart may improve the ease of this step. - Rotate the heart so that the RA is facing up, and the sinoatrial (SA) node is accessible for illumination (Figure 3).
- Adjust ECG electrodes as needed by moving electrodes closer to the heart or submerging them in perfusate to receive the signals with a suitable signal-to-noise ratio. Settings may vary based on ECG acquisition hardware and software being used. This method used an Einthoven Goldberger module with a gain of 2000 and a 500 Hz cut-off filter, and software settings included a mains filter and a 1000 Hz sampling frequency.
4. Optogenetic activation
- Connect the micro-LED device to a function generator set to produce pulse waves at the following parameters: 10 Hz frequency, 30 ms pulse width, 10Vpp amplitude.
- Place the micro-LED gently on the SA node. Avoid pressing too hard with the micro-LED as it may result in decreases in heart rate and function.
- Turn on the function generator and gauge changes in heart rate from photostimulation. Immediate changes in heart rate indicate effective activation. Catecholaminergic activation causes an exponential rise in heart rate10, while cholinergic activation causes an immediate drop8.
- Turn off the function generator. Allow heart rate to return to pre-activation levels.
- If optogenetic activation results in a heart rate change of less than 100 bpm, reposition the micro-LED to better illuminate neurons of the RA. Repeat as necessary.
5. Experimental procedure and data analysis
- To test the hypothesis that intrinsic optogenetic cholinergic stimulation can suppress exogenous beta-adrenergic activation by norepinephrine (NE), prepare 10 µM and 100 µM stock solutions of NE in a fume food.
- Add a bolus dose of NE to the perfusion system by an injection port. Once the heart rate increase plateaus, turn on micro-LED for ~10 s. Turn the light off and monitor changes in heart rate.
- After the heart rate returns to sinus rhythm, increase the dose of NE and repeat optogenetic stimulation. Continue for each dose of NE.
- At the end of the study, turn off the gas supplies, remove the heart from the system, and preserve it in fixative, as necessary.
- Rinse the perfusion system reservoirs and tubing with DI water or detergent as needed. Dry the system thoroughly to prevent mildew.
- Save the LabChart file. Export the heart rate signal and ECG channels for offline analysis and graphical presentation.
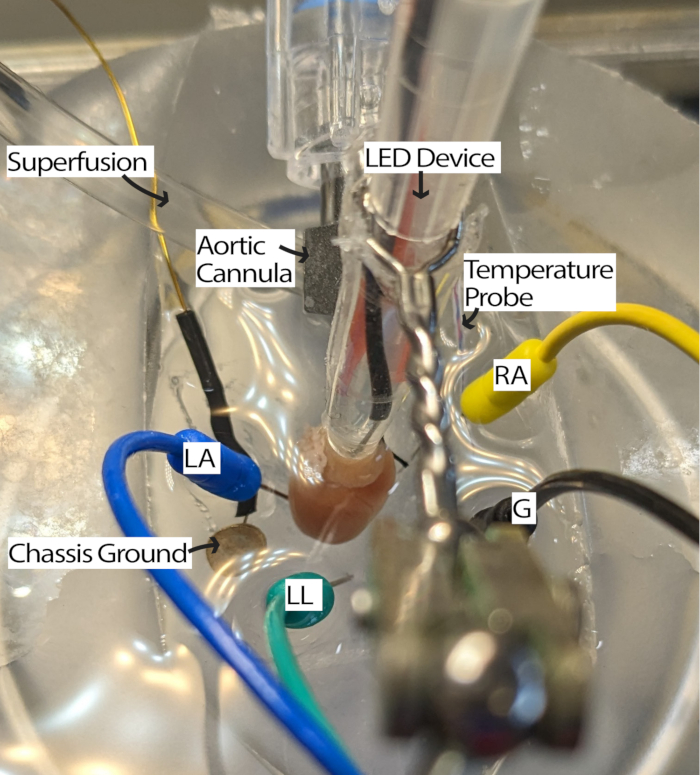
Figure 3: Mouse heart bath configuration. A cannulated mouse heart showing placement of LED device and ECG electrodes. A chassis ground is present to reduce noise from surrounding electronics. ECG needle electrodes are placed based on Einthoven's triangle. Abbreviations: LA = left arm; RA = right arm; LL = left leg; G = ground. Please click here to view a larger version of this figure.
Results
A Langendorff constant pressure perfusion system (Figure 4) should be able to maintain mouse heart rates of at least 300 bpm for well over an hour if appropriate oxygenation, temperature, and coronary flow are sustained. With this setup, aortic perfusate temperature relies on coronary flow, so water bath temperatures may need to be adjusted as the flow rate changes to maintain the aortic temperature at 37 °C. Mouse heart coronary flow rates typically range from 1.5-4.5 mL/min, depending on the size of the heart. Maintaining perfusate temperature at 37 °C during flow rate fluctuations is necessary for consistent heart function and is especially important for constant pressure perfusion. The perfusion system described is designed to maintain a hydrostatic pressure of 70 mmHg through the perfusate column height. This is accomplished with a pump rate that provides consistent overflow from the top reservoir. The perfusate can be supplemented with 20 µM of the vasodilator cromakalin to improve and maintain normal or supranormal coronary flow to ensure complete myocardial oxygenation14.
Photostimulation of cholinergic neurons in ChAT-ChR2 mouse hearts at 10 Hz and 30 ms pulse width should result in a nearly instantaneous drop in heart rate. Efficient photostimulation of cholinergic neurons in adequately perfused hearts should lead to a reduction in heart rate of at least 100 bpm. Figure 5 shows an immediate drop of 75 bpm when the micro-LED is turned on that continues to drop until it reaches a maximum decrease of 135 bpm. Within half a second of turning off the micro-LED, the heart rate increases to 175 bpm before gradually returning to pre-stimulation levels. A six-lead ECG is presented to illustrate the differences in RR interval before, during, and after stimulation (Figure 5B). Leads aVR, aVL, and aVF are calculated in the LabChart software using Leads I and II.
Photostimulation of catecholaminergic neurons in TH-ChR2 mouse hearts causes a more gradual (exponential) change in heart rate compared to photostimulation of cholinergic neurons. This is likely caused by beta1-adrenergic activation requiring the second messenger system of cAMP activating PKA, which phosphorylates target proteins, whereas muscarinic activation does not. Figure 6 demonstrates a 135 bpm heart rate increase over the course of 10 s. An additional 10 s is needed after the light is turned off to return to normal sinus rhythm. If the micro-LED is not properly insulated, it may heat the heart, causing an increase in heart rate. This heating response is less intense than TH-ChR2 stimulation; therefore, the change in heart rate is less pronounced.
One application of this protocol is to use optogenetic stimulation to depolarize neurons, leading to the release of endogenous neurotransmitters while simultaneously adding exogenous neurotransmitters to the perfusate. Figure 7A illustrates endogenous acetylcholine release from a ChAT-ChR2 mouse heart with a bolus dose of NE added to the perfusate. Without NE present, photostimulation caused the heart rate to drop more than 100 bpm and maintained this drop for the duration of stimulation. Whereas with a large dose of NE (2000 nM), the maximum heart rate drop during photostimulation was 40 bpm. The heart rate immediately began rising, almost reaching pre-stimulation levels before the light was turned off. This result indicates that optogenetic suppression of heart rate by ChAT neuron photostimulation was unable to fully suppress increases in heart rate resulting from a high dose of NE, causing shorter time of heart rate suppression and lower decreases in heart rate (Figure 7B). These results are consistent with prior work in large animals that demonstrated progressive AV node block during simultaneous vagal nerve and stellate ganglia stimulation12,13.
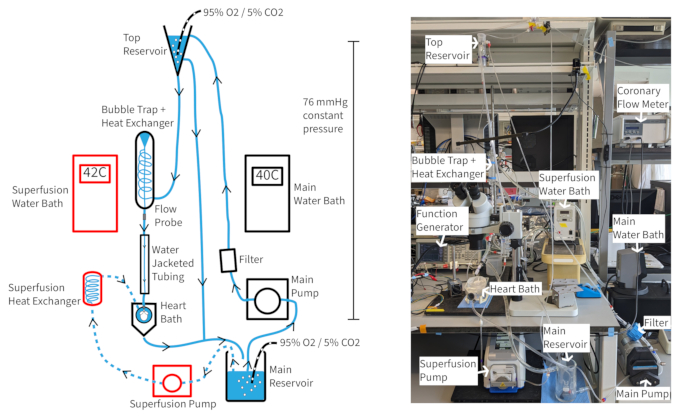
Figure 4: Experimental setup. Diagram of perfusion system. Arrows show the direction of perfusate. Superfusion perfusate is indicated by dashed lines and components are red outlined. Please click here to view a larger version of this figure.
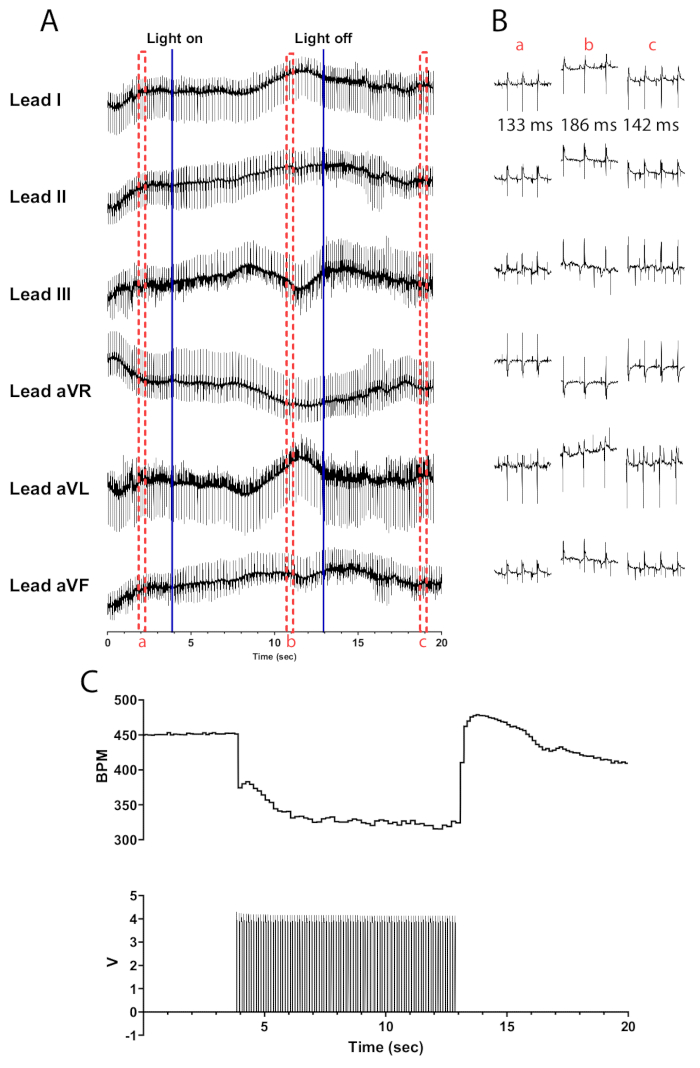
Figure 5: Representative cholinergic photostimulation response. (A) A 6 lead ECG during ChAT-ChR2 optogenetic activation. Solid blue lines indicate the micro-LED being turned on/off. Red dashed boxes indicate the time for (B) snippets. (B) Half-second snippets of ECG signal before (a), during (b), and after photostimulation (c). RR interval is shown for each section. (C) Heart rate (top) is shown along with pulse waves from a function generator (bottom). The heart rate starts at 450 bpm and drops to 315 bpm after 8 s of photostimulation before returning to 410 bpm 7 s after photostimulation ends. Please click here to view a larger version of this figure.
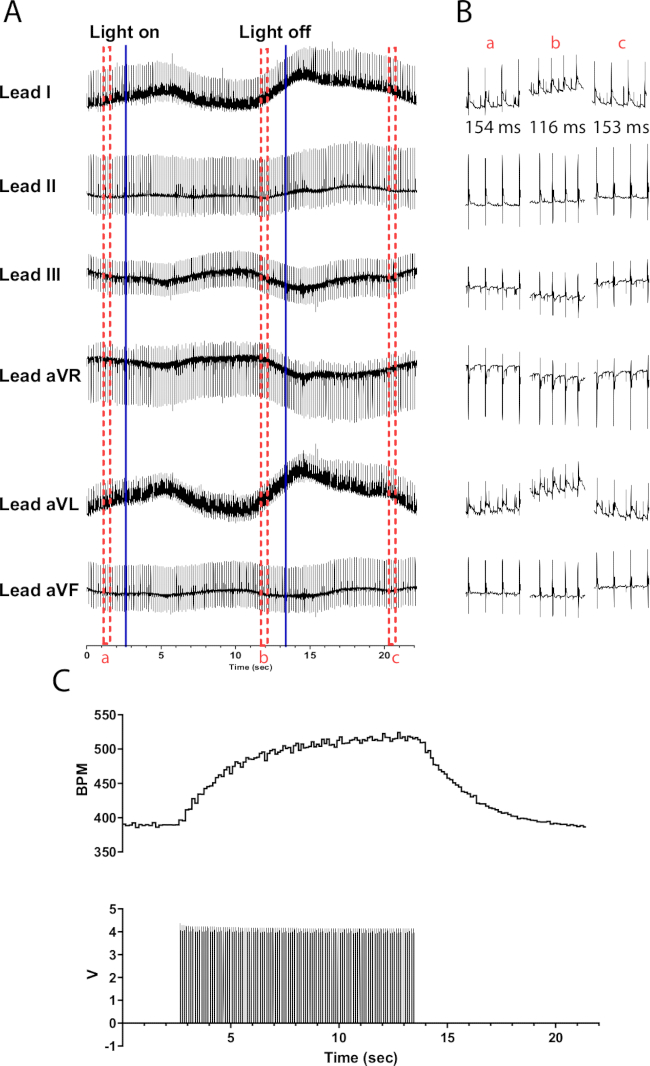
Figure 6: Representative catecholaminergic photostimulation response. (A) A 6 lead ECG during TH-ChR2 optogenetic activation. Solid blue lines indicate the micro-LED being turned on/off. Red dashed boxes indicate the time for (B) snippets. (B) Half-second snippets of ECG signal before (a), during (b), and after photostimulation (c). RR interval is shown for each section. (C) Heart rate (top) is shown along with pulse waves from a function generator (bottom). The heart rate starts at 390 bpm and peaks to 525 bpm after 10 s of photostimulation before returning to 390 bpm 8 s after photostimulation ends. Please click here to view a larger version of this figure.
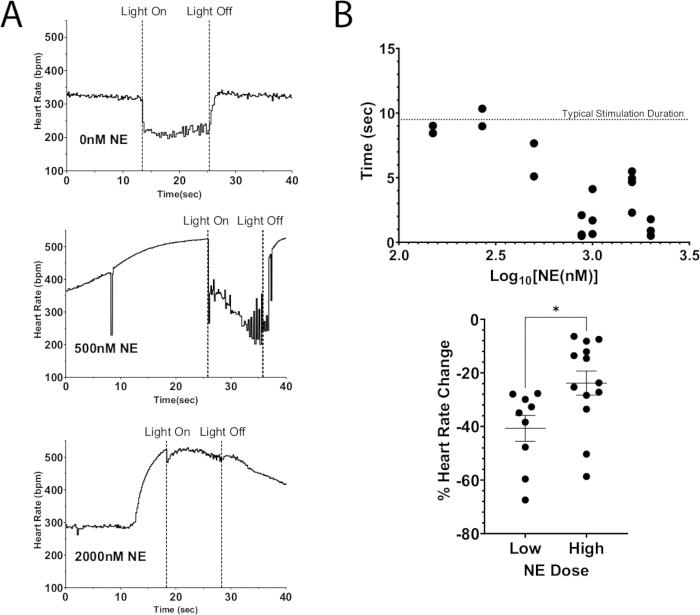
Figure 7: Cholinergic photostimulation with exogenous NE. (A) Heart rate response during ChAT-ChR2 photostimulation with increasing doses of NE added to perfusate. Once the heart rate reached a maximum increase due to NE, the micro-LED was turned on for approximately 10 s. Heart rate suppression was still possible at high doses of NE, but the duration of stimulation decreased as the dose increased. (B) The amount of time the heart rate stayed suppressed. Times closer to 10 s generally stayed suppressed for the full duration of stimulation. (C) The drop in heart rate during photostimulation was less severe at higher doses of NE than at low doses. Low doses resulted in an average decrease in heart rate of 40%, while higher doses only dropped 25%. An unpaired t-test was performed to assess statistical significance. Presented as standard error of the mean * p < 0.05. Please click here to view a larger version of this figure.
Discussion
Optogenetic stimulation of intrinsic cardiac autonomic neurons produced comparable levels of heart rate response as electrical stimulation of the vagus nerve or stellate ganglia14,15. Electrical stimulation of excised perfused hearts, however, lacks the advantage of being able to easily target specific neuron populations. Pharmacologic activation offers the benefit of targeting specific receptors but has no spatial specificity, and the response time is dependent upon coronary flow rate. Optogenetic activation provides the benefit of near-instantaneous response, the targeting of neuronal populations, and the ability to change the level of photostimulation16. In this protocol, we have also explained how to construct a simple, low-cost light source for photostimulating the intrinsic cardiac neurons.
Developing a further understanding of the impact of the intracardiac nervous system will facilitate better diagnosis and treatment of cardiovascular disease. Selective expression of ChR2 enables new hypotheses related to the activity of specific nerve populations during disease to be tested. Nerve populations throughout the heart could be interrogated this way, such as intrinsic cardiac ganglia around the pulmonary veins or throughout the ventricles. For example, in mouse models of myocardial infarction, photostimulation of intrinsic autonomic neurons could be useful for interrogating electrophysiological changes in border zone tissue as the infarct evolves and neurons undergo transdifferentiation17. In this protocol, we describe another example involving controlled experiments of acute cardiac responses to simultaneous activation of cholinergic and catecholaminergic pathways where the combination of optogenetic and pharmacological agents allows unique dose responses to be examined. This concurrent activation is a phenomenon associated with drowning, known as autonomic conflict, which has yet to be fully elucidated18. Additionally, given appropriate light, dye, and filter combinations, this protocol can be combined with cardiac optical mapping to study the acute effects of autonomic neuron stimulation on cardiac electrophysiology and neuro-cardiac arrhythmia mechanisms19,20,21.
There are several important concepts to be considered when using this protocol to study the intrinsic cardiac nervous system in excised perfused hearts. Mouse hearts are sensitive to slight changes in the perfusion environment. Closely monitoring heart rate is useful to identify problems with coronary perfusion that may cause low oxygenation of the myocardium, ischemia, and poor heart function. The protocol recommends oxygenating the perfusate at both the main and top reservoir to limit potential issues. Fully submerging the oxygenation tubing helps to guarantee optimal oxygen levels in the perfusate. An ultraviolet flashlight can be shone on the heart to reveal NADH fluorescence indicating hypoxia/ischemia, and oxygenation can be adjusted accordingly19,20. Perfusate temperature is dependent on coronary flow rate during constant pressure perfusion. If the coronary flow rate drops, the aortic perfusate temperature may also drop due to cooling in the tubing proximal to the aortic cannula, resulting in a lower heart rate. Increasing the perfusate water bath temperature can help reverse this issue. This protocol also utilizes a superfusion loop to maintain a heart bath temperature of 37 °C. Drops in heart bath temperature may require that the superfusion flow rate be increased. The micro-LED is another source of potential changes in heart temperature because the temperature of the RA could increase during photostimulation. If the silicone elastomer that encases the device is too thin, then the micro-LED may get warm and heat the SA node, resulting in an unexpected increase in heart rate. Testing the micro-LED light source on a wild type heart can be useful to gauge heating levels. The micro-LED should not cause a heart rate increase of more than 10% over 30 s. If this occurs, the silicone elastomer should be replaced.
The goal of ex vivo perfused heart experiments is to recreate near physiological conditions with controllable variables, but they come with limitations22. Crystalloid perfusate is the standard for these experiments; however, it can limit oxygen delivery to the mitochondria under high-stress conditions23,24. Furthermore, the perfusate lacks circulating hormones that would occur naturally in vivo. An additional limitation is that variable light intensity and placement of the micro-LED can result in local disparities in neural stimulation, so some adjustments in positioning the micro-LED above the heart are always required before beginning an experimental protocol.
In summary, this protocol illustrates an ex vivo approach for specific optogenetic stimulation of cardiac neurons in perfused mouse hearts. A micro-LED light source was constructed to stimulate the neurons of the right atrium. An application of this approach combined the intrinsic release of acetylcholine during optogenetic activation of a ChAT-ChR2 mouse heart simultaneously with increasing exogenous NE. The resulting changes in heart rate during the simultaneous catecholaminergic and cholinergic activation were presented. This protocol describes a valuable experimental approach for investigating the kinetics of sudden intrinsic autonomic neuron activation in perfused hearts and the interactions between cardiac cholinergic and catecholaminergic activity.
Disclosures
No conflicts of interest to declare.
Acknowledgements
This work was supported by NIH R01 HL144157 to MWK, NIH R01 HL144157 to EE and MWK, and NIH R01s HL147279 and HL146169 to MWK and DM, and a Collins Distinguished Doctoral Fellowship to RR.
Materials
| Name | Company | Catalog Number | Comments |
|---|---|---|---|
| #3c Forceps (x2) | Dumont | 11231-20 | |
| 0.2 μm Cellulose Nitrate Membrane Filter | Whatman | 7182-004 | For filtering KH |
| 0.5 ml, Microcentrifuge Tube | Ultra Cruz | sc-200269 | |
| 10 μm Nuclepore Membrane Filter | Whatman | 111115 | For system filter |
| Analog Incubator | Qunicy Labs | 12-140 | |
| Aortic Cannula | Harvard Apparatus | 73-2798 | |
| Arbitrary Function Generator | Tektronix | AFG3021B | |
| Braided Silk Suture 4-0 | Surgical Specialties Look | SP116 | |
| CaCl2 | Sigma-Aldrich | C1016 | |
| Curved Hemostat | Ted Pella | 53065 | |
| Einthoven Goldberger Module | Hugo Sachs Elektronik | 73-1778 | |
| Flexible Silicone Wire 30AWG | BNTECHGO | 619317716902 | |
| Glucose | Sigma-Aldrich | G8270 | |
| Heavy Curved Iris Forceps | Aesculap | OC022R | |
| Heparin Sodium Injection | Sagent | 400-30 | |
| Iris Scissors | Ted Pella | 13215 | |
| Isoflurane Solution | Covetrus | 029405 | |
| KCl | Sigma-Aldrich | P3911 | |
| KH2PO4 | Sigma-Aldrich | P9791 | |
| LabChart 8 | ADInstruments | Data acquisition software | |
| MgSO4 | Sigma-Aldrich | M7506 | |
| Microdissecting Scissors | WPI | 504520 | |
| Micro-LED | Dialight | 598-8091-107F | |
| NaCl | Sigma-Aldrich | S9625 | |
| NaHCO3 | Sigma-Aldrich | S6014 | |
| Optical Power Meter | Thorlabs | PM100D | |
| PowerLab 8/35 | ADInstruments | PL3508 | |
| Self-opening Precision Scissors | Excelta | 366 | |
| Single Animal Anesthesia Machine | E-Z Systems | EZ-108SA | |
| Soldering Station | Weller | WES51 | |
| SureOne Filter Pipette Tips | Fisherbrand | 02-707-478 | |
| SYLGARD 184 Silicone Elastomer Kit | DOW | 04019862 | |
| Tissue Forceps | Ted Pella | 13220 | |
| Tubing Flow System | Transonic | TS410 |
References
- Deisseroth, K., et al. Next-generation optical technologies for illuminating genetically targeted brain circuits. J Neurosci. 26 (41), 10380-10386 (2006).
- Entcheva, E., Kay, M. W. Cardiac optogenetics: a decade of enlightenment. Nat Rev Cardiol. 18, 349-367 (2021).
- Ambrosi, C. M., Klimas, A., Yu, J., Entcheva, E. Cardiac applications of optogenetics. Prog Biophys Mol Biol. 115 (2-3), 294-304 (2014).
- Pinol, R. A., Bateman, R., Mendelowitz, D. Optogenetic approaches to characterize the long-range synaptic pathways from the hypothalamus to brain stem autonomic nuclei. J Neurosci Meth. 210 (2), 238-246 (2012).
- Zeng, H., Madisen, L. Mouse transgenic approaches in optogenetics. Prog Brain Res. 196, 193-213 (2012).
- Sauer, B. Inducible gene targeting in mice using the Cre/lox system. Methods. 14 (4), 381-392 (1998).
- Hedrick, T., et al. Characterization of channelrhodopsin and archaerhodopsin in cholinergic neurons of Cre-lox transgenic mice. PLoS One. 11 (5), 1-15 (2016).
- Moreno, A., et al. Sudden heart rate reduction upon optogenetic release of acetylcholine from cardiac parasympathetic neurons in perfused hearts. Front Physiol. 10, 1-11 (2019).
- Habecker, B. A., et al. Molecular and cellular neurocardiology in heart disease. J Physiol. , (2024).
- Wengrowski, A. M., et al. Optogenetic release of norepinephrine from cardiac sympathetic neurons alters mechanical and electrical function. Cardiovas Res. 105 (2), 143-150 (2015).
- Williams, J. C., et al. Computational optogenetics: empirically-derived voltage- and light-sensitive channelrhodopsin-2 model. PLoS Comput Biol. 9 (9), e1003220(2013).
- Moreno, A., Kowalik, G., Mendelowitz, D., Kay, M. W. Optogenetic control of cardiac autonomic neurons in transgenic mice. Meth Mol Biol. 2191, 309-321 (2021).
- Einthoven, W., Fahr, G., de Waart, A. On the direction and manifest size of the variations of potential in the human heart and on the influence of the position of the heart on the form of the electrocardiogram. Am Heart J. 40 (2), 163-211 (1950).
- Giles, A. V., et al. Paradoxical arteriole constriction compromises cytosolic and mitochondrial oxygen delivery in the isolated saline-perfused heart. Am J Physiol Heart Circ Physiol. 315 (6), H1791-H1804 (2018).
- Wallick, D. W., Martin, P. J., Masuda, Y., Levy, M. N. Effects of autonomic activity and changes in heart rate on atrioventricular conduction. Am J Physiol. 243 (4), H523-H527 (1982).
- Entcheva, E. Cardiac optogenetics. Am J Physiol Heart Circ Physiol. 304 (9), H1179-H1191 (2013).
- Wang, L., et al. Cardiac sympathetic nerve transdifferentiation reduces action potential heterogeneity after myocardial infarction. Am J Physiol Heart Circ Physiol. 318 (3), H558-H565 (2020).
- Shattock, M. J., Tipton, M. J. Autonomic conflict: a different way to die during cold water immersion. J Physiol. 590 (14), 3219-3230 (2012).
- Sacconi, L., et al. KHz-rate volumetric voltage imaging of the whole Zebrafish heart. Biophys Rep. 2 (1), 100046(2022).
- Asfour, H., Swift, L. M., Sarvazyan, N., Doroslovacki, M., Kay, M. W. Signal decomposition of transmembrane voltage-sensitive dye fluorescence using a multiresolution wavelet analysis. IEEE Trans Biomed Eng. 58 (7), 2083-2093 (2011).
- Nyns, E. C. A., et al. Optogenetic termination of ventricular arrhythmias in the whole heart: towards biological cardiac rhythm management. Eur Heart J. 38 (27), 2132-2136 (2017).
- Ripplinger, C. M., et al. Guidelines for assessment of cardiac electrophysiology and arrhythmias in small animals. Am J Physiol Heart Circ Physiol. 323 (6), H1137-H1166 (2022).
- Swift, L. M., Kay, M. W., Ripplinger, C. M., Posnack, N. G. Stop the beat to see the rhythm: excitation-contraction uncoupling in cardiac research. Am J Physiol Heart Circ Physiol. 321 (6), H1005-H1013 (2021).
- Asfour, H., et al. NADH fluorescence imaging of isolated biventricular working rabbit hearts. J Vis Exp. (65), e4115(2012).
Reprints and Permissions
