Here, we show that the 0.5-mL chamber for high-resolution respirometry shows results that are consistent with the 2.0-mL chamber if appropriate instrumental O2 background correction is applied. It requires less sample, which is advantageous for studies with limited availability or low respiratory capacities.
Method Article
High-Resolution Respirometry in a Small-Volume Chamber
In This Article
Summary
Abstract
Investigating respiratory fluxes is decisive for understanding the complex interplay between metabolic processes. Studies of cells and tissues with limited sample availability and low respiratory rates may benefit from small experimental volumes. We examined if the 0.5-mL chamber yields results consistent with the 2.0-mL chamber at identical sample concentrations used in high-resolution respirometry with the Oroboros. The background O2 flux was 4-fold higher in 0.5-mL than 2.0-mL chambers at air saturation but was reproducible, allowing for accurate background correction. The optimal stirring speed was between 550 rotations per minute (rpm) and 750 rpm in the 0.5-mL chamber. Respiratory fluxes in living cells, permeabilized cells, and isolated mitochondria were measured in parallel in the 0.5-mL and 2.0-mL chambers, using Substrate-Uncoupler-Inhibitor Titration protocols with 14 to 20 titrations. O2 fluxes in the different chamber types were identical within the limits of detection. The 0.5-mL chamber, requiring close to four times less sample than the 2.0-mL chamber, offers a significant advantage for studies with limited amounts of sample or low respiratory capacities.
Introduction
Investigating mitochondrial respiratory pathways is key for shedding light on the metabolic mechanisms underlying various diseases, aging, or responses to stress, thus providing potential targets for therapeutic interventions and improving diagnostic capabilities1,2,3. High-resolution respirometry (HRR) allows for detailed analysis of mitochondrial pathway- and coupling-control in oxidative phosphorylation (OXPHOS) across a variety of sample types and preparations4. The volume of the experimental chamber is a fundamental design feature of respirometric instruments. The previously established chamber volume is 2.0 mL in the Oroboros. This volume has been optimized to entail low instrumental background O2 flux and ensure homogeneity of the stirred medium. These are among the key quality criteria for accurate measurement of respiration at low oxygen and hyperoxic conditions required for mitochondrial oxygen kinetics and permeabilized muscle fibers, respectively5,6,7,8,9. Furthermore, several multisensor insertions10 require the space of the 2.0-mL chamber (Table 1).
In the present study, we examined the feasibility of decreasing the chamber volume for HRR from 2.0 mL to 0.5 mL. Can lower cell counts or amounts of tissue be applied in respirometric assays in a smaller chamber without compromising accuracy? Clarification of this question is important for investigating human tissue and liquid biopsies, primary cells, and slow-growing cell cultures1. Similarly, a reduction of chamber volume is potentially advantageous in studies of samples with low respiratory activities in defective mitochondria11 and mitochondrial pathways with inherently low capacities, such as fatty acid oxidation in the brain12. However, resolution may be diminished at low chamber size due to disproportionately increasing artifacts of O2 back diffusion and inaccurate volume calibration13,14. Therefore, we analyzed the instrumental performance of the Oroboros with the small-volume chamber (sV) calibrated at a minimal experimental volume of 0.5 mL, compared to the classic-volume chamber (cV) calibrated at 2.0 mL. In particular, we analyzed the instrumental background O2 flux and optimal stirring speed.
Substrate-uncoupler-inhibitor titration (SUIT) protocols are used to assess respiratory rates and states in OXPHOS analysis. SUIT protocols comprised 14 to 20 titrations per respirometric assay and entailed respiratory O2 fluxes ranging from a few pmol∙s-1∙mL-1 to hundreds of pmol∙s-1∙mL-1. Coupling-control states include the leak rate L, i.e., the dissipative component of respiration, which is not available to phosphorylate adenosine-5'-diphosphate (ADP) to adenosine-5'-triphosphate (ATP) and results from proton leak, proton slip, cation cycling, and electron leak. The OXPHOS capacity P accounts for the respiration of mitochondria when electron transfer measured as O2 consumption (oxidation) is coupled to ATP synthesis (phosphorylation) in the presence of ADP. The electron transfer capacity E in the decoupled state is quantified by titrations of a protonophore in the presence of mitochondrial substrates15. Residual oxygen consumption rox is determined after the addition of the Complex I- and Complex III-inhibitors rotenone and antimycin A.
We measured the respiration of cells and mitochondrial preparations in the sV and cV chambers. Platelets are anucleate cytoplasmic fragments of megakaryocytes and represent a readily obtainable source of human mitochondria. Therefore, platelets were applied as a model for living cells (or cell particles) with intact plasma membranes. Respiration of blood cells serves as a biomarker of systemic mitochondrial diseases and correlates with the bioenergetic fitness of metabolically active organs16,17,18,19, although these findings cannot be generalized20,21,22. Human fibroblasts were chosen for their application as a cellular model of mitochondrial dysfunction1,23,24,25. The intactness of the plasma membranes is necessary for cell viability, but its selective permeabilization allows for the exchange of molecules between the cytosol and the surrounding medium. Hence, fibroblasts with chemically permeabilized plasma membranes were studied as an example of permeabilized cells, compared to isolated mitochondria used to assess mitochondrial function and required to separate mitochondrial subpopulations26,27.
Protocol
For the study on human platelets, eight volunteers provided written informed consent to participate in the study, which was approved by the Swedish Ethical Review Authority (Nr. 2013/181). Two human skin fibroblast cell lines from male newborns were purchased from ATCC and used according to the ethical approval of the Ministry of Health of the Czech Republic (project: AZV MZ CR NU22-07-00474). Procedures involving mice were conducted in accordance with the Austrian Animal Experimentation Act and in compliance with the European Convention for the Protection of Vertebrate Animals used for Experimental and other Scientific Purposes (Tierversuchsgesetz 2012; Directive 2010/63/EU; BMWFM-66.011/0128-WF/V/3b/2016). The 3Rs principle was applied to minimize the number of experimental animals.
1. Volume calibration
- Mount the small-volume chambers (sV) or the classic-volume chambers (cV) onto the Oroboros (Figure 1A,B; Table 1).
- Switch on the Oroboros and connect to DatLab.
- Dry the chambers.
- Pipette 0.54 mL of H2O into the sV (0.50 mL effective experimental volume plus 0.04 mL capillary dead volume) or 2.07 mL of H2O into the cV (2.00 mL effective volume plus 0.07 mL capillary dead volume).
NOTE: To avoid liquid loss between the top of the glass cylinder and the polyoxymethylene (POM) chamber holder, insert the pipette tip deeply enough to touch the wall of the glass chamber. - Switch on the stirrers.
- Before closing the chamber, moisten the O-rings of the stoppers while keeping their capillary dry. Loosen the volume-calibration rings and insert the stoppers downwards until liquid fills the stopper capillary and a small drop appears in the receptacle at the upper end of the capillary (Table 1).
- Tighten the volume-calibration rings to fix their position such that the calibrated volume is obtained in consecutive insertions of the stoppers.
2. Oroboros general setting
- Start the DatLab software.
- Set the experimental temperature (37 °C) and the stirring rotation speed at 550 rpm (9.2 Hz or rotations per s) in the Chamber sV or 750 rpm (12.5 Hz) in the Chamber cV. Set the data-sampling interval at 2 s with smoothing over 80 s (40 data points) in instrumental O2 background tests or 40 s (20 data points) for respirometry.
NOTE: The magnetic stirrer bars (AlNiCo coated in polyvinylidene difluoride [PVDF]; Table 1) are agitated by a pulsed rotating magnetic field with 3.5 mT field strength at the level of the stirrer in the chamber. - Perform air calibration28 in MiR05 or in the same incubation medium used in subsequent experiments.
- Perform zero oxygen calibrations occasionally but never immediately before starting experiments.
- Prepare a fresh Na-dithionite stock solution by dissolving O2-Zero Powder in 50 mM phosphate buffer (pH 8.0) to a concentration of 2.5 mM or 10 mM for the sV or cV chambers, respectively.
- Titrate Na-dithionite in excess to obtain the raw signal R0 or zero current [µA] at O2 concentration 0 µM14,28.
3. Instrumental O2 background test
- Chamber sV
- After air calibration, close the chamber. Monitor the oxygen signal for about 60 min until the O2 concentration declines from air saturation to approximately 150 µM. Set four marks J°1 to J°4 on the plot 'O2 slope negative'.
NOTE: Perform this instrumental O2 background test every day before starting an experiment. - OPTIONAL: With a Hamilton syringe, titrate Na-dithionite prepared according to step 2.4.1 to reach an O2 concentration of 100 µM (Figure 1C).
NOTE: In another protocol, Na-dithionite is titrated into the chamber using the titration-injection micropump (TIP2k; Supplementary Figure 1 and Supplementary Figure 2) for comparison with a standard method of determining the instrumental background O2 flux28.
- After air calibration, close the chamber. Monitor the oxygen signal for about 60 min until the O2 concentration declines from air saturation to approximately 150 µM. Set four marks J°1 to J°4 on the plot 'O2 slope negative'.
- Chamber cV
- After air calibration, close the chamber, wait for stabilization of the O2 slope, and set the J°1 mark on the plot 'O2 slope neg.'28. With a Hamilton syringe, titrate Na-dithionite prepared according to step 2.4.1. in steps of 0.7 µL to match the oxygen regime of the Chamber sV and lower the O2 concentration to 150 µM.
- Add another Na-dithionite titration step (ca. 7 µL) to lower the O2 concentration to 100 µM (Figure 1D).
- Instrumental O2 background data analysis
- Calculate the instrumental O2 background slope in DatLab28. Select Flux/Slope from the top menu.
- Open the O2 background correction window. Select Active File as the source of the O2 background and select the J° marks to be used for the calculation of the linear regression. Apply the O2 background correction.
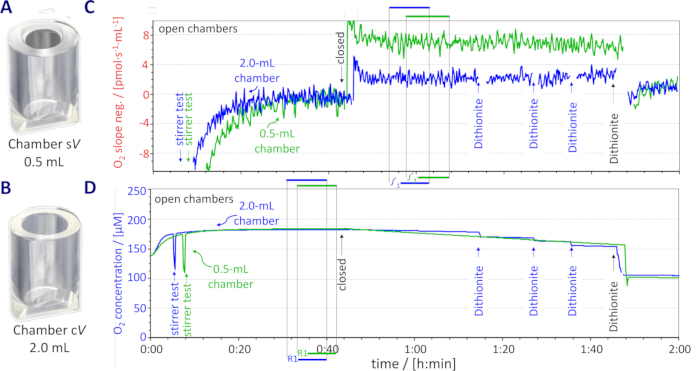
Figure 1: Small-volume (sV) and classic-volume (cV) chambers and instrumental O2 background test. (A) Chamber sV. (B) Chamber cV. (C) Representative traces of slope negative and J°1 marks, sV (0.5 mL; green) and cV (2.0 mL; blue). (D) Corresponding oxygen concentration and R1 marks. Three manual Na-dithionite titrations (ca. 0.7 µL, 10 mM stock; cV) and final 7.0 µL titration of 2.5 mM and 10 mM stock in the sV and cV chamber, respectively. Spikes caused by titrations were eliminated. Please click here to view a larger version of this figure.
4. Addition of sample to the Oroboros chambers
NOTE: The sample can be added into the chamber by two methods: partial volume replacement (platelets and fibroblasts in the present study) or complete volume replacement (isolated mitochondria in the present study).
- Partial volume replacement
- Remove the fully inserted stopper. Pipette and discard a volume Vout of MiR05. Vout is 60-70 µL for platelets and 80-150 µL for fibroblasts, calculated according to the cell concentrations in the stock cell suspension.
- Equivalent to Vout, pipette the same volume VJ.i of stock cell suspension (with known cell concentration) into the chamber (Figure 2).
- Calculate the experimental cell concentration in the actual volume V' (0.54 mL and 2.07 mL), larger than the effective experimental volume V (0.5 mL and 2.0 mL).
NOTE: Concentrations of the stock cell suspension and experimental cell concentration should be planned to obtain volumes of VJ.i = Vout that is compatible with a small titration error. In the experiments with platelets, a prototype stopper was used for the Chamber sV with a capillary dead volume of 0.05 mL.
- Complete volume replacement
- Siphon off the entire medium from the chamber and replace it with at least 0.54 mL or 2.07 mL of isolated mitochondria stock solution at the experimental sample concentration in the sV or cV chambers, respectively.
- Close the chamber and siphon off the excess mitochondrial stock solution from the stopper receptacle.
NOTE: Complete volume replacement excludes any variability in mitochondrial concentration that may be incurred by titrating into the closed chamber through the stopper capillary with a Hamilton syringe. The latter method is applicable to samples with a small diameter prepared in concentrated stock suspensions (e.g., isolated mitochondria); however, it exposes fragile cells to potential damage of plasma membranes by shear forces exerted in the 51 mm long needle of the Hamilton syringe (0.41 mm inner diameter). This is avoided by removing the stopper and pipetting the sample into the chamber by partial or complete volume replacement. Three types of mitochondrial preparations were studied. The sample preparations are described in Supplementary File 11,26,29,30.
- Living cells: human platelets
- Insert the cryovials containing platelets into a water bath at 37 °C and thaw the content until little ice remains.
- Open the cryovials and add 1 mL of pre-warmed medium (DPBS + 10 mM EGTA, 37 °C) slowly in drops.
- Gently mix the platelets and transfer them to a 50 mL centrifuge tube with a total volume of 10 mL pre-warmed medium (DPBS + 10 mM EGTA, 37 °C). Centrifuge at 1000 g for 10 min at room temperature (RT) using a swing-out rotor (acceleration 6, brake 2).
- Resuspend the platelets in 0.25 mL of DPBS + 10 mM EGTA (RT) and add them into the chambers by partial volume replacement to an initial experimental cell concentration ranging from 157 · 106 to 210 · 106 x·mL-1 in the 0.5-mL chamber and from 164 · 106 to 220 · 106 x·mL-1 in the 2.0-mL chamber (see31 for details on the elementary unit x).
NOTE: One Oroboros was equipped with the sV and cV chamber in positions A and B, respectively, used in parallel with another Oroboros equipped with the sV and cV chamber in positions B and A, respectively.
- Permeabilized cells: human fibroblasts
- Add the cells to the Oroboros chambers by partial volume replacement to a nominal cell concentration of 0.75 · 106 x·mL-1 in both chamber types and calculate the actual concentration (step 4.1.3).
NOTE: Different Oroboros instruments were used in parallel, each equipped with either the sV or cV chambers.
- Add the cells to the Oroboros chambers by partial volume replacement to a nominal cell concentration of 0.75 · 106 x·mL-1 in both chamber types and calculate the actual concentration (step 4.1.3).
- Isolated mitochondria: mouse heart
- Add 15 µL of mitochondrial suspension to 5985 µL of mitochondrial respiration medium (MiR05), resulting in a stock mitochondrial protein concentration ranging from 0.013-0.026 mg∙mL-1.
- Add the mitochondrial suspension to the Oroboros chambers by complete volume replacement.
NOTE: One Oroboros was equipped with the sV and cV chamber in positions A and B, respectively, used in parallel with another Oroboros equipped with the sV and cV chambers in positions B and A, respectively.
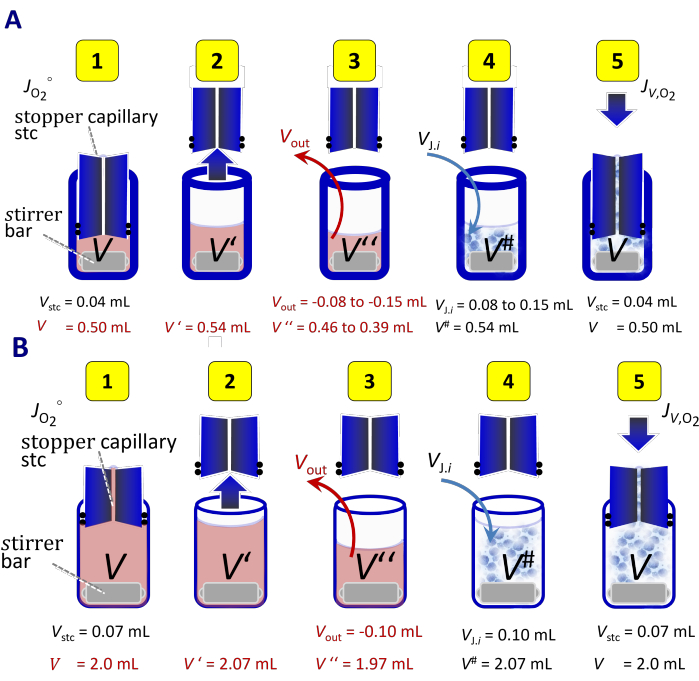
Figure 2: Addition of the cell suspension by partial volume replacement. (A) Addition in the 0.5-mL Chamber sV and (B) the 2.0-mL Chamber cV. (1) Closed chamber with volumes of respiration medium V and filled stopper capillary Vstc, for measurement of instrumental background O2 flux JO2°. (2) Stopper removed, Vstc drained into the chamber resulting in total volume V'= V+Vstc. (3) Partial removal of medium Vout = -VJ.i. A volume V''= V'+Vout remains in the chamber. (4) Pipetting subsample with volume VJ.i of respirometric stock cell suspension into the chamber resulting in a total volume V# = V+Vstc of diluted cell suspension. (5) Closed chamber with filled stopper capillary (dead volume Vstc) for measurement of volume-specific O2 flux JV,O2 in an experimental volume V. This figure has been modified from Figure 2A in Cell count and normalization in HRR41. Please click here to view a larger version of this figure.
5. SUIT protocols
- Titrate the stock solutions of the chemicals listed in Supplementary Table 1 into the chambers with Hamilton microsyringes, adjusting the titration volumes to obtain the same experimental concentrations in the sV and cV chambers (see figure legends of Figures 6, 8, 10).
- Select protocol SUIT-003_D01832,33 (for platelets in the present study).
- Select protocols SUIT-001_D0044,15,34,35 and SUIT-002_D0074,15,35,36 (for fibroblasts in the present study).
- Select protocol SUIT-002_D0054,15,35,37 (for isolated mitochondria in the present study).
6. SUIT data analysis
- In DatLab, set marks to define sections of selected plots.
- Select Flux/Slope on the top menu. Open the Flux/Slope window. Apply the titration volume correction for dilution of suspended samples by each titration in the SUIT protocol.
- Select Marks from the top menu. Open Mark statistics to show the median of the marked data points baseline-corrected by subtraction of residual oxygen consumption (rox).
- Calculate the intercept and slope between paired results obtained in the sV and cV chambers by inverted regression analysis25,28 using a spreadsheet.
- Compare the respiratory rates in the rox state (minimum O2 fluxes) in the sV and cV chambers by a paired Student's t-test using the software jamovi 2.3.1338.
NOTE: Since the two chambers in an Oroboros instrument are functionally independent (except for temperature and DatLab recording intervals), measurements in each chamber can be considered separately, similar to using different instruments. Final results may be reported as medians or averages of multiple chambers with information on their variability.
Results
The raw signals R1 [µA] of the oxygen sensors (POS) are expected to be independent of the volume of the aqueous phase in equilibrium with the gas phase of air in the 'open' chamber, as confirmed in Supplementary Table 2. In the closed chamber, however, the instrumental background O2 flux near air saturation J°1 [pmol∙s-1∙mL-1] depends on the volume V (Supplementary Table 2). The O2 consumption of the sensor [pmol∙s-1] can be predicted from the electron flow measured as the zero-corrected raw signal R1-R0 [µA], the charge number 4 e-/O2 and the Faraday constant F = 96 485.33 C∙mol-1. 1 µA is equivalent to an electron flow (e-) of 10.36 pmol∙s-1. Dividing by the charge number results in an O2 flow15,39 of 2.591 pmol∙s-1·µA-1. The recorded median of R1-R0 was 2.09 µA and 1.98 µA in the 0.5-mL and 2.0-mL chambers, respectively (Supplementary Table 2; R0 = 0.006 ± 0.007 µA in the sV and R0 = 0.004 ± 0.003 µA in the cV chambers), corresponding theoretically to O2 consumption rates of 5.41 pmol∙s-1and 5.13 pmol∙s-1. The O2 flow of the sensor is converted to the expected volume-specific flux at air saturation (J°R1) as 5.41 pmol∙s-1/0.5 mL = 10.82 pmol∙s-1∙mL-1 and 5.13 pmol∙s-1/2.0 mL = 2.56 pmol∙s-1∙mL-1 in the sV and cV chamber, respectively. With the same type of polarographic oxygen sensors in the 2.0-mL and 0.5-mL chamber, the volume-specific background O2 flux - calculated from the current R1-R0 (J°R1) - increases theoretically 4-fold in inverse proportion to the chamber volume. J°air (at air saturation, where back diffusion is zero; compare Table 2 and Supplementary Table 3) was calculated for the O2 concentration at air saturation from the linear regression of the experimental background test (Figure 3). J°air approached the theoretically expected values J°R1 for both chambers (Table 2). The J°air / J°R1 ratio was 0.85 ± 0.04 and 0.92 ± 0.12 in the sV and cV chamber, respectively, in line with an independent series of 52 measurements in the 2.0-mL chamber, in which this ratio was 0.95 ± 0.12 (Supplementary Table 4). J°air was 3.9 times higher in the 0.5-mL than in the 2.0-mL chamber. The net O2 back diffusion J°50, calculated at 50 µM O2 from the linear regression of the experimental background test, was only three times higher in the 0.5-mL chamber (Table 2). The variability of instrumental background O2 fluxes was nearly identical in the two different chamber volumes, with standard deviation (SD) of 0.5 and 0.3 pmol∙s-1∙mL-1 for J°air and 0.9 and 0.8 pmol∙s-1∙mL-1 for J°50 in the sV and cV chamber, respectively (Table 2). Despite the higher instrumental background O2 slopes in the 0.5-mL chamber, the dependence of background O2 fluxes on cO2 was highly reproducible in both chamber types (Figure 3D). This results in low values of the residuals <±1 pmol∙s-1∙mL-1for both chambers (Supplementary Table 5), in line with the limit of detection of the Oroboros28.
We quantified the effect of stirring speed on the calibration raw signal R1 of the POS between 350 rpm (5.8 Hz) and 950 rpm (15.8 Hz) in steps of 100 rpm (1.7 Hz) with the chamber in the 'open' configuration. In this configuration, the O2 dissolved in the medium is in equilibrium with the gas phase; therefore, changes in the raw signal (microampere [µA]) as a function of stirring speed do not reflect true differences in cO2. The oxygen sensors responded to a change in stirring speed with a small deviation from R1 at the default speed of 750 rpm, independent of chamber volume (Figure 4). In the 'open' configuration, the noise of the O2 slope, defined as SD for each step after stabilization of the signal, was lowest at 850 rpm in both chamber types and increased when the stirring speed deviated from this value in either direction (Figure 5A). Below 550 rpm, the noise of the O2 slope exceeded the threshold of ±4 pmol∙s-1∙mL-1, defining the minimum practical stirring speed. Due to technical limitations, the upper boundary was not reached, rendering 950 rpm as the maximum practical stirring speed (Figure 5A). Within this range, the deviation of the O2 signal from R1 was <2.5 %. Closing the chambers did not alter the relationship between noise and stirring speed (Figure 5B). The exponential time constant τ, was 2.53 ± 0.05 s at 550 rpm and 2.50 ± 0.05 s at 750 rpm for the 0.5-mL chamber (Supplementary Figure 3).
The SUIT-003_D018 protocol applied to platelets includes up to 14 titration steps. It is designed to study the coupling control of living cells, ce, and plasma membrane permeability as an index of cell viability32. Oxygen flow measured in the two types of chambers (Figure 6) was tightly matched in all respiratory states (Figure 7). Intermittent reoxygenations are required to avoid functional hypoxia or restrict the experimental O2 concentration to a defined range. Reoxygenations were performed by opening the chamber to the 'open' position after titration of Rot. Upon closing the chamber, O2 flux stabilized within 4 min in the 2.0-mL chamber, but approximately 10 min was required in the 0.5-mL chamber before stabilization and setting the new mark (Figure 6 and Supplementary Figure 4). Reoxygenation in the rox state when O2 fluxes are low avoids a decline of O2 concentration during the time required for stabilization. Rotenone-inhibited rox was 0.9 ± 0.6 and 2.0 ± 0.6 pmol∙s-1∙mL-1 at 98 ± 17 and 94 ± 17 µM O2 (mean ± SD) in the sV and cV chamber, respectively. Rox increased by 3.1 ± 0.9 and 0.9 ± 0.4 pmol∙s-1∙mL-1 upon reoxygenation to 159 ± 8 and 147 ± 11 µM O2 in the sV and cV chamber, respectively. The oxygen dependence of rox observed in platelets agrees with results on human fibroblasts and umbilical vein endothelial cells40.
For OXPHOS analysis in permeabilized fibroblasts, we used two SUIT protocols with up to 17 and 20 titration steps (SUIT-001 and SUIT-002, respectively35; Figure 8); thus, the titration volume correction is particularly important since at the end of SUIT-002, the dilution amounted to maximally 14 % and 10.5 % in the sV and cV chamber, respectively. Fibroblast cell counts of 0.35·106 x and 1.44·106 x in the 0.5-mL and 2.0-mL chambers, respectively, resulted in the same cell concentration of 0.75·106 x∙mL-1. The combination of SUIT-001 and SUIT-002 addressed 20 respiratory states, all of which correlated closely in the two-chamber types (r2= 0.950 for SUIT-001 and r2= 0.959 for SUIT-002). In both protocols, Complex IV had a relatively high scatter (Figure 9). Reoxygenation was not required in SUIT-001 starting at a low volume-specific O2 flux of 18.7 ± 7.0 pmol∙s-1∙mL-1 in the routine state (mean ± SD), allowing O2 concentration to decline to 56 µM up to the CIV-linked section of the protocol (Figure 8A; 8Ama). However, in SUIT-002, reoxygenation was performed before uncoupler titrations, increasing the O2 concentration from 100 µM to 180 µM (Figure 8B; 6Gp). Considering the long time required for the stabilization of flux after reoxygenation, reoxygenation during uncoupler titrations should be avoided.
A shortened SUIT protocol was applied to isolated mitochondria (Figure 10). Mitochondrial protein concentration was determined after the respirometric assay, making it impossible to define in advance the accurate sample concentration in the chamber. Volume-specific respiratory flux varies as a function of mitochondrial concentration. Therefore, data were presented as volume-specific and protein mass-specific flux (Figure 11). Both representations display the tight correlation between measurements obtained in the 0.5-mL and 2.0-mL chambers (Figure 11).
Residual oxygen consumption rox measured after inhibition of Complex III by antimycin A can be used as an index of instrumental performance at very low respiratory rates. In all experimental series, rox was comparable between the 0.5-mL and the 2.0-mL chambers (platelets: t(5) = -0.34, p = 0.74; fibroblast: SUIT-001: t(10) = 20.00, p = 0.06; SUIT-002: t(10) = 11.00, p = 0.96; isolated mitochondria: t(4) = -1.18, p = 0.27). The scatter of the data corresponded largely to the instrumental uncertainty of ±1 pmol∙s-1∙mL-1 13,28, as illustrated in Figure 12. The original files are available for open access at Zenodo repository: 10.5281/zenodo.11634408.

Figure 3: Instrumental background O2 flux for the sV (0.5 mL; green and black) and cV chamber (2.0 mL; blue). O2 concentration range from air saturation (ca. 180 μM) to ca. 50 µM. Open symbols: O2 concentrations obtained without Na-dithionite. Solid symbols: O2 concentrations controlled by manual titrations of Na-dithionite. Black circles: O2 concentrations controlled by titrations of Na-dithionite using the TIP2k in the 0.5-mL chamber (N = 8). Results from instrumental background tests were pooled from (A) Series 1 (sV: N = 2; cV: N = 2) before using living cells (ce); (B) Series 2 (sV: N = 38; cV: N = 50) before using permeabilized cells (pce); (C) Series 3 (sV: N = 10; cV: N = 10) before using isolated mitochondria (imt). (D) Superimposed data from panels A-C. Please click here to view a larger version of this figure.
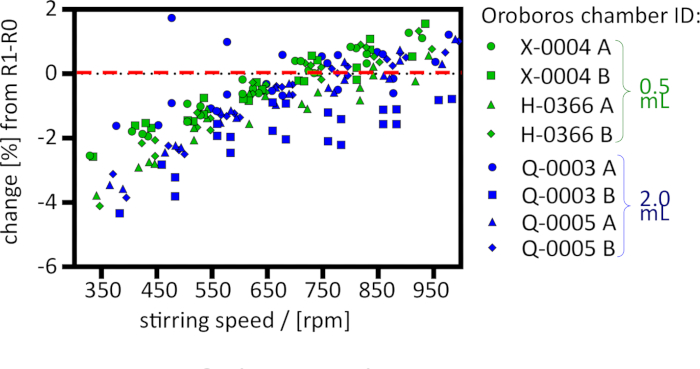
Figure 4: Effect of stirring rotation speed on the POS signal at air saturation ('open' chamber) in the 0.5-mL chamber (green) and 2.0-mL chamber (blue). Response [%] relative to R0-corrected air calibration signals R1-R0 [µA] at 750 rpm (sV: N = 4; cV: N = 4). Please click here to view a larger version of this figure.
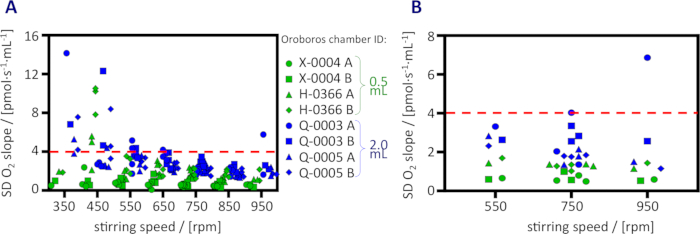
Figure 5: Noise of the O2 slope as a function of stirring rotation speed. Noise expressed as the standard deviation in (A) 'open' chamber; (B) closed chamber (0.5 mL, green; 2.0 mL, blue). Please click here to view a larger version of this figure.
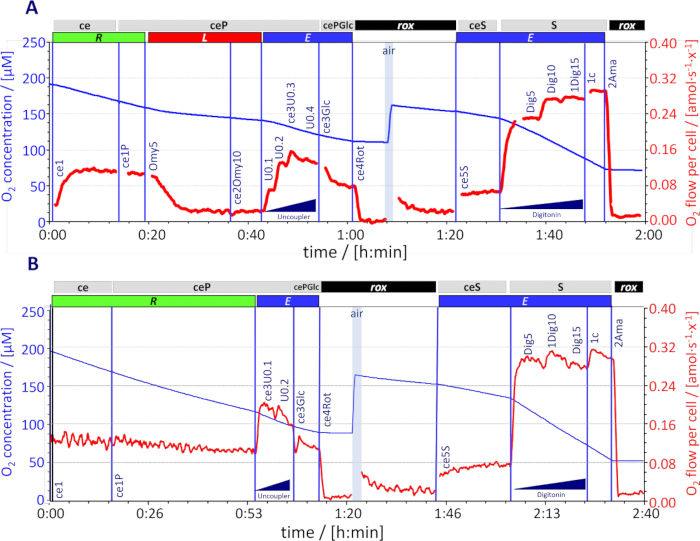
Figure 6: O2 consumption of cryopreserved human platelets in the 0.5-mL chamber. Representative traces of O2 concentration [µM] (blue lines) and O2 flow per cell [amol∙s-1∙x-1] calculated as O2 flux [pmol∙s-1∙mL-1] divided by cell concentration of 157∙106 x∙mL-1 (red lines, corrected for instrumental background O2 flux; spikes caused by titrations were eliminated). O2 concentration was kept above 50 µM by intermittent reoxygenations (air, 'open' chamber, blue shade). Sequence of respiratory states (titrations and rates; protocol SUIT-003_D018): ce1, routine respiration R of living cells. ce1P, pyruvate 5 mM as external substrate. ce2Omy10 (panel A), Omy titrations in 5 nM steps; leak respiration L. ce3U0.3 (panel A) and ce3U0.1 (panel B), uncoupler titrations to optimum CCCP concentration of 0.3 and 0.1 µM, respectively; ET capacity E. ce3Glc, glucose 11 mM; E progressively inhibited by uncoupler. ce4Rot, rotenone 0.5 µM inhibiting CI; residual oxygen consumption rox. ce5S, succinate 10 mM; stimulating E in plasma membrane-permeable cells. 1Dig15 (panel A) and 1Dig10 (panel B), digitonin titrations in 5 µg·mL-1steps to optimum concentrations of 15 and 10 µg·mL-1, respectively for complete plasma membrane permeabilization; succinate-pathway ET capacity SE. 1c, cytochrome c 10 µM; test of mitochondrial outer membrane integrity. 2Ama, antimycin A 2.5 µM inhibiting CIII; rox. Please click here to view a larger version of this figure.
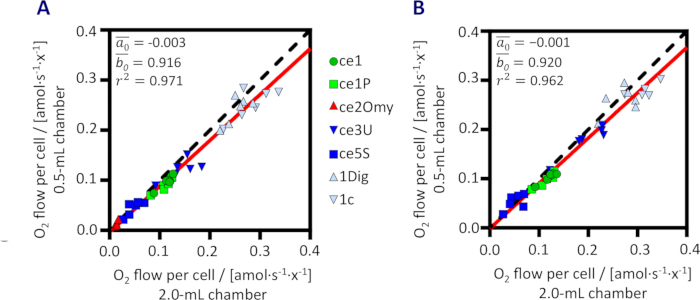
Figure 7: Correlation of respiration of cryopreserved human platelets measured in the 0.5-mL and 2.0-mL chamber. Rox-corrected O2 flow was assessed in protocol SUIT-003_D018 (Figure 6); N = 6. (A) With oligomycin Omy; (B) without Omy. Mean slopes  and intercepts
  of inverted least squares regression and coefficients of determination r2 calculated from all data. Dashed black lines represent the lines of identity. Red lines represent the calculated regression lines. O2 flows in the state after the addition of glucose were excluded (see Figure 6). The protocols with and without oligomycin are separated in panels A and B to avoid overlap of data points. Please click here to view a larger version of this figure.
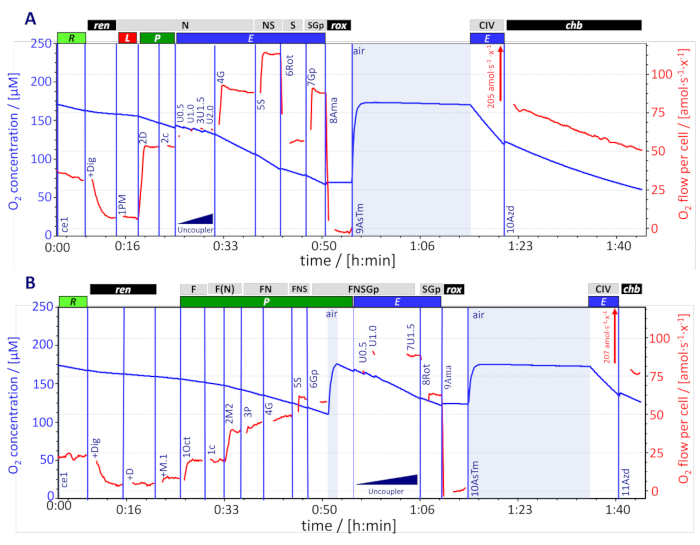
Figure 8: O2 consumption of fibroblasts in the 0.5-mL chamber. Representative traces of cO2 (blue lines [μM]) and O2 flow per cell calculated as O2 flux [pmol∙s-1∙mL-1] divided by cell concentration (0.75·106 x∙mL-1), corrected for instrumental background O2 flux (red lines, spikes caused by titrations were eliminated). O2 concentration was kept above 50 μM by intermittent reoxygenations (air, ‘open’ chamber, blue shade). Sequence of respiratory states (titrations and rates). (A) Protocol SUIT-001_D004: ce1, routine respiration R. +Dig, digitonin 10 μg·mL-1 (ce to pce), residual endogenous respiration ren. 1PM, pyruvate 5 mM & malate 2 mM; N-pathway leak respiration NL. 2D, ADP 2.5 mM; N-pathway OXPHOS capacity NP. 2c, cytochrome c 10 μM; test of mitochondrial outer membrane integrity. 3U1.5, uncoupler titrations to optimum CCCP concentration 1.5 μM; NADH-linked ET capacity NE. 4G, glutamate 10 mM; N(PGM)E. 5S, succinate 10 mM; NS-pathway ET capacity NSE. 6Rot, rotenone 0.5 μM; succinate-pathway ET capacity SE. 7Gp, glycerophosphate 10 mM; SGpE. 8Ama, antimycin A 2.5 μM; rox. 9AsTm, ascorbate 2 mM & TMPD 0.5 mM; substrates for CIV stimulation; the chamber was kept open for 20 min to allow for redox equilibration without depletion of oxygen4; O2 flux off scale after closing the chamber (205 amol·s-1·x-1). 10Azd, azide 100 mM; oxygen-dependent chemical background flux chb. (B) Protocol SUIT-002_D007: ce1, R. +Dig, ren. +D, stimulating ren. +M.1, malate 0.1 mM and 1Oct, octanoylcarnitine 0.5 mM; F-pathway OXPHOS capacity FP = J(1Oct)-J(+M.1). 1c. 2M2, malate 2 mM supporting the anaplerotic N-pathway; F(N)P. 3P and 4G, progressive activation to FNP. 5S, FNSP. 6Gp, FNSGpP. 7U1.5, FNSGpE. 8Rot, SGpE. 9Ama, rox. 10AsTm O2 flux off scale 207 amol·s-1·x-1. 11Azd, chb. In general, Complex IV activity is the difference of rates, J(AsTm)-J(Azd) at closely matched O2 concentrations. See Figure 6 for further details. Please click here to view a larger version of this figure.
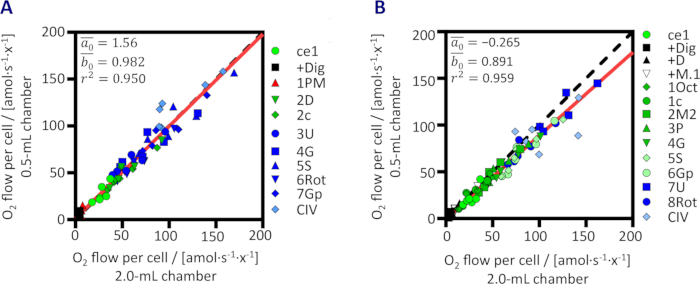
Figure 9: Correlation of respiration of permeabilized fibroblasts in the 0.5-mL and 2.0-mL chamber. Rox-corrected O2 flow in (A) SUIT-001_D004 and (B) SUIT-002_D007 (N = 6). Mean slope and intercept of inverted least squares regression and coefficient of determination r2 calculated from all data. The dashed black line represents the line of identity. Red lines represent the calculated regression lines. Please click here to view a larger version of this figure.
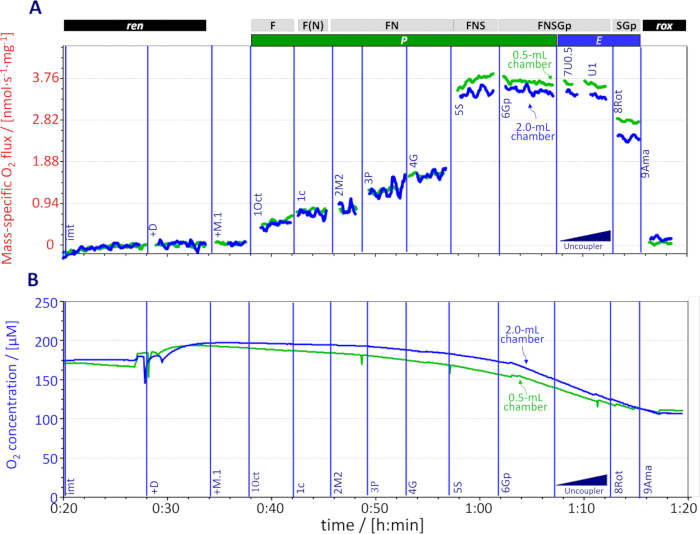
Figure 10: O2 consumption of isolated mouse heart mitochondria in 0.5-mL (green) and 2.0-mL (blue) chambers. Representative traces of (A) mass-specific O2 flux at mitochondrial protein concentration 0.023 mg∙mL-1 (corrected for instrumental background O2 flux, spikes caused by titrations were eliminated) and (B) O2 concentration [μM]. Sequence of respiratory states (titrations and rates) following the protocol SUIT-002_D005: imt, residual endogenous respiration ren. +D, ADP 2.5 mM; stimulating ren. +M.1, malate 0.1 mM and 1Oct, octanoylcarnitine 0.5 mM; F-pathway OXPHOS capacity FP = J(1Oct)-J(+M.1). 1c, cytochrome c 10 μM; test of mitochondrial outer membrane integrity. 2M2, high malate 2 mM supporting the anaplerotic N-pathway; F(N)P. 3P, pyruvate 5 mM; FNP. 4G, glutamate 10 mM; FNP. 5S, succinate 10 mM; FNSP. 6Gp, glycerophosphate 10 mM; FNSGpP. 7U0.5, uncoupler titrations to optimum CCCP concentration 0.5 μM; FNSGpE. 8Rot, rotenone 0.5 μM inhibiting CI; SGpE. 9Ama, antimycin A 2.5 μM inhibiting CIII; residual oxygen consumption rox. Please click here to view a larger version of this figure.
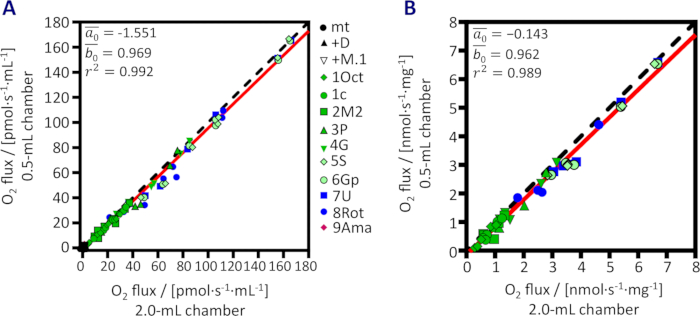
Figure 11: Correlation of respiration of isolated mouse cardiac mitochondria measured in the 0.5-mL and 2.0-mL chambers. O2 flux in the protocol shown in Figure 10 (N = 4). (A) Volume-specific O2 flux. (B) Rox-corrected O2 flux divided by mitochondrial protein concentration (0.013 - 0.026 mg∙mL-1). Mean slope and intercept of inverted least squares regression and coefficient of determination r2 calculated from all data. Dashed black lines represent the line of identity. Red lines represent the calculated regression line. Please click here to view a larger version of this figure.
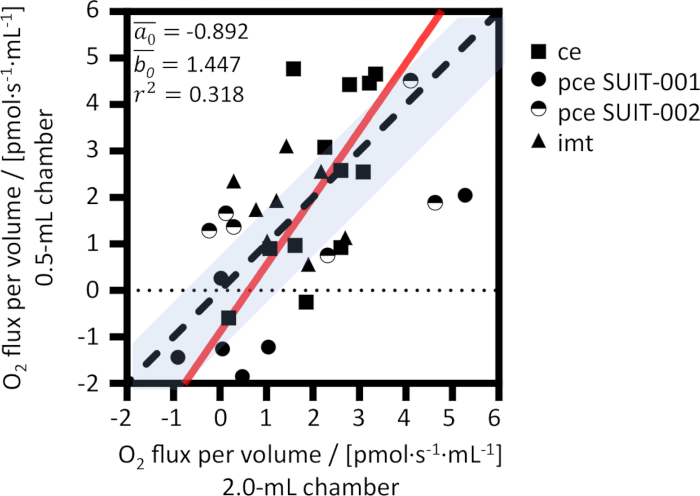
Figure 12: Residual oxygen consumption rox in the 0.5-mL and 2.0-mL chambers. Flux per volume measured after the addition of antimycin A, combined from experiments with living cells (ce, squares), permeabilized cells (pce, circles), and isolated mitochondria (imt, triangles). Mean slope and intercept of inverted least squares regression. Dashed line: line of identity. Red line: calculated regression line. Shadow: instrumental resolution range. Please click here to view a larger version of this figure.
| Module | sV | cV |
| Experimental chamber volume V | 0.5 mL | 2.0 mL |
| Inner diameter of glass cylinder | 12.0 mm | 16.0 mm |
| Outer diameter of glass cylinder | 24.0 mm | 24.0 mm |
| Thickness of glass wall | 6.0 mm | 4.0 mm |
| PVDF-coated stirrer bar | 11.5 x 6.2 mm | 15.0 x 6.0 mm |
| Stopper capillary diameter | 1.00 mm | 1.30 mm |
| Stopper capillary cross-sectional area | 0.79 mm2 | 1.33 mm2 |
| Stopper capillary length | 50.64 mm | 48.86 mm |
| Stopper capillary volume | 39.8 µL | 64.9 µL |
| Stopper capillary dead volume Vstc including a small dropa | 0.04 mL | 0.07 mL |
| Volume V´ for volume calibration | 0.54 mL | 2.07 mL |
aThe drop should correspond to 5 µL for the Chamber cV and close to 0 µL for the Chamber sV.
Table 1: Dimensions of the small volume (sV) and classic volume (cV) modules with polyether ether ketone (PEEK) stoppers.
| J°air / [pmol∙s-1∙mL-1] | J°50 / [pmol∙s-1∙mL-1] | |||
| Experimental chamber volume V | 0.5 mL | 2.0 mL | 0.5 mL | 2.0 mL |
| Mean | 9.22 | 2.37 | -3.17 | -1.17 |
| Median | 9.25 | 2.36 | -3.08 | -1.04 |
| Standard deviation | 0.49 | 0.34 | 0.93 | 0.83 |
| Minimum | 8.20 | 1.79 | -5.11 | -3.72 |
| Maximum | 10.41 | 3.42 | -0.82 | 0.67 |
Table 2: J°air extrapolated to air saturation and J°50 calculated at 50 μM O2 concentration. Pooled data of instrumental background tests in Series 2 (pce) and 3 (imt) and before TIP2k titrations (0.5 mL: N = 48; TIP2k: N = 8; 2.0 mL: N = 60).
Supplementary File 1: Sample preparations. Human platelets, human fibroblast, and mitochondria isolated from mouse hearts. Please click here to download this File.
Supplementary Figure 1: Instrumental O2 background test using the TIP2k. Representative traces of the test performed using the TIP2k to titrate Na-dithionite (2.5 mM) in the 0.5-mL chamber. Medium: MiR05, temperature: 37 °C, stirring speed: 750 rpm. Spikes caused by titrations were eliminated. Please click here to download this File.
Supplementary Figure 2: Instrumental background O2 flux J°1 as a function of O2 concentration. Chamber sV (0.5 mL; green, N = 48) and Chamber cV (2.0 mL; blue, N = 60) in Series 2 (pce, circles) and 3 (imt, triangles), and before TIP2k titrations in the 0.5-mL chamber (black circles, N = 8). Red lines: median ± SD. Please click here to download this File.
Supplementary Figure 3: Exponential time constant τ as a function of stirring rotation speed. Individual τ values for the 0.5-mL chamber at 37 °C (N = 2). In the 0.5-mL chamber τ was 2.53 ± 0.05 s at 550 rpm, 2.50 ± 0.05 s at 750 rpm, and 2.47 ± 0.04 s at 850 rpm. Please click here to download this File.
Supplementary Figure 4: O2 consumption of cryopreserved human platelets in the 2.0-mL chamber. Representative trace of the protocol SUIT-003_D018, including oligomycin titrations (Omy). Flux [pmol∙s-1∙mL-1] was corrected for instrumental background O2 flux and divided by cell concentration (164∙106 x∙mL-1). Spikes caused by titrations were eliminated. cO2 was kept above 60 µM by intermittent reoxygenations (air, ‘open’ chamber, blue shade). Sequence of respiratory states (titrations and rates): ce1, routine respiration R of living cells. ce1P, pyruvate as external substrate. ce2Omy10, Omy titrations in 5 nM steps; leak respiration L. ce3U2.0, uncoupler titrations to optimum concentrations of 2 µM; ET capacity E. ce3Glc, glucose 11 mM; E progressively inhibited by uncoupler. ce4Rot, rotenone 0.5 µM inhibiting CI; residual oxygen consumption rox. ce5S, succinate 10 mM; stimulating E in plasma membrane-permeable cells. 1Dig20, digitonin titrations to optimum concentrations of 20 µg·mL-1, for complete plasma membrane permeabilization; succinate-pathway ET capacity SE. 1c, cytochrome c 10 µM; test of mitochondrial outer membrane integrity. 2Ama, antimycin A 2.5 µM inhibiting CIII; rox. Please click here to download this File.
Supplementary Table 1: Chemicals used in the substrate-inhibitor-uncoupler-titration (SUIT) protocols. Abbreviations and stock solution concentrations for the sV and cV chambers. Please click here to download this File.
Supplementary Table 2: Comparison of R1-R0 and J°1 in the 0.5-mL and 2.0-mL chambers. Pooled data of instrumental background tests in Series 2 (pce) and 3 (imt) and before TIP2k titrations (0.5 mL: N = 48; TIP2k: N = 8; 2.0 mL: N = 60). Data were averaged from experimental Series 2 (pce) and 3 (imt) only, which were performed at an average barometric pressure of 94.9 kPa (Innsbruck, Austria), excluding data from Series 1 (ce) obtained at sea level. The same type but different individual POS were used in the 0.5-mL and 2.0-mL chambers. Therefore, the variability between sensors must be considered when comparing the sV and cV chambers. While J°1 = 2.26 ± 0.41 pmol∙s-1∙mL-1 obtained experimentally for the 2.0-mL chamber corresponded closely to the calculated value, the experimental J°1 = 8.48 ± 0.53 pmol∙s-1∙mL-1 for the 0.5-mL chamber was lower than expected. This was explained by the following observations. After closing the chamber, the higher background O2 flux in the 0.5-mL chamber lowers the O2 concentrations at the marks for J°1 set at comparable time intervals (Figure 1). Oxygen concentration at J°1 was on average 4.06 % and 1.72 % below air saturation in the 0.5-mL and 2.0-mL chamber, respectively (Supplementary Figure 2, Supplementary Table 2). At lower cO2, the diminished O2 consumption by the sensor and some O2 back diffusion reduce the experimentally determined J°1. Please click here to download this File.
Supplementary Table 3: Oxygen concentration [µM] at which calibration (R1) and J°1 were obtained and their % difference. Pooled data of instrumental background tests in Series 2 (pce) and 3 (imt) and before TIP2k titrations (0.5 mL: N = 48; TIP2k: N = 8; 2.0 mL: N = 60). Please click here to download this File.
Supplementary Table 4: Measured and expected J°1 in the 2.0-mL chamber. Independent series of instrumental background tests with O2k series A (with titanium stoppers13), V = 2.0 mL (37 °C, NaCl solution with O2 solubility factor 0.92; N = 52). nO2/Qe = 106/(96485.33·4) = 2.591 pmol∙µC-1 = 2.591 pmol∙s-1∙µA-1. Based on the assumption that O2 back diffusion is negligible at cO2,1, which is true only at cO2,1 ~ cO2*. Please click here to download this File.
Supplementary Table 5: Linear regression residuals (absolute values [pmol O2∙s-1∙mL-1]) calculated for each instrumental O2 background test. Pooled data of instrumental background tests in Series 2 (pce) and 3 (imt) and before TIP2k titrations. Please click here to download this File.
Discussion
The amount of sample available for respirometry is frequently limited, e.g., in studies of biopsies, primary cells, or slowly growing cell cultures with low cell counts1. Moreover, respiratory activities are depressed due to mitochondrial injuries11 or when investigating mitochondrial pathways with low capacities, such as fatty acid oxidation12. In these cases, a low respirometric chamber volume offers advantages for the resolution of O2 flux. However, instrumental background O2 fluxes increase at lower chamber volumes and induce errors when not measured reliably and not properly corrected for as a function of O2 concentration. Replicability of instrumental O2 background tests and background corrections are particularly important for low chamber volumes. Nearly identical values of the theoretical (J°R1) and experimental (J°air) O2 flux provide evidence for the accuracy of the polarographic measurement with 4 e-/O2 at the cathode reaction of the POS. The difference between J°R1 and J°air was 1.64 ± 0.43 and 0.22 ± 0.31 pmol∙s-1∙mL-1 in the sV and cV chamber, respectively, indicating a precision in the measurements that falls within the limit of detection of the 2.0-mL chamber (±1 pmol∙s-1∙mL-1)28. With the same type of polarographic oxygen sensors in the 2.0-mL and 0.5-mL chamber, the volume-specific background O2 flux increased 4-fold in inverse proportion to the chamber volume, and the variability was nearly identical in the two chamber volumes, with SD of 0.5 and 0.3 pmol∙s-1∙mL-1 for J°air and 0.9 and 0.8 pmol∙s-1∙mL-1 for J°50 in the sV and cV chamber, respectively (Table 2). At minimum respiratory activities - for which the small volume chamber was designed - even small background effects become significant (Supplementary Table 3; Supplementary Figure 2). Therefore, routine assessment of instrumental background O2 flux (Figure 1) is required to apply the proper correction28.
High and constant stirring of the medium is required to maintain a homogenous system and guarantee a stable oxygen signal. The stirring speed of 750 rpm is established for the 2.0-mL chamber, but the optimum speed was not known in the 0.5-mL chamber. The different geometries of the glass chamber and stirrer bar (Table 2) require an independent evaluation of the optimum stirring speed. The oxygen sensors responded to changes in stirring speed between 550 rpm and 950 rpm, with a small deviation from the O2 signal R1 at 750 rpm, independent of chamber volume. The exponential time constant τ evaluated for the Chamber sV was in agreement with τ reported for the 2.0-mL chamber at the same stirring speed13. These results suggest that stirring is equally effective in both chamber geometries and that the default stirring speed of 750 rpm (2.0-mL chamber) can be applied to the 0.5-mL chamber. In both the 'open' and 'closed' chamber configurations, the 0.5-mL chamber had a higher signal-to-noise ratio, suggesting higher accuracy as an advantage of the 0.5-mL chamber (Figure 5), although the effect of individual POS variability cannot be excluded. Since noise did not increase when lowering the stirring speed from 750 rpm to 550 rpm, reducing the stirring speed to 550 rpm in the 0.5-mL chamber may be beneficial to minimize shear stress without compromising the signal-to-noise ratio.
Nearly identical O2 consumption rates were measured in the 0.5-mL and 2.0-mL chambers in three experimental models when the appropriate background correction was applied. The results obtained with small platelets of 2 µm in diameter42, living and permeabilized fibroblasts, and isolated mitochondria suggest that consistent respiratory rates can be expected to be obtained in the 0.5-mL and 2.0-mL chambers in a wide range of cell types and mitochondrial preparations. Permeabilized muscle fibers, however, have not been tested in the present study. Accurate measurement of rox requires control of oxygen levels40 and high instrumental resolution1. Volume-specific O2 flux of rox may be as low as the limit of detection. Reoxygenations are not necessary when low cell counts or generally low amounts of samples are used in an experiment. If necessary, however, it is recommended to perform reoxygenations in respiratory states with low O2 flux to avoid a rapid decline of O2 concentration during the period required for stabilization of O2 flux. Stabilization of O2 flux after reoxygenations takes longer in the 0.5-mL chamber.
As a contribution to quality control, particular attention must be given to the dilution of the sample in suspension during partial volume replacement. After removal of the fully inserted stopper, the total volume V' of respiration medium in the chamber is given by the experimental volume V and the stopper capillary volume Vstc (Table 2). Therefore, the stock volume VJ.i is diluted in the actual volume V', which is larger than V, resulting in a dilution factor V/V' of 0.5/0.54 = 0.926 and 2.0/2.07 = 0.966 in the 0.5-mL and 2.0-mL chambers, respectively (Figure 2). In the experiments with platelets, a prototype stopper was used for the Chamber sV with a capillary dead volume of 0.05 mL, corresponding to a dilution factor of 0.909.
Nearly four times lower amounts of living cells, permeabilized cells, and isolated mitochondria are required in the 0.5-mL than in the 2.0-mL chamber at identical sample concentrations (amount per volume), yielding quantitatively comparable results of respiratory O2 consumption normalized for cell count or protein mass. This indicates that the Chamber sV is a valuable tool for studies in which the amount of available samples is limited. On the other hand, the application of an identical amount of sample in Chamber sV increases volume-specific O2 flux and thus reduces the uncertainty of measurements when respiratory activities are low.
The oxygen regime in the present study was restricted to the O2 range of air saturation to 30 µM. Applicability at oxygen levels beyond this range requires further evaluation to investigate mitochondrial function at tissue normoxia or hypoxia43 and permeabilized tissues at hyperoxia9. Several multisensor configurations of the Oroboros NADH- and Q- Modules; pH, NO, and TPP+-electrodes10,44 - cannot be accommodated in the Chamber sV and require the 2.0-mL chamber.
Disclosures
EL is an employee of Oroboros Instruments. EG is the founder and CEO of Oroboros Instruments.
LFGS was employed by Oroboros Instruments during the project. EÅF and EE are employees of Abliva AB, Lund, Sweden, which holds a commercial agreement with Oroboros Instruments.
LR declares no conflict of interest.
Acknowledgements
We thank Manuela Passrugger for collecting the data on isolated mitochondria, Patrizia Guerth for technical support on testing the stirring rotation speed and Mateus Grings for analysis of the time constant from the stirrer tests. We thank our partner, WGT Elektronik GmbH & Co KG, Kolsass, Austria, for information on technical data of the glass chambers, stoppers, and magnetic field strength. We thank Luiza HD Cardoso, Alejandra Romero-Martinez, Ondrej Sobotka, Alba Timon-Gomez, and Jaime Willis for their comments. This work was partially funded by the European Union's Horizon 2020 research and innovation program under grant agreement No. 859770, NextGen-O2k project. Contribution to COST Action CA15203 MitoEAGLE with the financial support of Short-Term Scientific missions (LFGS, LR).
Materials
| Name | Company | Catalog Number | Comments |
|---|---|---|---|
| Anaconda3 | Anaconda Software Distribution | https://www.anaconda.com/ | software |
| ADP | Merck, Germany | 117105 | |
| Antibiotics-antimycotics 100x | Biosera, France | XC-A4110 | CAUTION H317 May cause an allergic skin reaction |
| Antimycin A | Sigma-Aldrich, USA | A8674 | CAUTION H300 Fatal if swallowed, H400 short-term (acute) aquatic hazard |
| Ascorbate | Sigma-Aldrich, USA | A7631 | |
| ATP | Sigma-Aldrich, USA | A 2383 | |
| BSA fatty acid-free | Sigma-Aldrich, USA | A 6003 | bovine serum albumin |
| CaCO3 | Sigma-Aldrich, USA | C 4830 | |
| CCCP | Sigma-Aldrich, USA | C2759 | carbonyl cyanide m-chlorophenyl hydrazone CAUTION H301 + H311 + H331 Toxic if swallowed, in contact with skin or if inhaled |
| Countess Automated cell counter | Thermo Fisher Scientific, USA | AMQAX100 | |
| Cytochrome c | Sigma-Aldrich, USA | C7752 | |
| DatLab | Oroboros Instruments, Austria | Version 7.4 | Software for data acquisition and analysis |
| DatLab | Oroboros Instruments, Austria | Version 8.1 | Software for data acquisition and analysis |
| DC Protein Assay | Bio-Rad, USA | 5000112 | Protein assay kit; CAUTION H314 Causes severe skin burns and eye damage |
| Digitonin | Sigma-Aldrich, USA | D5628 | CAUTION H301 Toxic if swallowed |
| Dithiothreitol | Sigma-Aldrich, USA | D 0632 | CAUTION H318 Causes serious eye damage |
| DMEM | Pan Biotech, Germany | P04-05551 | Dulbecco’s modified Eagle’s medium |
| DMSO | Sigma-Aldrich, USA | D2650 | dimethylsulfoxide |
| DPBS | Lonza Bioscience, Switzerland | LONBE17-512F | Calcium-free Dulbecco’s phosphate-buffered saline |
| EGTA | Sigma-Aldrich, USA | E 4378 | |
| FBS | Thermo Fisher Scientific, USA | A5256701 | fetal bovine serum |
| Glucose | Sigma-Aldrich, USA | G7528 | |
| Glutamate | Sigma-Aldrich, USA | G1626 | |
| Glycerophosphate | Santa Cruz Biotechnology | sc-215789 | |
| Heraeus Multifuge 3s Large | Thermo Fisher Scientific, USA | HM3S | centrifuge |
| Hettich Rotina 380R | Andreas Hettich GmbH & Co. KG, Germany | 1701 | centrifuge |
| Imidazole | Honeywell Fluka, Austria | 56750 | CAUTION H302 Harmful if swallowed, H314 Causes severe skin burns and eye damage, H360D May damage the unborn child |
| jamovi | The jamovi project | Version 2.3.13 | software |
| K+-MES | Sigma-Aldrich, USA | M 8250 | |
| Leucosep tube | Greiner Bio-One GmbH, Austria | Z642843-300EA | centrifuge tube with polyethylene barrier |
| Malate | Sigma-Aldrich, USA | M1000 | CAUTION H319 Causes serious eye irritation. |
| Mannitol | Sigma-Aldrich, USA | M 4125 | |
| MgCl2 | Scharlau, Spain | MA 0036 | |
| MiR05-Kit | Oroboros Instruments, Austria | 60101-01 | mitochondrial respiration medium |
| Mixer | Swelab Instruments, Sweden | 440S | rocking table |
| Mr. Frosty Freezing Container | Thermo Fisher Scientific, USA | 5100-0001 | freezing container |
| Oroboros | Oroboros Instruments, Austria | the NextGen-O2k and the O2k are addressed collectively with the term ‘Oroboros’ | |
| Oroboros Chamber cV | Oroboros Instruments, Austria | 23100-01 | classic volume chamber |
| Oroboros Chamber sV | Oroboros Instruments, Austria | 33100-01 | small volume chamber |
| Oroboros TIP2k-Module | Oroboros Instruments, Austria | 11100-03 | Titration-Injection microPump |
| O2-Zero Powder | Oroboros Instruments, Austria | 26600-02 | Na-dithionite CAUTION H251 Self-heating: may catch fire, H302 Harmful if swallowed, H319 Causes serious eye irritation |
| octanoylcarnitine | Biotrend - APExBIO Technology, Germany | B6371 | |
| Oligomycin | Sigma-Aldrich, USA | O4876 | |
| Phosphocreatine | Sigma-Aldrich, USA | P 7936 | |
| Pyruvate | Sigma-Aldrich, USA | P2256 | CAUTION H317 May cause an allergic skin reaction |
| Rotenone | Sigma-Aldrich, USA | R8875 | CAUTION H300 Fatal if swallowed |
| Skin fibroblast cell lines | ATCC, USA | ||
| Sodium azide | Sigma-Aldrich, USA | S2002 | CAUTION H300 + H310 + H330 Fatal if swallowed, in contact with skin or if inhaled |
| Subtilisin A | Sigma-Aldrich, USA | P 5380 | CAUTION H318 - Causes serious eye damage, H334 - May cause allergy or asthma symptoms or breathing difficulties if inhaled |
| Succinate | Sigma-Aldrich, USA | S2378 | |
| Sucrose | Sigma-Aldrich, USA | S 7903 | |
| Swelab Alfa blood cell counter | Boule Diagnostics AB, Sweden | 1420041 | |
| Taurine | Sigma-Aldrich, USA | T 0625 | |
| Tecan Infinite TM F200 | Tecan, Switzerland | spectrophotometer | |
| TMPD | Sigma-Aldrich, USA | T3134 | N,N,N',N'-Tetramethyl-p-phenylenediamine dihydrochloride CAUTION H315 Causes skin irritation, H319 Causes serious eye irritation |
| Trypsin | Sigma-Aldrich, USA | T4799 | CAUTION H334 May cause allergy or asthma symptoms or breathing difficulties if inhaled |
| Vacuette | Greiner Bio-One GmbH, Austria | 15452520 |
References
- Zdrazilova, L., Hansikova, H., Gnaiger, E. Comparable respiratory activity in attached and suspended human fibroblasts. PLoS ONE. 17 (3), e0264496(2022).
- Schöpf, B., et al. OXPHOS remodeling in high-grade prostate cancer involves mtDNA mutations and increased succinate oxidation. Nat Commun. 11 (1), 1487(2020).
- Meszaros, A. T., et al. The predictive value of graft viability and bioenergetics testing towards the outcome in liver transplantation. Transplant International. 37, 12380(2024).
- Doerrier, C., Garcia-Souza, L. F., Krumschnabel, G., Wohlfarter, Y., Mészáros, A. T., Gnaiger, E. High-resolution fluorespirometry and OXPHOS protocols for human cells, permeabilized fibers from small biopsies of muscle, and isolated mitochondria. Methods Mol Biol. 1782, 31-70 (2018).
- Gnaiger, E., Steinlechner-Maran, R., Méndez, G., Eberl, T., Margreiter, R. Control of mitochondrial and cellular respiration by oxygen. J Bioenerg Biomembr. 27 (6), 583-596 (1995).
- Gnaiger, E., Méndez, G., Hand, S. C. High phosphorylation efficiency and depression of uncoupled respiration in mitochondria under hypoxia. Proc Natl Acad Sci. 97 (20), 11080-11085 (2000).
- Gnaiger, E. Oxygen Conformance of Cellular Respiration. Hypoxia. Advances in Experimental Medicine and Biology. Roach, R. C., Wagner, P. D., Hackett, P. H. , Springer. Springer, Boston, MA. (2003).
- Harrison, D. K., Fasching, M., Fontana-Ayoub, M., Gnaiger, E. Cytochrome redox states and respiratory control in mouse and beef heart mitochondria at steady-state levels of hypoxia. J Appl Physiol. 119 (10), 1210-1218 (2015).
- Pesta, D., Gnaiger, E. High-resolution respirometry: OXPHOS protocols for human cells and permeabilized fibers from small biopsies of human muscle. Methods Mol Biol. 810, 25-58 (2012).
- Komlódi, T., Cardoso, L. H. D., Doerrier, C., Moore, A. L., Rich, P. R., Gnaiger, E. Coupling and pathway control of coenzyme Q redox state and respiration in isolated mitochondria. Bioenerg Commun. 2021.3, (2021).
- Suomalainen, A., Nunnari, J. Mitochondria at the crossroads of health and disease. Cell. 187 (11), 2601-2627 (2024).
- Cardoso, L. H. D., et al. Fatty acid β-oxidation in brain mitochondria: Insights from high-resolution respirometry in mouse, rat and Drosophila brain, ischemia and aging models. Biochim Biophys Acta Mol Basis Dis. 1871, 167544(2025).
- Gnaiger, E. Bioenergetics at low oxygen: dependence of respiration and phosphorylation on oxygen and adenosine diphosphate supply. Respir Physiol. 128 (3), 277-297 (2001).
- Gnaiger, E. Polarographic Oxygen Sensors, the Oxygraph and High-Resolution Respirometry to Assess Mitochondrial Function. Mitochondrial dysfunction in drug-induced toxicity. Dykens, J. A., Will, Y. , John Wiley & Sons, Inc. Hoboken, NJ. 327-352 (2008).
- Gnaiger, E. Mitochondrial pathways and respiratory control. An Introduction to OXPHOS analysis. Bioenerg Commun. 2020.2, (2020).
- Diaz, E. C., Adams, S. H., Weber, J. L., Cotter, M., Børsheim, E. Elevated LDL-C, high blood pressure, and low peak VO₂ associate with platelet mitochondria function in children-The Arkansas Active Kids Study. Front Mol Biosci. 10, 1136975(2023).
- Ehinger, J. K., Morota, S., Hansson, M. J., Paul, G., Elmér, E. Mitochondrial dysfunction in blood cells from amyotrophic lateral sclerosis patients. J Neurol. 262 (6), 1493-1503 (2015).
- Heimler, S., et al. Platelet bioenergetics are associated with resting metabolic rate and exercise capacity in older adult women. Bioenerg Commun. 2022.2, (2022).
- Palacka, P., et al. Platelet mitochondrial bioenergetics reprogramming in patients with urothelial carcinoma. Int J Mol Sci. 23 (1), 388(2021).
- Fischer, C., et al. Mitochondrial respiration in response to iron deficiency anemia: Comparison of peripheral blood mononuclear cells and liver. Metabolites. 12 (3), 270(2022).
- JedIicka, J., et al. Impact of aging on mitochondrial respiration in various organs. Physiol Res. 71 (Suppl. 2), S227-S236 (2022).
- Westerlund, E., et al. Correlation of mitochondrial respiration in platelets, peripheral blood mononuclear cells and muscle fibers. Heliyon. 10 (5), e26745(2024).
- Hütter, E., Renner, K., Pfister, G., Stöckl, P., Jansen-Dürr, P., Gnaiger, E. Senescence-associated changes in respiration and oxidative phosphorylation in primary human fibroblasts. Biochem J. 380 (3), 919-928 (2004).
- Yépez, V. A., et al. OCR-Stats: Robust estimation and statistical testing of mitochondrial respiration activities using Seahorse XF Analyzer. PLoS One. 13 (7), e0199938(2018).
- Gnaiger, E. Bioenergetic cluster analysis - mitochondrial respiratory control in human fibroblasts. MitoFit Preprints. 2021.8, (2021).
- Palmer, J., Tandler, B., Hoppel, C. Biochemical properties of subsarcolemmal and interfibrillar mitochondria isolated from rat cardiac muscle. J Biol Chem. 252, 8731-8739 (1977).
- Lai, N. M., Kummitha, C., Rosca, M. G., Fujioka, H., Tandler, B., Hoppel, C. L. Isolation of mitochondrial subpopulations from skeletal muscle: Optimizing recovery and preserving integrity. Acta Physiol. 225 (2), e13182(2019).
- Baglivo, E., Cardoso, L. H., Cecatto, C., Gnaiger, E. Statistical analysis of instrumental reproducibility as internal quality control in high-resolution respirometry. Bioenerg Commun. 2022.8, (2022).
- Mela, L., Seitz, S. Isolation of mitochondria with emphasis on heart mitochondria from small amounts of tissue. Methods Enzymol. 55, 39-46 (1979).
- Cardoso, L. H. D., Doerrier, C., Gnaiger, E. Magnesium Green for fluorometric measurement of ATP production does not interfere with mitochondrial respiration. Bioenerg Commun. 2021.1, (2021).
- Gnaiger, E. The elementary unit — count and numbers in the International System of Units. BEC preprints. , (2025).
- Vernerova, A., et al. Mitochondrial respiration of platelets: Comparison of isolation methods. Biomedicines. 9 (12), 1859(2021).
- Oroboros Instruments SUIT-003 O2 ce-pce D018. , https://wiki.oroboros.at/index.php/SUIT-003_O2_ce-pce_D018 (2024).
- Oroboros Instruments SUIT-001 O2 ce-pce D004. , https://wiki.oroboros.at/index.php/SUIT-001_O2_ce-pce_D004 (2024).
- Timón-Gómez, A., et al. Bioenergetic profiles and respiratory control in mitochondrial physiology: Precision analysis of oxidative phosphorylation. Exp Physiol. , 1-33 (2025).
- Oroboros Instruments SUIT-002 O2 ce-pce D007. , https://wiki.oroboros.at/index.php/SUIT-002_O2_ce-pce_D007 (2024).
- Oroboros Instruments SUIT-002 O2 mt D005. , https://wiki.oroboros.at/index.php/SUIT-002_O2_mt_D005 (2024).
- The Jamovi Project jamovi (Version 2.3.13). , https://www.jamovi.org/ (2024).
- Gnaiger, E. Preface: A biologist´s view. Polarographic Oxygen Sensors. Aquatic and Physiological Applications. Gnaiger, E., Forstner, H. , Berlin, Heidelberg, New York. Springer. V-VII (1983).
- Hütter, E., Renner, K., Jansen-Dürr, P., Gnaiger, E. Biphasic oxygen kinetics of cellular respiration and linear oxygen dependence of antimycin A inhibited oxygen consumption. Mol Biol Rep. 29 (1/2), 83-87 (2002).
- Oroboros Instruments Cell count and normalization in HRR. , https://wiki.oroboros.at/index.php/Cell_count_and_normalization_in_HRR (2020).
- Williams, O., Sergent, S. R. Histology Platelets. , StatPearls Pubs. Treasure Island, FL. (2022).
- Donnelly, C., et al. The ABC of hypoxia - what is the norm. Bioenerg Commun. 2022.12.V2, (2022).
- Aguirre, E., Rodríguez-Juárez, F., Bellelli, A., Gnaiger, E., Cadenas, S. Kinetic model of the inhibition of respiration by endogenous nitric oxide in intact cells. Biochim Biophys Acta. 1797 (5), 557-565 (2010).
Reprints and Permissions
