This study introduces a novel approach for real-time cardiac mapping using a noninvasive, imageless electrocardiographic imaging system. This system enables the acquisition of electrophysiological cardiac maps without requiring pre-procedural computed tomography or magnetic resonance imaging scans, enabling efficient guidance for cardiac procedures such as ablation and cardiac resynchronization therapy implants.
Method Article
Real-Time Cardiac Mapping with a Noninvasive Imageless Electrocardiographic Imaging System
In This Article
Summary
Abstract
Rapid, safe, and effective cardiac mapping is critical for the management of complex arrhythmias, yet current methods face significant limitations. The 12-lead electrocardiogram (ECG), while essential for initial diagnosis, lacks the spatial resolution and depth needed to guide advanced procedures such as catheter ablation or cardiac resynchronization therapy device implantation. On the other hand, invasive mapping techniques provide detailed electrical activity but require multiple catheter placements, increasing procedural risks and complexity. These methods are time-consuming, expensive, and offer limited real-time assessment, especially in dynamic arrhythmias like atrial fibrillation (AF), unstable arrhythmia, and cardiac resynchronization therapy (CRT).
This study introduces a noninvasive, imageless electrocardiographic imaging (Imageless-ECGI) system designed to complement traditional methods by providing real-time, beat-to-beat cardiac maps. Without the need for pre-procedural imaging, this system captures high-resolution electrical activity across the entire heart, offering a safer and more efficient alternative to invasive mapping. By combining the immediacy of surface recordings with the spatial accuracy of modern computational models, the Imageless-ECGI system bridges the gap between traditional ECG and invasive mapping, potentially transforming the workflow in electrophysiology labs.
Introduction
The need for noninvasive electrophysiological mapping has become increasingly important for accurately assessing cardiac activity, particularly in patients undergoing complex arrhythmia procedures, such as atrial fibrillation (AF) and ventricular tachycardia (VT) ablation, or during the implantation of pacemakers and cardiac resynchronization therapy (CRT) devices. Currently, three-dimensional (3D) electroanatomical mapping (EAM) remains the gold standard for guiding operators during catheter ablation1 by providing comprehensive functional maps to characterize arrhythmias2,3. However, EAM is suboptimal for capturing the dynamic spatiotemporal patterns of AF, non-sustained arrhythmias, and the long time and invasive procedure required for mapping makes it impractical for use in CRT procedures.
Traditional noninvasive methods, such as the 12-lead electrocardiogram (ECG), while highly accurate for identifying specific arrhythmia foci (e.g., outflow tract or cusp VT), offer limited insight into the global electrical behavior of the heart. This limitation is especially evident when real-time mapping is required to guide interventions in dynamic and complex arrhythmias, where precise localization of arrhythmogenic areas is crucial for successful outcomes. Noninvasive mapping could play an important role in enhancing pre-procedural planning and providing real-time feedback during electrophysiological interventions.
To support electrophysiologists pre-procedurally, advances in cardiac imaging modalities, such as computed tomography (CT) and magnetic resonance imaging (MRI), have proven effective in providing detailed structural information, including wall thickness4 and myocardial fibrosis5,6,7,8. However, these modalities focus on anatomical and structural features, leaving a gap in functional electrical mapping. Additionally, obtaining high-quality cardiac images requires specialized scanning protocols, trained personnel, and complex post-processing methods like advanced segmentation and precise tissue characterization, particularly for detecting cardiac fibrosis.
Classical electrocardiographic imaging (ECGI) systems have emerged as a noninvasive option, offering promising results by reconstructing cardiac electrical activity based on body surface potentials (BSP)9,10,11,12. Despite their potential, ECGI systems face notable limitations13,14. First, they require pre-procedural CT scans to map electrode positions onto cardiac geometries, making their clinical routine use less feasible. Second, traditional regularization methods used in solving the inverse problem of cardiac mapping often introduce non-physiological propagation patterns, limiting their accuracy in clinical settings.
The goal of this study was to describe the features and procedures of a novel noninvasive ECGI system capable of real-time mapping without the need for CT or MRI15, known as Imageless ECGI. We explored the advancements of Imageless ECGI and presented potential clinical applications for electrophysiological mapping, overcoming the limitations of current techniques like EAM, 12-lead ECG, and classical ECGI in managing complex arrhythmia procedures. This approach enables the creation of cardiac maps within minutes of the patient's arrival, streamlining workflow and reducing preparation time. Additionally, the system uses advanced signal processing algorithms to generate accurate physiological propagation patterns, improving arrhythmia localization and procedural outcomes.
Protocol
The methodology has been prospectively validated in a multicenter observational clinical study. The study was conducted in accordance with the Declaration of Helsinki and the ethical standards of the institutions involved. The study protocol, SAVE-COR (NCT05772182), was approved by the Ethical Committees of Hospital Universitario Gregorio Marañón, Hospital Clínic de Barcelona, and Hospital Universitari i Politècnic La Fe, and informed consent was obtained from all patients.
NOTE: Detailed descriptions of the inclusion and exclusion criteria are:
Inclusion criteria: (i) Indication for an invasive electroanatomical study and/or implantation of intracavitary pacing devices. (ii) Having obtained and signed informed consent for inclusion in the study.
Exclusion criteria: (i) <18 years of age. (ii) Inability to undergo endocardial catheterization (e.g., pregnant or breastfeeding women). (iii) Physical or mental inability to understand and accept the informed consent. (iv) Inability to stand upright to enable 3D torso reconstruction required for the ECGI system. (v) Patients with congenital pathologies.
1. Pre-procedural real-time imageless ECGI system preparation
- Verify that the biopotential amplifier (Figure 1A) is fully charged and place it at the end of the electrophysiology (EP) room table, near where the patient's feet would be positioned.
NOTE: The biopotential amplifier (see Table of Materials) is an isolated 128-channel device responsible for amplifying and digitizing the electrical signals collected by the electrodes. - Verify that the right and left cables are not damaged by inspecting the amplifier connectors at one end and the black sockets, where the sensor vest is connected, at the other end (Figure 1B).
NOTE: The right and left cables (see Table of Materials) are 1.5 m long and transmit electrical signals from the sensor vest to the biopotential amplifier. - Plug the right and left connector cables into the biopotential amplifier (Figure 1C). Each cable is associated with a plug that is distinguished by a number, which is the same for both the cable and the amplifier.
- Verify that the 3D scanner platform is fully charged and open the 3D scanning application.
NOTE: The 3D scanning application is software running on a 3D scanner platform (see Table of Materials) that utilizes an infrared structural light camera to generate a 3D model reconstruction of the patient's torso. The application also automatically detects the location of the electrode quick response (QR) codes. - Verify that the PC workstation (see Table of Materials) has the imageless ECGI software user interface (UI) installed and is fully charged.
NOTE: The Imageless ECGI software (see Table of Materials) incorporates signal processing algorithms to estimate the cardiac geometry and deliver valuable information for diagnosing and treating cardiac arrhythmias or guiding cardiac device implantation procedures16,17,18,19. The system's UI allows users to visualize, select, and analyze electrocardiographic signals, creating interactive maps of epicardial activity that enable noninvasive evaluation of cardiac function. - Connect the biopotential amplifier to the workstation using an isolated Ethernet cable (see Table of Materials). Insert one end into the amplifier's Ethernet port and the other into the workstation.
NOTE: The isolated Ethernet cable transmits electrical signals from the biopotential amplifier to the workstation. - Select a sensor vest (see Table of Materials), inspect the packaging, and verify that the sealing is undamaged. Do not use the sensor vest if the packaging is opened or damaged.
- Open the sensor vest packaging and verify the four vest components are inside. Choose another sensor vest packaging if one of the components is missing.
NOTE: The sensor vest is a high-density electrode array with 128 silver electrodes that enable simultaneous mapping of surface electrical activity across the patient's entire torso. The vest is radiolucent and contains four patches that cover the anterior and posterior left and right surfaces of the torso. Each electrode features a QR code on the front, allowing for automatic electrode position identification.
2. Pre-procedural patient preparation
- Admit the patient to the hospital on the same day as the electrophysiological study or device implantation.
- Position the patient either standing or sitting on a chair or the EP table and ensure the entire torso area is free of clothing.
- Perform a visual inspection of the patient's skin to check whether the patient has shores, wounds, or any other skin condition to avoid attaching electrodes to these areas.
- Optionally, groom the torso for individuals with significant hair to minimize noise artifacts and reduce discomfort during sensor vest removal.
- Correctly position the four parts of the sensor vest (Front Right, Front Left, Back Right, and Back Left) on the patient's torso (Figure 2A) and adjust the vest to the patient's size by folding the connections between the electrodes when necessary.
- Optionally, for CRT procedures, avoid placing electrodes in the area where the cardiac implant will be inserted, often located on the left upper chest.
NOTE: Connections with printed dashes can be safely broken if needed, as no active tracks are present in those areas. - Place the Right-Leg-Driven (RLD) and reference (REF) electrodes of the sensor vest on the right and left legs, respectively, as far away from the other vest electrodes as possible.
- Ensure adequate room lighting and ensure that no objects are within a 1.5 m diameter around the patient's torso, as they may interfere with or distort the 3D torso reconstruction.
- Position the patient with their arms over the head to prevent interference with the 3D torso reconstruction, as seen in Figure 2C.
- Obtain the 3D torso reconstruction of the patient.
- Grab the 3D scanner platform and open the 3D scanning application.
- Scan the QR code on the lateral side of the Front Right vest component to validate the sensor vest (Figure 2B), ensuring it is single-use and not expired.
NOTE: Once the QR code is detected the 3D scanning application enables the acquisition of the 3D torso reconstruction. - Position the 3D scanner platform at the torso level in front of the patient, hold it firmly with both hands, and complete a 360° rotation around the patient to acquire the 3D torso reconstruction (Figure 2C).
NOTE: As the scan progresses, the infrared structured light camera from the 3D scanner platform creates a grey-colored 3D closed mesh of the torso, completing the process upon a full rotation. Typically, the 3D torso reconstruction process requires 1-2 min to complete. - Conduct a visual inspection of the 3D torso reconstruction to ensure the entire torso is covered by a gray shadow and that no holes are present in the reconstructed mesh.
- Save the 3D torso reconstruction in the application once the scan is finished.
- Have the patient lie down on the EP room table.
- Connect the four parts of the sensor vest to the corresponding right and left connector cables (Figure 1D). Attach the front-right and back-right vest connectors to the right cable socket and the front-left and back-left vest connectors to the left cable socket.
- Power on the biopotential amplifier to enable the imageless ECGI software to receive real-time electrophysiological signals.
3. Estimation of the patient's cardiac geometry
- Log in as a user to the real-time Imageless ECGI software installed in the workstation (Figure 3). Provide a username and password.
- Click on Add Patient button and introduce identification details to registry a new patient in the Home Window of the UI (Figure 4). Then, create a new session associated with the patient, providing the type of procedure and the following basal data: sex, age, height, and weight.
NOTE: A single patient can have multiple sessions. For example, in clinical studies with follow-ups, if a patient undergoes a second ECGI registration, a new session can be created without adding the patient again. - Connect the 3D scanner platform to the workstation using a USB-C cable.
- Click the Load Torso Scan button and upload the 3D torso reconstruction in the Torso Geometry Window (Figure 5).
NOTE: The software will automatically detect the localization of the 128 electrodes from the sensor vest. Each vest component has different electrode colors: Front Right = red, Front Left = blue, Back Right = pink, and Back Left = orange. - Optionally, manually adjust electrode positions by clicking each electrode and repositioning it on the torso surface.
- Select the Compute Geometry button and the Estimate Heart Geometry option to estimate the patient's cardiac geometry in the Torso Geometry Window (Figure 5).
NOTE: The software estimates cardiac geometry using a methodology based on a statistical shape model (SSM) (Figure 6A), as detailed in previous literature20. The algorithm first processes the patient's 3D torso reconstruction and basal data (sex, age, height, and weight) as input. Subsequently, the SSM, incorporating MRI-based torso and cardiac geometries, iteratively adjusts to fit the patient's 3D torso mesh. This determines the optimal heart geometry, position, and orientation within the patient's body (Figure 6B). This process eliminates the need for pre-procedural CT or MRI, enabling the generation of the first noninvasive cardiac map within 10-15 min. It is important to note that a pop-up message informs the user if the 3D torso reconstruction lacks sufficient resolution or contains any artifacts that could affect the accuracy of the estimation results.
4. Noninvasive imageless ECGI mapping for guiding conduction system pacing implant for cardiac resynchronization therapy (CSP-CRT) in real-time (case 4)
- Go to the Amplifier Window and click on the Connect Amplifier button to start acquiring real-time electrophysiological signals (Figure 7). Click on the different leads to visualize the signals in the amplifier screen.
- Go to the Real-Time Window (Figure 8) to obtain real-time noninvasive cardiac mapping.
NOTE: The Real-Time Window enables the visualization of real-time signals, excludes noisy signals, creates temporal makers, automatically delineates analysis segments (e.g., P wave and QRS complex), and computes and displays noninvasive ECGI maps. - Exclude noisy signals by clicking the 128-lead view button, selecting User Only option as noisy leads selection mode, and double-clicking on noisy signals to exclude them before generating the ECGI map. This improves the mapping computation quality, as ECGI is an ill-posed problem21.
NOTE: Sensor vest leads displayed in green indicate good-quality signals and are used for inverse problem computation, while leads shown in red are noisy and are excluded from the analysis (Figure 8A). - Click the 12-lead view button to visualize an estimated 12-lead ECG in real time (Figure 8B).
- Ensure the RT ON button is active to automatically update signals in the signal analysis section (Figure 8C). This option automatically triggers and defines the onset and offset of the QRS complex to be analyzed.
NOTE: The RT button can be switched to RT OFF mode to freeze the signals, allowing the user to manually delineate the QRS complex when the system's automatic delineation is suboptimal. - Configure the ECGI activation mapping analysis by clicking the Options button to automatically generate an optimal basal rhythm map for the CSP-CRT procedure:
- Select the Analyze Ventricle option to only map the ventricles.
- Select wavelet based17 analysis option for the Activation Times Algorithm.
- Select Average Beat option for the Mapping Type feature to calculate the average wave of the last 10 QRS complexes.
- Leave the default settings for the Offset Correction, Beat Number, and Sync Option features.
- Select two panels option in the maps visualization section and ensure that the left-map is set to Update mode, so it continuously updates with each newly average QRS complex analyzed.
- Visualize the bi-ventricular basal Activation map on the left side (Figure 8D left panel). The system automatically calculates the transfer matrix between the torso and heart meshes to reconstruct the epicardial electrical activity of the heart based on the boundary element method22,23,24.
NOTE: Activation map depicts the temporal progression of depolarization across the cardiac epicardium, aiding in pinpointing activation origins and identifying reentrant or focal patterns. Activations are calculated by (1) transforming each reconstructed electrogram into a sum of sinusoidal wavelets for all the negative slope time samples and amplitude proportional to the slope at that time and (2) selecting the instant of the maximum amplitude of the transformed signal as the instant of activation time17. - Write the name and save the basal map by clicking the Save Map button and switch the map to Freeze mode once it is reproducible. A reproducible ECGI map has consistent activation duration and propagation patterns across at least three consecutive maps.
NOTE: In CSP-CRT procedures, the basal map (Figure 12A) will serve as a reference for evaluating bi-ventricular synchrony during the electrode screwing process in the septal region until reaching the left bundle branch area (Figure 12C). - Configure the ECGI activation mapping analysis by clicking the Options button for obtaining optimal maps during the screwing and pacing process in the septal region:
- Select Analyze Ventricle to only map the ventricles.
- Select the wavelet-based analysis option for the Activation Times Algorithm.
- Select the single beat option for the Mapping Type to analyze the wave of a single beat to capture changes in electrocardiographic signals during simultaneous screwing and pacing process at different septal positions.
- Leave the default settings for the Offset Correction, Beat Number, and Sync Option features.
- Set the right-panel map to Update mode to ensure it continuously updates with each newly analyzed single-beat QRS complex during the screwing process.
- Synchronize the colormap range of the right-panel map with the basal map using the Linked Values menu and link their camera positions via the Linked Camera menu (Figure 8D right panel).
NOTE: As the lead is screwed in the septal region, beat-to-beat ECGI maps are automatically generated at various positions (i.e., right ventricular septum, mid-septum, deep septum, and left bundle branch). These maps are compared to the basal map by standardizing the colormap range across all evaluated ECGI maps (Figure 12B, C). This setup allows for clear visualization of changes in activation patterns while the lead is screwed. - Write the name and save each map by clicking the Save Map button whenever a change in the activation pattern is observed during the screwing process in the septal region, continuing until the left bundle branch area is reached.
5. Additional noninvasive imageless ECGI mapping analysis
NOTE: Different cardiac maps can be derived from computed ECGI signals to assess the cardiac substrate, characterize arrhythmias, evaluate CRT, or extract clinically relevant metrics during procedures. The type of maps that can be generated depends on the specific cardiac rhythm being analyzed, with distinct approaches for both regular and irregular rhythms.
- Use the signal analysis section of the Real-Time window to analyze the different rhythms that patients may exhibit during the electrophysiological procedure:
- Analyze regular rhythms, setting single-beat or average beat analysis as Mapping Type feature, when the patient is in a stabilized/regular rhythm, such as sinus rhythm, atrial or ventricular pacing, atrial flutter, or ventricular tachycardia. Compute the Activation map and Conduction Velocity (CV) map from regular rhythm analysis.
- Analyze irregular rhythm, using irregular rhythm beat analysis as Mapping Type feature when the patient is in atrial fibrillation. The system enables the selection of extended AF segments (e.g., 1 min) to suppress QRST complexes and capture the dynamic spatiotemporal patterns of AF. Compute Phase map, Rotor Histogram map, and Dominant Frequency map from irregular rhythm analysis.
- Optionally, press the dropdown menu of the map selection and choose the Activation map if a regular rhythm has been analyzed. See step 4.8 for a detailed Activation map description.
- Optionally, press the dropdown menu of the map selection and choose the Conduction Velocity map if a regular rhythm has been analyzed.
NOTE: The conduction velocity is a metric derived from the activation map. This metric represents the time a wavefront takes to travel through each area of the epicardium. The CV calculation relies on spatial gradients of activation time maps across cardiac surfaces, with velocity vector fields applied to identify regions of effective propagation. Areas with uniform directional vectors indicated stable electrical propagation, while regions with angular disparities, indicating ineffective propagation, are interpolated using a Radial Basis Function25. CV allows to identify areas of conduction deceleration during substrate mapping which are related to arrhythmia recurrence rates17. - Optionally, press the dropdown menu of the map selection and choose the Phase map when analyzing an irregular rhythm.
NOTE: The Phase map tracks the progression of a defined region of the myocardium through the action potential over time. This type of map is dynamic since it represents the progression of the cardiac potential. In the Phase map, the Hilbert Transform is applied to calculate the phase of the ECGI signal. Each phase corresponds to a given state of the action potential over each cycle of the signal (π for resting, π/2 for depolarization, 0 for the plateau, and -π for repolarization)26. - Optionally, press the dropdown menu of the map selection and choose the Rotor Histogram map when analyzing an irregular rhythm.
NOTE: A Rotor Histogram map, derived from a Phase map, is a representation of the most frequent locations of phase singularities, which are areas with concentrated reentrant activity and are displayed in red. In brief, phase singularities are defined as key points where the phase shifts from -π to π. PSs not showing a gradual spatial progression of phases in their surroundings are discarded. Finally, the number of turns for each rotor is quantified to obtain the Rotor Histogram map18. The precision of the algorithm in identifying propagation patterns during AF and the specific regions exhibiting re-entries has been systematically assessed against endocardial mapping, demonstrating a correlation of 71%16. - Optionally, press the dropdown menu of the map selection and select the Dominant Frequency (DF) map when analyzing an irregular rhythm.
NOTE: DF maps display the predominant electrical frequency in each cardiac region over time, helping to identify areas of rapid electrical activity that may serve as drivers of AF. DF are calculated as the frequency with the highest power spectral density in Welch's periodogram27,28. Its analysis allows the detection of areas with high stability or variability in fibrillatory activity within the atria. A histogram is used to evaluate the temporal distribution of dominant frequencies, providing a clear and quantitative representation of the most relevant electrical activity and facilitating the identification of regions with abnormal behavior.
Results
Case 1 - Planning and guiding the catheter ablation of an atypical atrial flutter
This case is a 59-year-old male (body mass index -BMI- 30) patient with a history of hypertension, smoking, heart valve disease, EHRA IIb classification, and a CHA2DS2-VASc score of 1 with an indication of catheter ablation due to atypical atrial flutter (AFL) based on a 12-lead ECG (Figure 9A). The patient had no prior history of catheter ablation. Pre-procedural late gadolinium enhancement MRI (LGE-MRI) revealed extensive fibrosis in the posterior wall of the left atrium (LA), with a normal LA planimetry of 24 cm² and preserved left ventricular ejection fraction (LVEF) of 54%.
Noninvasive imageless ECGI was performed just minutes before catheter introduction via a femoral sheath. A full cycle of the AFL (209 ms), free of QRST complexes, was selected for analysis. The mapping revealed a macro-reentrant circuit around the mitral valve (MV), pinpointing the perimitral line as the optimal ablation target for arrhythmia termination (Figure 9B). Following this, contact-based EAM (Figure 9C) was conducted, which confirmed the propagation pattern observed in the noninvasive Imageless ECGI. Ablation along the perimitral line successfully terminated the arrhythmia.
In this clinical case, the arrhythmia was accurately characterized before invasive EAM, enabling precise localization of the arrhythmia propagation pattern and streamlining the ablation procedure. However, for complex atrial tachycardias, such as AFL or focal tachycardia, Imageless ECGI offers real-time, single-beat mapping, making it particularly valuable in cases of non-sustained arrhythmia. Its adaptability to changes in arrhythmia patterns during a procedure ensures precise and dynamic mapping. Furthermore, while the diagnosis of counterclockwise AFL is usually straightforward from a 12-lead ECG, precisely locating and identifying the mechanism of complex tachyarrhythmias can be challenging. Consequently, performing Imageless ECGI in medical consultation or minutes before can enhance procedural safety and efficiency by providing upstream guidance for catheter ablation planning and eliminating unnecessary transseptal approaches.
Case 2 - Evolution of phase singularities during the catheter ablation of persistent atrial fibrillation
This case is a 63-year-old male patient (BMI 31) with preserved left ventricular ejection fraction (LVEF, 55%), no dilated LA, and New York Heart Association (NYHA) of I was indicated for catheter ablation due to persistent AF. No pre-procedural CT or MRI imaging was performed. The patient had a prior history of catheter ablation for pulmonary vein isolation (PVI) in December 2019.
On arrival, the patient was in AF. Substrate mapping was conducted using imageless ECGI throughout the ablation procedure (Figure 10A). At baseline, ECGI identified phase singularities in the right atrial (RA) lateral wall, right atrial appendage (RAA) base, left atrial posterior wall (PW), and left atrial appendage (LAA) base. These findings correlated with high-frequency and fragmented EGMs observed using endocavitarian catheters, and adequate PVI was confirmed via LA EAM reconstruction. Pulsed-field ablation (PFA) was initiated at the LAA base, resulting in a rhythm change from AF to atypical AFL. Imageless ECGI revealed a perimitral AFL, which was confirmed via entrainment from the distal pole of the coronary sinus catheter. A mitral line was created; however, AF was reinduced. Subsequently, complete PW isolation was achieved. Despite this, imageless ECGI continued to identify significant phase singularities at the RAA base. Following multiple PFA applications targeting this area, sinus rhythm was achieved (Figure 10B).
This clinical case is a representation on how AF presents unique challenges due to the high variability of electrical activity in the atria. Imageless ECGI effectively captured spatial-temporal patterns of AF progression during ablation, with up to three noninvasive maps acquired to guide substrate modification until SR was achieved. Standard treatments, like pulmonary vein isolation, have relatively high recurrence rates29. The key difficulties in AF treatment lie in two areas: (1) determining which patients will benefit from PVI alone, and (2) for those requiring a broader approach, identifying the regions outside the PVI area whose ablation will most effectively reduce arrhythmia recurrence. During sinus rhythm, Imageless ECGI has demonstrated the capability to generate CV maps, which have proven useful in predicting PVI ablation success17. However, in this case, imageless ECGI captured AF dynamics patterns concurrently, providing clinicians with a comprehensive view of how AF propagates and helping to identify key regions driving the arrhythmia. Outcome analysis should focus on the correlation between the ablated Imageless ECGI-detected AF drivers and clinical endpoints, such as long-term arrhythmia-free survival, to further validate its utility in optimizing AF ablation strategies.
Case 3 - Guiding biventricular pacing optimization for cardiac resynchronization therapy
This case is a 67-year-old female patient with non-ischemic dilated cardiomyopathy, an LVEF of 25%, no evidence of late gadolinium enhancement on pre-procedural MRI, with a left bundle branch block (LBBB) on baseline ECG and a QRS duration of 156 ms. The patient was indicated for biventricular pacing (BiVP) as part of CRT.
During the cardiac CRT procedure, real-time imageless ECGI was used to assess ventricular synchronization before and after pacemaker implantation. At baseline rhythm, the patient's latest activation region was identified in the basal-lateral wall of the left ventricle (LV), as depicted in Figure 11A. The ventricular total activation time (TAT) was measured at 116 ms, indicating significant ventricular asynchrony. Different device configurations were evaluated using ECGI, with the optimal setup determined to be BiVP using simultaneous activation of the distal and proximal poles of the LV lead, and an atrioventricular delay of 140 ms. As shown in Figure 11B, the three ventricular pacing points resulted in no late-activated regions, indicating successful synchronization, with an improved TAT of 70 ms.
Cardiac resynchronization therapy aims to restore electrical coordination in the ventricles and improve heart function in patients with heart failure and prolonged QRS. In this case, Imageless ECGI provided real-time mapping that was key in guiding BiVP optimization during the CRT procedure. It enabled precise evaluation of ventricular activation patterns and helped identify the optimal device configuration, ensuring complete ventricular synchronization. The noninvasive nature and immediate feedback of ECGI allowed clinicians to refine lead programming. In contrast, while studies highlight ECGI's value in guiding left ventricular lead placement near the latest activated region30, anatomical constraints may limit its applicability. Basal and final resynchronization parameters determined by ECGI, such as TAT, should be related to clinical outcomes by monitoring the patient's clinical response to CRT over time, including symptom improvement and long-term ventricular function.
Case 4 - Guiding conduction system pacing implant for cardiac resynchronization therapy in real-time
This clinical case is a 45-year-old female patient with severe ventricular dysfunction (LVEF 15%) and LBBB with a QRS duration of 172 ms. The patient was indicated for an implantable cardioverted defibrillator CRT using a conduction system (CSP) pacing approach.
Real-time imageless ECGI was utilized during device implantation to monitor ventricular synchrony throughout the process of electrode screwing in the septal region. As shown in Figure 12, the baseline ECGI map identified the lateral wall of the LV as the latest activated area, with a TAT of 133 ms. Beat-to-beat ECGI mapping during electrode screwing demonstrated progressive improvements in ventricular synchrony, with optimal synchronization achieved upon reaching the left bundle branch, resulting in a TAT of 95 ms.
This case demonstrated the potential of real-time Imageless ECGI to guide LBBP implantation during a CRT procedure. Its single-beat, real-time mapping capabilities allowed analysis of ventricular TAT and resynchronization at each step of lead implantation in the septal region. The system provided a fast, visual, and easy-to-interpret metric, addressing the lack of standardization in electrocardiographic CSP criteria. As well as in BiVP-CRT procedures, further studies are needed to determine whether Imageless ECGI parameters correlate significantly with clinical CRT response and how they compare to 12-lead ECG predictors.
Case 5 - Planning and guiding the catheter ablation of ventricular tachycardia
This case is a 53-year-old male patient (BMI 25.4) with ischemic cardiomyopathy, severe ventricular dysfunction (LVEF 15%), and NYHA class II was referred for a catheter ablation procedure due to recurrent VT. Pre-procedural MRI revealed extensive endocardial fibrosis and arrhythmogenic channels localized to the infero-basal and infero-medial segments of the left ventricle. The patient had a prior history of VT catheter ablation in 2018.
Simultaneous imageless ECGI mapping (Figure 13A) and invasive EAM (Figure 13B) were performed throughout the procedure. The catheter ablation process involved substrate-based mapping during right-ventricular (RV) apical pacing and VT induction using programmed stimulation. Imageless ECGI identified a region of conduction slowing in the infero-basal segment of the LV during sinus rhythm mapping prior to catheter introduction. This finding was consistent with fibrosis observed on the MRI. Subsequent pacing from the right ventricular (RV) apex confirmed conduction slowing in the basal and medial segments of the LV, identifying this area as the likely arrhythmogenic substrate. A VT with a 380 ms cycle length was briefly induced, requiring cardioversion due to hemodynamic instability. Consequently, only a limited number of EAM points were acquired. However, using a single VT cycle, imageless ECGI successfully identified the VT isthmus in the same region where isochronal crowding was observed in the paced maps.
The use of real-time imageless ECGI in this VT case successfully addressed two major clinical challenges in VT management: (1) the precise localization of potential ablation targets during sinus rhythm and (2) the characterization of VT with hemodynamic instability. From a single beat, the VT isthmus was accurately identified in both substrate and arrhythmia activation maps. The system enabled operators to identify arrhythmogenic substrates before or during ablation and to characterize multiple inducible VTs in real time from a single cycle.

Figure 1: Imageless ECGI hardware components. (A) Bipotential amplifier featuring specific cable connection ports. (B) Right and left cables, equipped with amplifier connectors on one end and sensor vest socket connectors on the other. (C) Configuration showing the right and left cables connected to the bipotential amplifier. (D) Schematic workflow of the procedure for connecting the sensor vest to the cable sockets. Please click here to view a larger version of this figure.

Figure 2: 3D torso reconstruction scanner procedure. (A) The 128-lead body surface potential sensor vest, consisting of four components (Front-Right, Front-Left, Back-Right, Back-Left), is placed on the patient's torso prior to 3D reconstruction. Each electrode has a unique QR code for automatic identification. The connections between electrodes can be folded to accommodate the vest to the patient's body shape. (B) The QR code on the Front-Right component validates the vest, enabling the 3D scanner application to initiate torso reconstruction. (C) The 3D scanner platform via the 3D scanner application, generates the reconstructed torso using an infrared structured light camera. Abbreviations: FR: front-right; FL: front-left; BR: back-right; and BL: back-left. Please click here to view a larger version of this figure.

Figure 3: Imageless ECGI user interface login screen requiring a designated username and password for software access. Please click here to view a larger version of this figure.
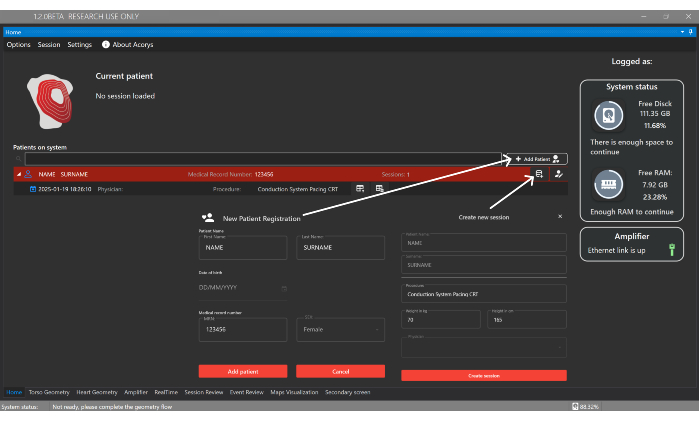
Figure 4: Home window. The Home window enables the management of patients, physicians, and users, as well as the configuration of patient sessions. It also displays information about the imported sessions and the status of the system and amplifier. Please click here to view a larger version of this figure.
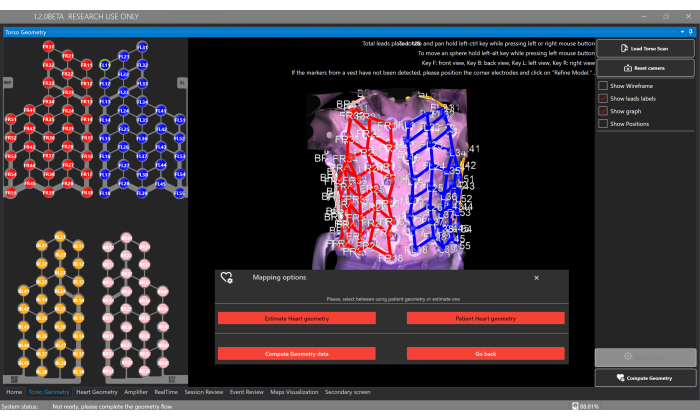
Figure 5: Torso geometry window. The Torso Geometry window allows users to upload and view the 3D torso model, segment electrodes, and select the type of heart geometry via the Compute Geometry button, which enables the estimation or to provide a segmentation from personalized CT/MRI. Please click here to view a larger version of this figure.
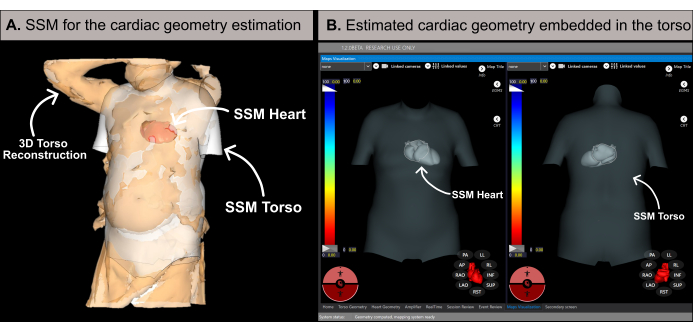
Figure 6: Cardiac geometry estimation. (A) SSM algorithm utilizing basal features and the patient's 3D torso reconstruction to estimate the cardiac geometry. (B) Estimated cardiac geometry within the torso's SSM displaying antero-posterior (left-side) and postero-anterior (right-side) views. Abbreviations: 3D: three-dimensional; SSM: statistical shape model. Please click here to view a larger version of this figure.

Figure 7: Amplifier window. The Amplifier window allows real-time visualization of the signals that are being obtained from each electrode of the Sensor Vest. Please click here to view a larger version of this figure.

Figure 8: Real-time window. (A) Schematic representation of the active leads from the high-density electrode array vest. Green electrodes contain good quality signals whereas red electrodes contain noisy signals and do not participate in the inverse problem computation. (B) Estimation of the 12 leads of the electrocardiogram in real-time. (C) Automatic triggering and delineation of the onset and offset of the QRS complex (green-colored window). The average signal of all the leads participating in the mapping computation is shown in blue. (D) The maps Visualization section supports single, dual, or four-map views. This example shows a dual-mapping view with activation maps for basal and left bundle branch pacing (final map) states during a CRT procedure. The basal map is in freeze mode, remaining static, while the final map is in update mode, recalculating with each newly analyzed QRS complex. Please click here to view a larger version of this figure.

Figure 9: Graphical example of a left-sided atypical AFL and the different diagnostic capacities of the 12-lead ECG, imageless ECGI, and invasive EAM. (A) The 12-lead ECG signals of the atypical AFL present positive supraventricular waves in V1. (B) Imageless ECGI using an estimated cardiac geometry from an SSM and displaying an antero-posterior view. The propagation circuit shows all colors around the MV, a typical pattern for a perimitral AFL. (C) Local activation mapping derived from EAM and displaying an antero-posterior view shows a macro-reentry around the MV, confirming the diagnosis from the Imageless ECGI. Abbreviations: ECG: electrocardiogram; EAM: electroanatomical mapping; ECGI: electrocardiographic imaging. SVC: superior vena cava; IVC: inferior vena cava; CS: coronary sinus; LSPV: left superior pulmonary vein; RIPV: right inferior pulmonary vein; RSPV: right superior pulmonary vein. Please click here to view a larger version of this figure.

Figure 10: Tracking atrial substrate evolution during AF catheter ablation using noninvasive imageless ECGI mapping. (A) Postero-Anterior, Antero-Postero, and Right Lateral views of imageless ECGI, with PFA sites marked by green circles. The baseline PS map highlights reentries in the RA lateral wall, RAA base, LA posterior wall, and LAA base. PFA at the LAA base transitioned the rhythm to perimitral AFL. Despite completing the mitral line and posterior wall isolation, AF was spontaneously induced again. ECGI revealed PS in the RAA base, which became the ablation target. Multiple PFA applications were performed in that area, and sinus rhythm was restored. (B) The 12-lead ECG and intracardiac signals at the moment AF changed to SR. Abbreviations: SVC: superior vena cava; IVC: inferior vena cava; LPVs: left pulmonary veins; RPVs: right pulmonary veins; AF: atrial fibrillation, SR: sinus rhythm, PS: phase singularities, LAT: local activation times, TV: tricuspid valve, MV: mitral valve, PVI: pulmonary vein isolation, AFL: atrial flutter, PW: posterior wall, and PFA: pulsed-field ablation. Please click here to view a larger version of this figure.

Figure 11: Optimization of biventricular pacing using Imageless ECGI. (A) Baseline rhythm of the patient. The Imageless ECGI map (left-lateral view) reveals a late-activated region (purple) in the lateral wall of the LV, with a TAT of 116 ms, indicating ventricular dyssynchrony. This aligns with the baseline ECG, which shows a wide QRS complex (156 ms) with an LBBB pattern. (B) Post-pacemaker implantation configuration. Following BiVP with simultaneous activation of the distal and proximal poles of the LV lead and an atrioventricular delay of 140 ms, the Imageless ECGI map shows no delayedactivated regions (no purple area), indicating synchronous ventricular activation and a reduced TAT of 70 ms. This is consistent with the shortened QRS complex observed in the final ECG, where the QRS duration decreases to 102 ms. (C) Antero-posterior X-ray view of the implanted pacemaker, showing the location of the pacemaker electrodes. The pacing activity of both the distal and proximal poles of the LV lead is also reflected in the ECGI map. Abbreviations: LBBB: left bundle branch block, BiVP: biventricular pacing, CRT: cardiac resynchronization therapy, RVOT: right ventricular outflow tract, MV: mitral valve, TAT: total activation time. Please click here to view a larger version of this figure.

Figure 12: Noninvasive Evaluation of CRT via conduction system pacing using imageless ECGI. (A) Patient baseline rhythm. The ECGI map (left-lateral view) indicates a region of delayed activation (purple) on the lateral wall of the LV, with a TAT of 133 ms, suggesting ventricular dyssynchrony. This corresponds with the baseline ECG, which displays a wide QRS complex (172 ms) typical of LBBB. (B) Intermediate phase (mid-septal pacing) during the implantation of the LBBP lead. The noninvasive map shows a partial correction of the delayed region in the LV, with the color shifting from purple to blue. This is accompanied by a reduction in QRS complex duration. (C) The final position of the LBBP lead during the screwing process. The map demonstrates complete correction of the delayed area, with the color transitioning from purple to green, indicating synchronous activation of both ventricles.Abbreviations: LBBB: left bundle branch block, LBB: left bundle branch, RVOT: right ventricular outflow tract, MV: mitral valve, TAT: total activation time. Please click here to view a larger version of this figure.
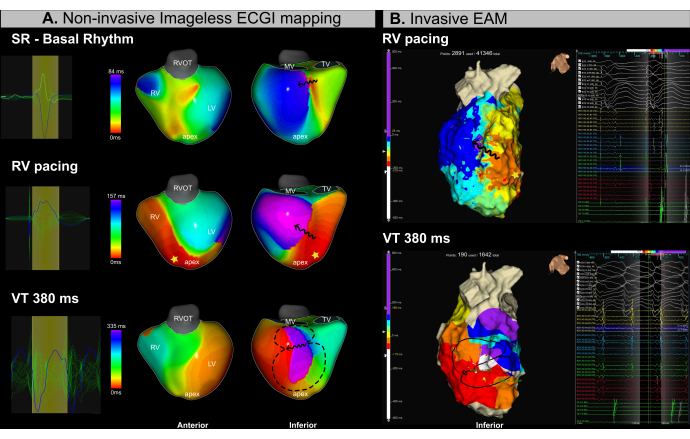
Figure 13: Noninvasive assessment of the VT isthmus using imageless ECGI. (A) Imageless ECGI mapping during the VT ablation procedure identifies the arrhythmogenic substrate and VT isthmus in the infero-basal and infero-medial regions of the LV. The first row corresponds to sinus rhythm, the middle row to RV apical pacing, and the bottom row to VT. (B) Invasive EAM obtained during the VT ablation procedure shows isochronal activation mapping in the same regions identified by ECGI. The top row corresponds to RV apical pacing, while the bottom row represents VT. Abbreviations: RV: right ventricle, LV: left ventricle, SR: sinus rhythm, RVOT: right ventricular outflow tract, MV: mitral valve, TV: tricuspid valve. Please click here to view a larger version of this figure.
Discussion
This methodological description highlights the clinical utility of a noninvasive, single-beat, and real-time ECGI approach, which can support a variety of electrophysiological procedures, such as catheter ablation and CRT, without the need for pre-procedural cardiac imaging like CT or MRI15,17,31,32 In this report, Imageless ECGI demonstrates key technical features that may promote its clinical adoption. While ECGI has already proven to be a powerful tool for cardiac mapping across a wide range of arrhythmias19,33,34,35,36, it continues to face several clinical and technical challenges13,14.
Classical ECGI systems need a CT scan specifically on the same day as cardiac mapping, with the ECGI electrodes in place9,10,12,37,38. This approach adds extra time due to the need for CT scan segmentation (heart and electrodes), delaying the generation of the initial ECGI map by approximately 1-3 h. In contrast, the imageless ECGI system presented in this report utilizes an infrared 3D scan of the thorax with high-density array electrodes, which can be performed just minutes before the procedure or during medical consultations15,17. The system automatically segments the thoracic electrodes and estimates the patient's cardiac geometry, streamlining the noninvasive cardiac mapping process and significantly reducing the time between the patient's arrival and the availability of the first ECGI map. Previous validation of the imageless ECGI approach has shown that using estimated cardiac geometry introduces minimal errors, maintaining the accuracy of noninvasive maps. In patients with AF, a strong correlation was observed between ECGI signals derived from estimated versus actual cardiac geometries, even with geometric translations15. For regular arrhythmias, such as complex atrial tachycardia, comparisons with EAM demonstrated high accuracy in identifying the involved cardiac chamber, determining the mechanism (focal or reentrant), and inferring the ablation target31. In the case of VT, the approach has been evaluated to guide operators towards areas of VT isthmuses during sinus rhythm (SR)39, which shows the potential to identify patients at risk of VT in primary prevention. Additionally, strong regional congruence between imageless ECGI and EAM activation maps were observed during coronary sinus pacing, particularly at early and late activation sites40.
In CRT, real-time morphological changes in the 12-lead ECG are typically used to confirm resynchronization during lead implantation, particularly in CSP procedures where the ECG is evaluated at various stages of septal lead placement until the LBB area is reached. However, the published ECG algorithms are often complex, show significant differences between them, and in some cases are difficult to implement in clinical practice41,42,43. Possibly due to this complexity, no specific electrocardiographic parameter for left bundle branch pacing (LBBP) has been consistently identified that can reliably predict whether a patient will respond to cardiac resynchronization. The real-time imageless ECGI approach offers simple and detailed, beat-by-beat mapping throughout lead implantation, assessing dyssynchrony correction by evaluating parameters such as left ventricular activation time, as demonstrated in patients with CRT indication32 or those with AV block44. Therefore, with further investigation, real-time ECGI parameters could potentially guide operators in optimizing lead implantation location or predicting patient response to CRT.
Although the potential of the real-time Imageless ECGI has been presented in this methodological report, other novel noninvasive mapping approaches using arrhythmia simulations have also aimed to eliminate the need for pre-procedural imaging. The Vectorcardiographic Mapping of Arrhythmogenic Probability (VMAP) study demonstrated significant regional accuracy in pinpointing ventricular arrhythmia sites45 and shows promise in identifying the location of AF drivers beyond non-PVI ablation46. VMAP uses the 12-lead ECG in combination with multiple computational models to identify arrhythmia targets without relying on patient-specific geometrical data. However, this approach may be suboptimal for atrial arrhythmias like AF, where high-frequency components on the surface ECG are crucial for identifying arrhythmia drivers non-invasively. These components are typically captured by electrodes on the posterior and antero-lateral surfaces27, which are not represented in the standard 12-lead ECG used in clinical practice.
Despite the need for further clinical investigation, the real-time imageless ECGI has the potential to become a valuable tool for noninvasive cardiac mapping across a wide range of arrhythmia. Its methodological simplicity and streamlined patient workflow in hospital settings enable clinicians to gather more clinical data, which could improve both patient outcomes and future technological advancements. In conclusion, the future of noninvasive cardiac mapping lies in advancing toward a fully imageless approach, allowing for faster and smoother integration into daily clinical practice, from routine consultations to real-time mapping during electrophysiological procedures.
Disclosures
JRP, BPS, JSC, IHR, RM, CF, EZ, JM, DL, FA, MSG, and AMC received honorary from Corify Care SL. AMC, MSG and FA are co-founders of Corify Care SL and JRP, BPS, JSC, IHR, JM, DL, JBG, FA, LM, MSG, and AMC are shareholders. TFA has received research grants from Biosense-Webster. IRL has received honoraria as a lecturer and consultant from Abbott and Biosense-Webster. APS has received speaker and consultant honoraria from Bisosense-Webster, Abbott, and Boston-Scientific. JMT has received honoraria as a lecturer and consultant from Abbott, Boston-Scientific, and Medtronic. EA has received speaker and consultant honoraria from Biosense-Webster and Bayer. LM reports honoraria as a consultant, lecturer, and Advisory Board from Boston-Scientific, Abbott, Johnson&Johnson, and Medtronic, and is a shareholder of Galgo Medical SL. JBG reports honoraria as a consultant and speaker from Microport CRM and Abbott, in addition to unrestricted grant support for a fellowship from Abbott. MPL has received speaker honoraria from Medtronic.
Acknowledgements
This research was funded by the European Institute of Innovation and Technology (EIT) under grant agreement SAVE-COR No 220385 and from grant CIAICO/2022/020 funded by Generalitat Valenciana (EFICACIA).Additional support came from Generalitat Valenciana (grant CIAPOS/2021/238, ACIF/2021/205, CIBEFP/2022/9), MCIN/AEI/10.13039/501100011033 and ESF Investing in Your Future (grant RYC2018-024346-I), Instituto de Salud Carlos III (grant CIBERCV16 CB16/11/00354), and Catalonia, Spain (grant 2021_SGR_01350, SGR21/GENCAT). We also acknowledge support from the CERCA Programme/Generalitat de Catalunya. MPL funded (2023-2025) through a Río Hortega contract CM22/00107 [Instituto de Salud Carlos III (ISCIII); Fondo Social Europeo (FSE)]. The authors thank Neus Portella and Sheila Marco for providing secretarial support, and to the medical and nursing teams for their clinical support at Hospital Clínic de Barcelona, Hospital General Universitario Gregorio Marañón, Hospital Universitari i Politècnic La Fe. They also extend they're thanks to Almudena Albertos from Corify Care SL, Madrid, Spain and Arantxa Carrasco from Universitat Politecnica de Valencia.
Materials
| Name | Company | Catalog Number | Comments |
|---|---|---|---|
| ACORYS Mapping System | Corify Care SL | ACORYS | Imageless ECGI system |
| ACORYS 3D Scan Software | Corify Care SL | ACSCAN | 3D scanner app |
| ACORYS Amplifier | Corify Care SL | ACAMP | Biopotential amplifier |
| ACORYS Sensor Vest | Corify Care SL | ACSEN | Sensor vest, 4 components (Front Right, Front Left, Back Right and Back Left) |
| ACORYS Software | Corify Care SL | ACSOF, version 1.2 | Imageless ECGI software |
| Affera mapping system | Medtronic | AFR-00003 | |
| CADENCE Adult mulifuntion defibrillation electrodes | Cardinal Health | 22660R | |
| Catheter extension cable | Medtronic | AFR-00006 | |
| Desktop or portable PC workstation | Any | Windows 11 as the operating system | Imageless ECGI workstation. The processor must be at least an Intel i7 from the 2020 generation or newer. It requires a minimum of 32 GB of RAM and 500 GB of SSD storage. Additionally, a compatible version of .NET Framework must be installed. An internet connection is not required. |
| Dynamic XT 10E 2 5 2 MM Diagnostic Catheter | Boston Scientific | M0042011010 | |
| EP-TRACER 2 ProCart | Cardiotek | The system includes several components provided by the company | |
| External Defibrillator Monitor | PHILLIPS | Efficia DFM100 | |
| Fentanyl | Kern pharma | 1004000143-03 | |
| Heparine | Reig Jofre | 608737.4 O | |
| HexaFlow irrigation pump | Medtronic | AFR-00005 | |
| HexaGen RF generator | Medtronic | AFR-00004 | |
| HexaPulse PF generator | Medtronic | AFR-00008 | |
| INTELLAMAP ORIO Mapping Catheter | Boston Scientific | M004RC64S0 | |
| IntellaNav StablePoint Ablation Catheter | Boston Scientific | M004ERFSDS96200 | |
| iPad mini | Apple | 6th generation A2567 | 3D scanner platform |
| iPadOS | Apple | 15.3 or superior | 3D scanner platform |
| Isolated Ethernet Cable | Corify Care SL | ACNET | Ethernet cable |
| Isoprenaline | Reig Jofre | 7227007 | |
| Left Connector Cable | Corify Care SL | ACCAB_L | Left cables |
| Location Reference Patch Kit | Boston Scientific | M004RAPATCH20 | |
| Location reference patch kit | Medtronic | AFR-00007 | |
| MetriQ Tubing Set | Boston Scientific | M0041170 | |
| Midazolam | Normon | X5XF1 | |
| Physiological Saline Solution for Irrigation | Fabrenius Kabi | br14801 | |
| Propofol | B Braun | 855437.9 OH | |
| Remifentanil | Kern pharma | 672786.7 | |
| RHYTHMIA HD | Boston Scientific | M004 RBINSTALL2ROW0 | |
| Right Connector Cable | Corify Care SL | ACCAB_R | Right cables |
| Single Patient Use ECG Electrodes | Ambu | M-00-S | |
| Sphere-9 mapping and ablation catheter | Medtronic | AFR-00001 | |
| Structure SDK | Structure | 2.2.1 for iOS or superior | 3D scanner platform, infrared structured light camera |
| Structure Sensor Pro | Structure | ST02B. Firmware version 1.2 or superior | 3D scanner platform, infrared structured light camera |
| Sugamadex Teva | Normon | 7340157-OH | |
| Tubing set | Medtronic | AFR-00002 | |
| WorkMate Claris System | Abbott | H700123 | |
| X-Ray C-Arm | Phillips | The system includes several components provided by the company |
References
- Narayan, S. M., John, R. M. Advanced electroanatomic mapping: current and emerging approaches. Curr Treat Options Cardiovasc Med. 26 (4), 69-91 (2024).
- Raiman, M., Tung, R. Automated isochronal late activation mapping to identify deceleration zones: rationale and methodology of a practical electroanatomic mapping approach for ventricular tachycardia ablation. Comput Biol Med. 102, 336-340 (2018).
- Guichard, J. -B., et al. Substrate mapping for ventricular tachycardia ablation through high-density whole-chamber double extra stimuli. JACC Clin Electrophysiol. 10 (7), 1534-1547 (2024).
- Takigawa, M., et al. Are wall thickness channels defined by computed tomography predictive of isthmuses of postinfarction ventricular tachycardia. Heart Rhythm. 16 (11), 1661-1668 (2019).
- Vázquez-Calvo, S., et al. Noninvasive detection of slow conduction with cardiac magnetic resonance imaging for ventricular tachycardia ablation. Europace. 26 (2), euae025(2024).
- Sánchez-Somonte, P., et al. Scar channels in cardiac magnetic resonance to predict appropriate therapies in primary prevention. Heart Rhythm. 18 (8), 1336-1343 (2021).
- Roca-Luque, I., et al. Post-ablation cardiac magnetic resonance to assess ventricular tachycardia recurrence (PAM-VT study). Eur Heart J Cardiovasc Imaging. 25 (2), 188-198 (2023).
- Roca-Luque, I., et al. Ventricular scar channel entrances identified by new wideband cardiac magnetic resonance sequence to guide ventricular tachycardia ablation in patients with cardiac defibrillators. Europace. 22 (4), 598-606 (2020).
- Rudy, Y., Burnes, J. E. Noninvasive electrocardiographic imaging. Ann Noninvasive Electrocardiol. 4 (3), 340-359 (1999).
- Haissaguerre, M., et al. Noninvasive panoramic mapping of human atrial fibrillation mechanisms: a feasibility report. J Cardiovasc Electrophysiol. 24 (6), 711-717 (2013).
- Tsyganov, A., et al. Mapping of ventricular arrhythmias using a novel noninvasive epicardial and endocardial electrophysiology system. J Electrocardiol. 51 (1), 92-98 (2018).
- Pereira, H., Niederer, S., Rinaldi, C. A. Electrocardiographic imaging for cardiac arrhythmias and resynchronization therapy. Europace. 22 (10), 1447-1462 (2020).
- Duchateau, J., et al. Performance and limitations of noninvasive cardiac activation mapping. Heart Rhythm. 16 (3), 435-442 (2019).
- Cluitmans, M., et al. Validation and opportunities of electrocardiographic imaging: from technical achievements to clinical applications. Front Physiol. 9, 1305(2018).
- Molero, R., González-Ascaso, A., Climent, A. M., Guillem, M. S. Robustness of imageless electrocardiographic imaging against uncertainty in atrial morphology and location. J Electrocardiol. 77, 58-61 (2023).
- Rodrigo, M., et al. Noninvasive assessment of complexity of atrial fibrillation: correlation with contact mapping and impact of ablation. Circ Arrhythm Electrophysiol. 13 (3), e007700(2020).
- Invers-Rubio, E., et al. Regional conduction velocities determined by noninvasive mapping are associated with arrhythmia-free survival after atrial fibrillation ablation. Heart Rhythm. 21 (9), 1570-1580 (2024).
- Fambuena-Santos, C., et al. AF driver detection in pulmonary vein area by electrocardiographic imaging: relation with a favorable outcome of pulmonary vein isolation. Front Physiol. 14, 1057700(2023).
- San Antonio, R., et al. Optimized single-point left ventricular pacing leads to improved resynchronization compared with multipoint pacing. Pacing Clin Electrophysiol. 44 (3), 519-527 (2021).
- Zacur, E., et al. MRI-Based Heart and Torso Personalization for Computer Modeling and Simulation of Cardiac Electrophysiology. Imaging for Patient-Customized Simulations and Systems for Point-of-Care Ultrasound. 10549, Springer. Cham. (2017).
- Bell, J. B., Tikhonov, A. N., Arsenin, V. Y. Solutions of ill-posed problems. Math Comput. 32 (144), 1320(1978).
- Oster, H. S., Taccardi, B., Lux, R. L., Ershler, P. R., Rudy, Y. Electrocardiographic imaging: noninvasive characterization of intramural myocardial activation from inverse-reconstructed epicardial potentials and electrograms. Circulation. 97 (15), 1496-1507 (1998).
- Figuera, C., et al. Regularization techniques for ECG imaging during atrial fibrillation: a computational study. Front Physiol. 7, 466(2016).
- Molero, R., et al. Improving electrocardiographic imaging solutions: a comprehensive study on regularization parameter selection in L-curve optimization in the atria. Comput Biol Med. 182, 109141(2024).
- Hernández-Romero, I., et al. Local conduction velocity estimation during wavefront collisions and reentrant scenarios. 2022 Computing in Cardiology (CinC). , Tampere, Finland. (2022).
- Rodrigo, M., et al. Technical considerations on phase mapping for identification of atrial reentrant activity in direct- and inverse-computed electrograms. Circ Arrhythm Electrophysiol. 10 (9), e005008(2017).
- Guillem, M. S., et al. Noninvasive localization of maximal frequency sites of atrial fibrillation by body surface potential mapping. Circ Arrhythm Electrophysiol. 6 (2), 294-301 (2013).
- Pedrón-Torrecilla, J., et al. Noninvasive estimation of epicardial dominant high-frequency regions during atrial fibrillation. J Cardiovasc Electrophysiol. 27 (4), 435-442 (2016).
- Tzeis, S. 2024 European Heart Rhythm Association/Heart Rhythm Society/Asia Pacific Heart Rhythm Society/Latin American Heart Rhythm Society expert consensus statement on catheter and surgical ablation of atrial fibrillation. Europace. 26 (4), euae043(2024).
- Parreira, L., et al. Noninvasive three-dimensional electrical activation mapping to predict cardiac resynchronization therapy response: site of latest left ventricular activation relative to pacing site. Europace. 25 (4), 1458-1466 (2023).
- Reventos-Presmanes, J., et al. Noninvasive electrocardiographic imaging for the characterization of complex atrial tachyarrhythmias. Europace. 25 (Supplement_1), (2023).
- Regany, M., et al. ECG imaging as a real time tool to guide left bundle branch pacing implant in patients with left bundle branch block and resynchronization therapy indication. Europace. 26 (Supplement_1), (2024).
- Rudy, Y. Noninvasive electrocardiographic imaging of arrhythmogenic substrates in humans. Circ Res. 112 (5), 863-874 (2013).
- Shah, A. J., et al. Validation of novel 3-dimensional electrocardiographic mapping of atrial tachycardias by invasive mapping and ablation. J Am Coll Cardiol. 62 (10), 889-897 (2013).
- Graham, A. J., et al. Evaluation of ECG imaging to map hemodynamically stable and unstable ventricular arrhythmias. Circ Arrhythm Electrophysiol. 13 (2), e007377(2020).
- Pujol-Lopez, M., et al. Conduction system pacing vs biventricular pacing in heart failure and wide QRS patients. JACC Clin Electrophysiol. 8 (11), 1431-1445 (2022).
- Rudy, Y., Lindsay, B. D. Electrocardiographic imaging of heart rhythm disorders. Cardiac Electrophysiol Clin. 7 (1), 17-35 (2015).
- Haissaguerre, M., et al. Driver domains in persistent atrial fibrillation. Circulation. 130 (7), 530-538 (2014).
- Reventos-Presmanes, J., et al. Noninvasive assessment of the ventricular tachycardia isthmus during sinus rhythm. Europace. 26 (Supplement_1), (2024).
- Ros, S., et al. Imageless electrocardiographic imaging for atrial electrophysiological characterization: a validation study. Europace. 26, (2024).
- Wu, S., et al. Left bundle branch pacing for cardiac resynchronization therapy: nonrandomized on-treatment comparison with his bundle pacing and biventricular pacing. Can J Cardiol. 37 (2), 319-328 (2021).
- Pujol-López, M., et al. Stepwise application of ECG and electrogram-based criteria to ensure electrical resynchronization with left bundle branch pacing. Europace. 25 (6), euad128(2023).
- Zhu, K., Chang, D., Li, Q. Which is more likely to achieve cardiac synchronization: left bundle branch pacing or left ventricular septal pacing. Front Cardiovasc Med. 9, 845312(2022).
- Martinez-Perez, M., et al. Real-time assessment of LV synchrony in AV block population undergoing LBB pacing using ECG imaging. Europace. 26 (Supplement_1), (2024).
- Krummen, D. E., et al. Forward-solution noninvasive computational arrhythmia mapping: the VMAP study. Circ Arrhythm Electrophysiol. 15 (9), (2022).
- Gu, K., et al. Ablation of non-pulmonary vein atrial fibrillation drivers identified by vMap in addition to pulmonary vein isolation improves procedural outcomes. 29th annual AF Symposium 2024. , https://cdn.prod.website-files.com/60f9aad2cca70843f8fa048e/660b432d93bbdc942469cc1e_AF%20Symposium%202024%20-%20PVI%20Outcomes.pdf (2024).
Reprints and Permissions
