The protocol presents a method for in vivo covalent attachment of biotin to proteins based on their proximity to a biotin ligase fused to a protein of interest. This modification allows for a selective enrichment of the proteins using streptavidin beads as needed in protein interaction studies.
Method Article
In Vivo Proximity Biotinylation for Protein Interaction Studies in Paramecium tetraurelia
In This Article
Summary
Abstract
Paramecium is a major model organism for the study of molecular mechanisms involved in programmed genomic rearrangements and transposon elimination during meiotic reproduction. Many details of this process remain enigmatic due to the complexity of the involved molecular machinery and transient protein-protein interactions. Here, we present a method for time-resolved labeling of proteins with biotin located close to a target protein of interest. The method can easily be adapted to different targets since the biotinylation is achieved by injection of a DNA encoding a target protein fused to an engineered biotin ligase. The fusion construct is expressed from the promoter of the endogenous gene, enabling a stage-specific expression profile similar to that of the native protein. Notably, the covalently attached biotin moiety allows for the selective enrichment of the labeled proteins using streptavidin-coated beads. Furthermore, with immunofluorescence staining, we show that efficient labeling requires supplementation of the culture with biotin. The plug-and-play engineered expression vector, combined with the efficient injection procedure demonstrated here, allows for the rapid generation of Paramecium lines expressing a modified protein. The biotinylation procedure demonstrated here can be followed up with mass spectrometry for the identification of the enriched proteins that contain the interacting partners of the target protein. Proximity biotinylation has the potential to simplify and accelerate the discovery of protein-protein interactions in Paramecium and ramp up the efforts to understand its genome editing machinery.
Introduction
The ciliated unicellular organism Paramecium tetraurelia harbors two distinct types of nuclei: a germline nucleus for the long-term storage of genetic information and a somatic nucleus for the physiological functions of the cell1. Sexual reproduction in this organism requires the formation of a new somatic genome. This process includes the irreversible excision of more than 45,000 DNA fragments from the somatic genome2 which include transposable elements3 and other repeats. Particularly striking is that the excision events are executed with an accuracy down to the single base pair1. This accuracy is biologically necessary, since the excised DNA fragments disrupt protein-coding regions4 and any faulty excision could evoke frameshift mutations, premature stop codons, or alter the protein coding sequence. An intricate RNA comparison mechanism allows the cell to differentiate the sequences that are needed in the new somatic genome. It is initiated with the transcription of the whole germline genome5, followed by trimming to a size of 25 bp6, transport to the old somatic genome7, where all complementary RNAs are discarded8. The remaining sRNAs that lack complementary sequences in the old somatic genome are further transported to the new developing somatic genome, where they align to any germline-limited sequences and direct their excision9. This complex multistep process requires a precise and timely interplay of many cellular components, and notably, transient weak interactions as the small RNAs transit between the different nuclei10,11. Previously, attempts at understanding the molecular mechanics of the process were made using knockdown experiments to determine if putative components are essential for the process, followed by immunoprecipitation approaches to uncover the interactions of essential proteins12,13,14. While this method is useful for the detection of strong and continuous binding that also endures the non-physiological conditions during the pulldown, the detection of weak and transient interactions may require tedious optimization. Due to the potentially transient nature of many interactions involved in the genome editing process, in vivo methods could improve the detection of such interactions. Additionally, some proteins cannot be efficiently solubilized in extracellular conditions15, which represents a problem that can be solved through in vivo interaction-based protein modifications, such as proximity labeling with biotin.
Here, we describe a new method that allows for a specific in vivo biotinylation of proteins that are localized close to the desired target protein. The covalent biotin modification can be used for efficient enrichment using streptavidin-based pulldown approaches. Development of this method was achieved by using the biotin ligase TurboID16 for performing the protein interaction studies in Paramecium tetraurelia. Our approach can be easily applied to any target protein following the steps outlined in the protocol. Therefore, this article provides an efficient and scalable strategy for proximity biotinylation that can be used for high-throughput proteomic studies in a prominent protozoan model organism.
Protocol
1. General methods
- Obtain buffers, reagents, and other materials as listed in Table 1.
- Cultivate monoclonal Paramecium lines as described previously17. In brief, transfer one cell to a new depression slide well that contains bacterized light medium (0.8 μg/mL β-sitosterol) so that the cell density remains lower than 500 cells/mL, to prevent premature initiation of the meiotic cycle. At 50 cell divisions, transfer the cells to a bacterized rich medium culture (with 0.8 μg/mL β-sitosterol) and leave until all bacteria are consumed, thereby inducing sexual reproduction (autogamy)18.
NOTE: Upon completion of the sexual reproduction cycle, the cells will remain in a non-dividing postautogamous state until a new nutrient source is provided. - Construct fusion proteins of the target genes by using a vector containing a codon-optimized 3x HA turboID sequence with upstream restriction enzyme cut sites.
- Perform PCR amplification of the target gene and its promoter region from genomic DNA, using primers designed with overhangs that encode suitable restriction sites.
- Insert the product using standard restriction digestion into the in-frame compatible cut sites19 upstream of the turboID coding regions.
- Sequence, verify, and amplify the constructed plasmid DNA in E.coli DH5α. Isolate the plasmid using a plasmid midiprep kit and linearize 100 μg of plasmid DNA by restriction digestion.
- Purify using phenol-chloroform extraction, then filter through a centrifugal filter12. Perform ethanol precipitation and dissolve the DNA pellet in water to obtain a concentration of 5 mg/mL.
NOTE: The DNA can be introduced into the somatic nuclei of Paramecium cells using the following microinjection procedure.
2. Microinjection into the somatic nucleus (MAC)
- Transfer a cell from the postautogamous culture obtained in step 1.2 to a fresh depression slide with bacterized light medium with 0.8 μg/mL of β-sitosterol. Incubate at 27 °C for two days prior to the injection to recover the cells.
- Use a stereomicroscope to transfer the cells from the recovered culture to a freshly prepared depression slide filled with the washing medium.
- While the cells are in the washing medium, add 20 μL of ddH2O onto a glass slide and overlay with a cover glass.
- Add 200 μL of mineral oil on top of the cover glass.
- After this, transfer individual washed cells as droplets underneath the mineral oil using as little liquid volume as possible. Place up to 20 bubbles containing a single cell per slide and then position the prepared slide on the pedestal of the injection microscope.
- Attach the aspiration needle and move it into position, then start the robotic arm and the injection machine.
- Using a microloader pipette tip, add 2-3 μL of the DNA solution prepared in step 1.5 into the injection needle. Attach the needle to the robotic arm and move it into position, then connect it to the pressure valve of the injection machine.
- Use the robotic arm to position the injection needle into an empty water droplet on the slide. Then press Clean to purge any remaining air in the injection needle until the flow of DNA is observed.
- Move on to a droplet that contains a cell, then lower the aspiration needle. Gently remove the liquid (water) from this droplet until the cell is immobilized.
- Raise the aspiration needle and lower the injection needle, then switch to a higher magnification.
- Ensure that the somatic nucleus (MAC) is now visible as a darker region devoid of food vacuoles (see Figure 1c) in which the injection needle needs to be inserted.
- Aim to penetrate the MAC completely with the injection needle and slowly retract the needle over several seconds.
NOTE: When the needle is located inside the MAC, the DNA will flow in the MAC due to the constant air pressure applied by the injection machine. A diffuse vacuole consisting of the injected DNA could become visible within the boundaries of the MAC.
NOTE: It is possible to inject the same cell multiple times to ensure a successful injection. - After the cell injection is completed, lower the aspiration needle containing the water aspirated in step 2.9. Reverse the flow to return enough water to the droplet until the cell starts moving again.
- Continue until all droplets that contain a cell have been processed.
- Recover each injected cell by collecting the droplets from the slide and transferring each of them to a separate well filled with bacterized light medium, with 0.8 μg/mL of β-sitosterol.
- Incubate at 27 °C overnight, transfer a single cell from each well into a new well, and maintain the original well at 18 °C as a backup.
- Culture the transferred cells overnight at 27 °C for 1 day and then transfer 5 cells from each monoclonal well into a PCR tube. Use construct-specific primers for the amplification to verify the presence of the injected DNA in the cells.
3. Immunofluorescence staining for verification of correct protein localization and biotin ligase function
- Culture the selected PCR-positive clones in 20 mL of bacterized medium with 0.8 μg/mL of β-sitosterol.
- After the medium becomes less turbid, collect a 50 μL sample from the culture. Add 1 μL of DAPI solution (0.1 mg/mL) and 1 μL EDTA (0.5 mM) for DNA staining to check for the initiation of autogamy.
NOTE: Autogamy usually starts at a cell density of 2,000 cells/mL. - If biotinylation is desired, supplement the culture medium with biotin to a final concentration of 500 μM for at least 1 h before harvesting the cells.
- Harvest the cells at the appropriate developmental stage using an oil-measurement centrifuge equipped with pear-shaped tubes at 280 x g for 2 min. Discard the culture medium and add PBS to the tubes, then centrifuge again, and remove the PBS.
- Resuspend the cell pellet in PBS and transfer to a clear 1.5 mL microcentrifuge tube.
- Prepare a 3.7% PFA dilution in PBS from the 37% stock solution.
- Resuspend the cell pellet in 0.5 mL of 3.7% PFA and incubate for 30 min at room temp on a tube rotator.
- Centrifuge at 600 x g for 1 min until a visible pellet forms. Discard the PFA solution in the designated special waste container.
- Resuspend the pellet in 1 mL of 50 mM Glycine in PBS. Incubate for 5-10 min on a tube rotator.
- Centrifuge at 600 x g for 1 min. Remove the supernatant and add 0.8 mL of 1x PBS. Optionally, wash once more with PBS.
NOTE: At this point, the cells can be stored at 4 °C, if needed. - Centrifuge at 600 x g for 1 min, remove the PBS, and add 500 μL of 0.5 % Triton X-100 in PBS. Incubate for 20 min on a tube rotator.
- Centrifuge until the pellet becomes visible (1,000 x g for 2 min), remove the Triton X-100 solution, and resuspend the cells in PBS.
- Prepare a 5% BSA solution in PBS according to the required antibody volume.
- Remove the PBS wash from the cells and add 100 µL of the primary antibody diluted in 5% BSA in PBS to the cells. Adjust the incubation time according to the used antibody.
NOTE: Incubating for 2 h at room temperature is sufficient for most antibodies. - Centrifuge at 600 x g, remove the primary antibody dilution, and wash the cells with 500 μL of PBS.
- Add 100 μL of the secondary antibody diluted in 5% BSA in PBS. Adjust the incubation time; generally, 1 h at room temperature is sufficient. Cover the tube with aluminum foil to protect the fluorophore from light.
- Add 1 μL of DAPI solution (0.1 mg/mL) during the last 10 min of incubation with the secondary antibody.
- Centrifuge at 600 x g for 1 min, remove the staining solution, and wash twice with PBS. Leave 20 μL of the second wash in the tube and resuspend the cells.
- Mount 10 μL on a slide for inspection under a microscope.
4. Selective enrichment of biotinylated proteins
- Harvest 1 x 10⁶ cells in the correct developmental stage as described under 3.4.
- Resuspend the pellet in 3 mL of lysis buffer.
- Transfer to a dounce homogenizer and lyse the cells with 100 pestle strokes.
- Transfer the lysate to two microcentrifuge tubes and centrifuge at 21,000 x g for 10 min at 4 °C.
- Equilibrate streptavidin-coated magnetic beads by mixing 20 µL (per sample) of pulse-vortex resuspended bead slurry with 1 mL of the lysis buffer in a microcentrifuge tube and incubating for 2 min.
- Remove the lysis buffer from the beads using a magnetic stand and resuspend in lysis buffer.
- Repeat step 4.6.
- Remove the lysis buffer and mix the equilibrated beads with the supernatant (clarified lysate) from step 4.4.
NOTE: The optimal salt concentrations and percentage of detergents for binding to the beads may differ and need to be validated experimentally. Additionally, it is possible to incubate the pellet from 4.4 in 50 μL of 2% SDS for 10 min at 60 °C to extract proteins from the insoluble fraction, followed by centrifugation at 21, 000 x g for 10 min. Add this extract to the clarified lysate and the beads. - Incubate for 1-2 h at room temperature on a tube rotator.
- Briefly centrifuge (<1s) the tube to recover all of the liquid to the bottom of the tube, collect the beads on a magnetic stand, and then replace the supernatant (flowthrough) with wash buffer 1.
- Incubate for 5 min on a tube rotator and then repeat as in step 4.10 for a second wash.
- Exchange wash buffer 1 for wash buffer 2 for two additional washes (wash 3 and 4).
- Exchange wash buffer 2 for wash buffer 3 for two final washes (wash 5 and 6).
- After removing the final wash, store the beads at -20 °C before downstream processing.
NOTE: The beads can be eluted with Laemmli buffer for western blot analysis and submitted to mass spectrometry services for an on-bead peptide preparation for protein identification.
Results
Our protocol describes a simplified method for the introduction of a covalent biotin modification to the proteins in the vicinity of a target protein in Paramecium (Figure 1A). These biotinylated proteins can then be further enriched using a streptavidin-pulldown and identified using mass spectrometry20. To demonstrate a practical use case of the method, we applied the protocol to the Nowa1 protein. This protein is essential for the genomic rearrangement process and has dynamic alterations in its localization12. In the early stages, it remains in the old somatic nucleus and fragments, but later it is located in the new developing nucleus. Notably, our previous attempts for a tag-mediated enrichment of the Nowa1 interacting proteins were unsuccessful (unpublished results). This was likely due to the complex repeats bearing similarity to the prion protein PrP27 that could cause self-aggregation under non-optimal conditions during the pulldown procedure21. We PCR amplified the Nowa1 coding region together with its upstream non-coding region containing the promoter. The product was then inserted in frame with a codon-optimized turboID encoding sequence (Figure 1B). To avoid transgene-induced silencing caused by the injection of circular DNA in Paramecium, the vector was linearized before injection. The linearized and purified DNA was then microinjected into the somatic nucleus (MAC) as described in this protocol. A dispersed droplet confined within the darker region of the somatic nucleus became visible in some of the successful injections (Figure 1C). The successful injection and the amplification of the DNA by the cells during cell division were then verified by PCR. As expected, 40-50% of the cells were positive for the injected DNA of the Nowa1 construct (expected product size 685 bp) (Figure 2). The next step was to verify the presence of the protein encoded by the injected DNA. Since the recipient vector contains the turboID sequence flanked by a triple HA tag, we used immunofluorescence staining to detect the tag. This allowed us to verify if the injected cells are expressing the fusion protein and if it was properly localized. We used late-stage cells that showed localization of the fusion protein in the two new developing nuclei, as previously observed for the wild-type Nowa1 protein12. The individual injected cell lines showed different levels of the fusion protein (Figure 3). A lower expression level can be beneficial for applications where reduced background is desirable, but in this case, we opted for maximal signal and proceeded with clone 2, which showed the highest expression. We then collected samples during different developmental stages to track the localization of the fusion protein. The protein was initially localized in the skeins formed from the old somatic nucleus and in the separated nuclear fragments during the early stages of autogamy. Upon the appearance of the nuclear anlagen, the fusion protein transitioned towards these new developing nuclei (Figure 4). To foster the biotinylation of the proximal proteome at the different stages, we supplemented the culture with 500 μM biotin for 2 h before harvesting the cells for IF. We visualized the biotin-labeled proteins via an IF staining using a fluorescently tagged streptavidin. The observed signal corresponded to the localization of the HA-tagged fusion protein. Importantly, it was possible to obtain biotinylation localization that is specific for the different nuclear developmental stages, as even a short incubation with biotin is sufficient for achieving significant biotinylation (Figure 4). Additionally, without the addition of supplemental biotin, only negligible biotinylation was detectable in the injected cells. In wild-type cells, the addition of supplemental biotin caused no detectable biotinylation (Figure 5A). Notably, the biotin was not merely accumulating in the developing nucleus, as even in denaturing conditions, it remains attached to the proteins. (Figure 5B). Using streptavidin-coated magnetic beads, it was possible to selectively enrich the biotinylated proteins (Figure 6). The enriched proteins can be identified using mass spectrometry. In these subsequent protein identification experiments, the non-supplemented culture, as well as cells expressing a non-fused turboID protein, can be used as background control groups.
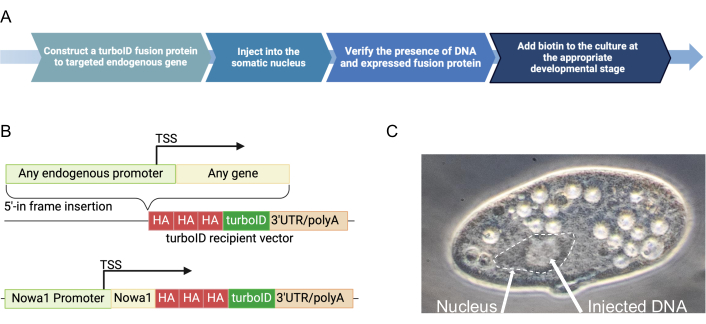
Figure 1: Overview of the procedure for proximity biotinylation in P. tetraurelia. (A) Generalized outline of the protocol. (B) Cloning principle for the plug-and-play turboID recipient vector and the resulting construct for the Nowa1 fusion protein. The 3'UTR region used in this plasmid is derived from CenH3a. (C) Visible diffuse droplet contained within the darker area corresponding to the somatic nucleus (MAC) upon a successful injection of DNA. Please click here to view a larger version of this figure.
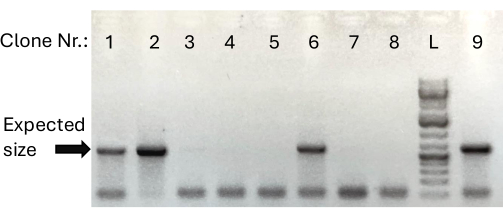
Figure 2: PCR test for successful injection. Agarose gel analysis of PCR reaction for a product with a forward primer specific for the upstream region encoding for ampicillin resistance (amp start) and a reverse primer complementary to Nowa1. The arrowhead shows the expected product size. Please click here to view a larger version of this figure.
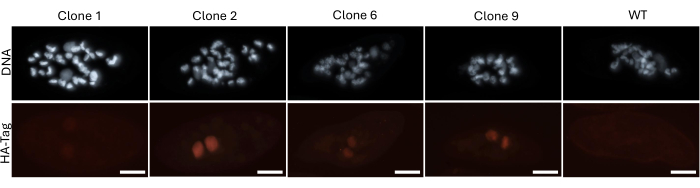
Figure 3: Immunofluorescence staining to validate the correct localization of the turboID fusion protein. Immunofluorescence staining using rabbit-anti-HA primary antibody (1:100) and goat-anti-rabbit Alexa Fluor 568 conjugated secondary antibody (1:1000) of monoclonal Paramecium lines with a positive PCR signal for the DNA encoding a Nowa1-HA-turboID fusion protein. Scale 20 μm. Please click here to view a larger version of this figure.
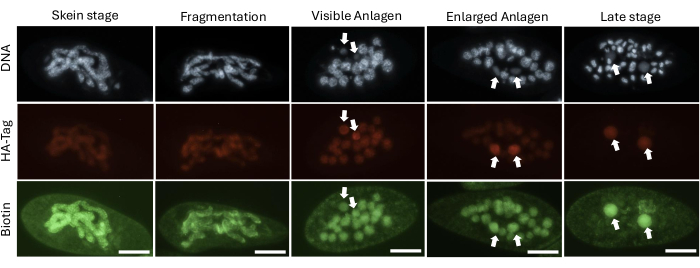
Figure 4: Nowa1-specific biotinylation at different developmental stages. Immunofluorescence staining of the monoclonal line 2 at progressing stages during the formation of the new somatic nucleus. The culture medium was supplemented with 500 μM biotin for optimal turboID activity. HA-tag was detected as in Figure 3, and biotin was detected using Streptavidin-FITC (1:200). Scale 20 μm. Please click here to view a larger version of this figure.
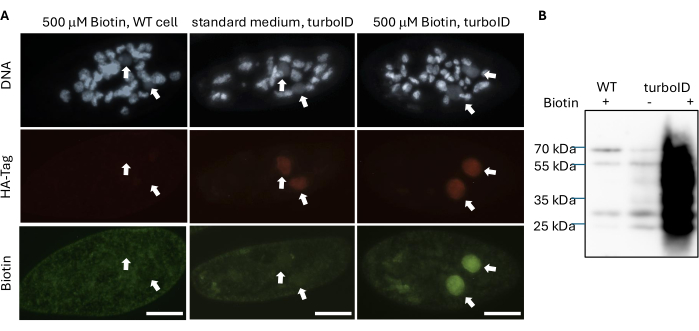
Figure 5: Efficient proximity labeling by turboID requires supplemental biotin in the culture. (A) Immunofluorescence staining of wt and injected cells in the late developmental stage showing the expression of Nowa1-HA-turboID and the observed biotinylation with 500 μM supplemental biotin. HA-tag and biotin were detected as in Figure 4. Scale 20 μm. (B) Western blot analysis for biotin using HRP-streptavidin of wt cells cultured with 500 μM biotin and turboID injected cells with and without biotin. Please click here to view a larger version of this figure.
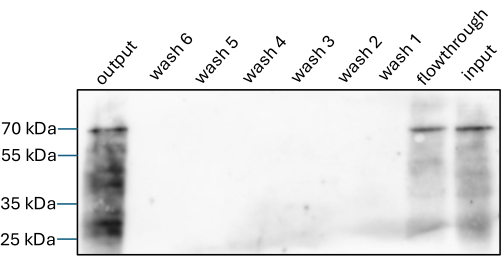
Figure 6: Enrichment of biotinylated proteins with streptavidin magnetic beads. Western blot analysis for biotin of samples from a pulldown experiment using streptavidin-coated magnetic beads. The samples are: Nowa1-HA-turboID cell lysate (input), the unbound fraction (flowthrough), the wash steps (wash 1-6), and the proteins bound to the beads (output). Please click here to view a larger version of this figure.
Discussion
The protocol presented here describes a technique for attaching a biotin moiety to the proteins in the proximity of the protein of interest. Based on the strong affinity of streptavidin for biotin, this allows for rapid and efficient enrichment of the modified proteins. Combined with the rapid adaptability for different proteins of interest, the presented method can ease the studies of multiprotein interactions in Paramecium. This model organism is well established for research on the transposon-host interactions during meiotic reproduction3. Additionally, it could offer novel molecular tools for precise genome editing as it excises more than 45,000 sequences during its programmed genomic rearrangements. The process is orchestrated by a complex multi-component machinery that allows for a precise RNA-directed excision of these DNA fragments with a reproducible cleavage site over each generation. The method presented here offers two major advantages for studying this process. It simplifies the discovery of transient protein-protein interactions. Additionally, the plug-and-play recipient vector allows for the rapid creation of many functional fusion proteins. Since multiple factors are likely involved in the process at different stages, the adaptability allows for the uncovering of the interactomes of many proteins that could be part of the excision machinery. Importantly, the fusion constructs are expressed from the promoter of the endogenous gene and, therefore, narrowly match the native expression time course. Furthermore, the demonstrated use of microinjection for the delivery of exogenous genetic material to this model organism allows for the generation of homogenous monoclonal populations. Such populations enable a more synchronous initiation of the autogamy process, during which the development of a new somatic nucleus takes place.
While the demonstrated procedure for introducing the turboID fusion constructs is robust, specific optimization might be necessary in the downstream protein enrichment protocols, due to the mechanism of biotinylation. Since the fused turboID enzyme generates reactive biotin-AMP moieties that diffuse away from the enzyme, these can potentially react with any nucleophilic moiety in the vicinity. Thus, an essential step in this methodology is the identification of the true interaction partners from the background hits and from the proteins localized in the general vicinity of the turboID fusion protein, which are not the actual interaction partners. To achieve this, a variation of parameters can be adjusted, such as the duration of incubation with biotin16. Furthermore, an experimental setup that includes a control group without supplemental biotin in the medium could indicate the background binding. As demonstrated, such a control group will be genetically identical to the actual experiment, but the biotinylation by turboID is strongly reduced due to the low abundance of biotin. Additional important control groups could include a non-fused turboID protein, as well as a wild-type group, both cultured in the medium supplemented with biotin. Additionally, even though the strong affinity of streptavidin for biotin is a significant advantage over antibody-based pulldowns, different salt and detergent concentrations are likely to have an influence on the purity and efficiency of the enrichment.
Superior proteomic approaches could boost our understanding of the unique molecular machineries of Paramecium, and potentially, other ciliates. Molecular components with novel functions hold promise to be repurposed as tools in synthetic biology and could thus foster biotechnological developments22,23. Engineered synthetic proteins often consist of combinations of functional domains with novel properties that allow previously impracticable therapeutic applications. Engineered proteins can also find use in pharmaceutical production processes24. The RNA-directed genome excision system from Paramecium is of particular interest for such developments. This system achieves RNA-dependent excision of thousands of DNA fragments, with a precision down to the single nucleotide25. Such parameters make it interesting to improve the accuracy of genome editing in human cells. The presented proximity biotinylation method can be used to speed up and foster the discovery of novel protein components and their interactions within multiprotein molecular machines.
Disclosures
The authors declare no conflicts of interest.
Acknowledgements
This work was funded by a University of Bern DigiK grant and Swiss National Science Foundation grant 229074 awarded to B.-A.S. and Swiss National Science Foundation grant 214853 awarded to M.N.
Materials
| Name | Company | Catalog Number | Comments |
|---|---|---|---|
| Microscope Axiovert 40 CFL (10x, 40x lenses) | Zeiss | na | |
| b-sitosterol | Sigma Aldrich | 567152 | |
| bovine serum albumin (BSA) | Sigma Aldrich | A9647 | |
| CellTram Oil | Ependorf | na | |
| codon optimized 3xHA-turboID DNA sequence | Twist bioscience | na | GCTAGCTATCCATAcGAaGTTC CTGATTATGCTTATCCTTACGAT GTTCCTGATTATGCTTATCCTTAT GATGTACCTGATTACGCTGGATC AAAAGATAATACTGTACCTCTTAA ATTAATCGCTTTATTAGCTAATGG TGAATTTCATTCTGGTGAACAAC TTGGTGAAACTTTAGGTATGTCA AGAGCTGCTATTAATAAACACATT CAAACTTTAAGAGATTGGGGTGT TGATGTTTTTACTGTCCCTGGTAA AGGATATTCACTTCCTGAACCCAT TCCTTTATTAAATGCTAAACAAAT TTTAGGTCAATTAGATGGAGGTT CTGTTGCTGTTTTACCTGTTGTT GACTCAACTAATCAATATTTATTAG ATAGAATTGGTGAATTAAAGTCAG GTGATGCTTGTATTGCTGAATACC AACAAGCTGGTAGAGGTTCAAGA GGTAGAAAATGGTTTTCTCCTTTT GGTGCTAATTTATACCTTTCCATGT TCTGGAGACTTAAAAGAGGTCCCG CAGCTATTGGATTAGGTCCTGTCAT TGGTATTGTTATGGCTGAAGCTCT TAGAAAATTAGGTGCTGATAAGGT TAGAGTTAAATGGCCTAATGATTTA TATCTTCAAGATAGAAAACTTGCT GGTATACTTGTTGAATTAGCTGGT ATTACTGGTGATGCCGCTCAAATT GTTATCGGTGCTGGTATTAATGTTG CTATGAGAAGAGTTGAAGAATCAG TTGTTAATCAAGGTTGGATTACTCT TCAAGAAGCTGGTATAAATCTTGAT AGAAACACTTTAGCTGCTACTCTCA TTAGAGAACTTAGAGCTGCTTTAGA ATTATTTGAACAAGAAGGTTTGGCT CCTTATCTTCCTAGATGGGAAAAAT TAGATAATTTCATTAATAGACCTGTTA AATTAATTATTGGTGATAAAGAAATTT TCGGTATTTCAAGAGGTATAGATAAAC AAGGAGCTCTTTTATTAGAACAAGATG GTGTTATCAAACCATGGATGGGTGGT GAAATTTCATTGAGATCAGCTGAAAA GAAATGA |
| DAPI | Sigma Aldrich | D9542 | |
| EDTA | Fischer Scientific | AAA151610B | |
| epT.I.P.S. microloader tips | Ependorf | 5242956003 | |
| Ethanol | Grogg Chemie | 1009832500 | |
| FemtoJet 4i | Ependorf | na | |
| Femtotip II | Calibre Scientific | 5242957000 | |
| Formaldehyde solution | Sigma Aldrich | F8775 | |
| Glycine | AppliChem | 10021259 | |
| Goat anti-rabbit IgG antibody, Alexa Fluor 568 | Thermo Fischer Scientific | A-11011 | |
| HA-tag (C29F4) rabbit mAB | cell systems | 3724 | |
| InjectMan NI 2 | Ependorf | na | |
| light medium | na | na | 0.2x wheat grass powder solution in 2.5 mM Na2HPO4 |
| Mineral oil | Sigma Aldrich | M8691 | |
| Na2HPO4 | Sigma Aldrich | 71643 | |
| Phenol-Chloroform-Isoamylalkohol | Sigma Aldrich | 77617 | |
| phosphor buffered saline | Fischer Scientific | 10722497 | |
| Plasmid plus midiprep kit | Qiagene | 12945 | |
| rich medium | na | na | 1x wheat grass powder solution in 2.5 mM Na2HPO4 |
| Streptavidin-FITC | Thermo Fisher Scientific | 11-4317-87 | |
| Ultrafree-MC GV centrifugal filter | EMD Milipore | UFC30GV00 | |
| washing solution | na | na | 0.1% BSA in Volvic water |
| wheat grass powder solution | Pines international | na | Prepare as a 20x stock from the powder as described previously (0.5g/10mL) |
| Streptavidin-HRP | abcam | ab7403 | |
| Streptavidin coated magnatic beads | Sigma Aldrich | LSKMAGT02 | |
| Lysis buffer for pulldown | na | na | 50 mM Tris pH 8; 150 mM NaCl; 0.5% Sodium deoxycholate; 1% Triton X-100; 5 mM MgCl2; 2x cOmplete protease inhibitor (Roche); |
| Wash buffer 1 for pulldown | na | na | 50 mM Tris pH 8; 150 mM NaCl; 0.5% Sodium deoxycholate; 1% Triton X-100; 5 mM MgCl2; |
| Wash buffer 2 for pulldown | na | na | 10 mM Tris pH 7.4; 150 mM NaCl; 0.01 % NP40; 1 mM MgCl2 |
| Wash buffer 3 for pulldown | na | na | 10 mM Tris pH 7.4; 150 mM NaCl; |
References
- Stefanov, B. -A., Nowacki, M. Functions and mechanisms of eukaryotic RNA-guided programmed DNA elimination. Biochem Soc Trans. 53 (2), 473-485 (2025).
- Swart, E. C., et al. Genome-wide analysis of genetic and epigenetic control of programmed DNA deletion. Nucleic Acids Res. 42 (14), 8970-8983 (2014).
- Witzany, G. The Roles of transposable elements in transgenerational inheritance and genome evolution. Epigenetics in Biological Communication. Witzany, G. , Springer Cham. 369-385 (2024).
- Dubois, E., et al. Transposon invasion of the paramecium germline genome countered by a domesticated piggybac transposase and the NHEJ pathway. Int J Evol Biol. 2012, 436196(2012).
- Gruchota, J., Denby Wilkes, C., Arnaiz, O., Sperling, L., Nowak, J. K. A meiosis-specific Spt5 homolog involved in non-coding transcription. Nucleic Acids Res. 45 (8), 4722-4732 (2017).
- Sandoval, P. Y., Swart, E. C., Arambasic, M., Nowacki, M. Functional diversification of Dicer-like proteins and small RNAs required for genome sculpting. Dev Cell. 28 (2), 174-188 (2014).
- Furrer, D. I., Swart, E. C., Kraft, M. F., Sandoval, P. Y., Nowacki, M. Two sets of piwi proteins are involved in distinct sRNA pathways leading to elimination of germline-specific DNA. Cell Rep. 20 (2), 505-520 (2017).
- Lepère, G., Bétermier, M., Meyer, E., Duharcourt, S. Maternal noncoding transcripts antagonize the targeting of DNA elimination by scanRNAs in Paramecium tetraurelia. Genes Dev. 22 (11), 1501-1512 (2008).
- Garnier, O., Serrano, V., Duharcourt, S., Meyer, E. RNA-mediated programming of developmental genome rearrangements in Paramecium tetraurelia. Mol Cell Biol. 24 (17), 7370-7379 (2004).
- Khanduja, J. S., Calvo, I. A., Joh, R. I., Hill, I. T., Motamedi, M. Nuclear noncoding RNAs and genome stability. Mol Cell. 63 (1), 7-20 (2016).
- Yao, M. -C., Chao, J. -L., Cheng, C. -Y. Programmed genome rearrangements in Tetrahymena. Microbiol Spectr. 2 (6), (2014).
- Nowacki, M., Zagorski-Ostoja, W., Meyer, E. Nowa1p and Nowa2p: Novel putative RNA binding proteins involved in trans-nuclear crosstalk in Paramecium tetraurelia. Curr Biol. 15 (18), 1616-1628 (2005).
- Drews, F., et al. Two piwis with Ago-like functions silence somatic genes at the chromatin level. RNA Biol. 18 (sup2), 757-769 (2021).
- Singh, A., et al. ISWI1 complex proteins facilitate developmental genome editing in Paramecium. Genome Res. 35 (1), 93-108 (2025).
- Bernier, S. C., Cantin, L., Salesse, C. Systematic analysis of the expression, solubility, and purification of a passenger protein in fusion with different tags. Protein Expr Purif. 152, 92-106 (2018).
- Branon, T. C., et al. Efficient proximity labeling in living cells and organisms with TurboID. Nat Biotechnol. 36 (9), 880-887 (2018).
- Beisson, J., et al. Maintaining clonal Paramecium tetraurelia cell lines of controlled age through daily reisolation. Cold Spring Harb Protoc. 2010 (1), pdb.prot5361(2010).
- Berger, J. D., Rahemtullah, S. Commitment to autogamy in Paramecium blocks mating reactivity: implications for regulation of the sexual pathway and the breeding system. Exp Cell Res. 187 (1), 126-133 (1990).
- Stefanov, B. -A., et al. Genetically encoded protein thermometer enables precise electrothermal control of transgene expression. Adv Sci (Weinh). 8 (21), e2101813(2021).
- Shin, S., et al. Super-resolution proximity labeling with enhanced direct identification of biotinylation sites. Commun Biol. 7 (1), 554(2024).
- Leffers, K. -W., et al. Assembly of natural and recombinant prion protein into fibrils. Biol Chem. 386 (6), 569-580 (2005).
- Stefanov, B. -A., Ajuh, E., Allen, S., Nowacki, M. Eukaryotic release factor 1 from Euplotes promotes frameshifting at premature stop codons in human cells. iScience. 27 (4), 109413(2024).
- Stefanov, B. -A., Fussenegger, M. Biomarker-driven feedback control of synthetic biology systems for next-generation personalized medicine. Front Bioeng Biotechnol. 10, 986210(2022).
- Stefanov, B. -A., Mansouri, M., Charpin-El Hamri, G. -, Fussenegger, M. Sunlight-Controllable Biopharmaceutical Production for Remote Emergency Supply of Directly Injectable Therapeutic Proteins. Small. 18 (41), e2202566(2022).
- Rzeszutek, I., Maurer-Alcalá, X. X., Nowacki, M. Programmed genome rearrangements in ciliates. Cell Mol Life Sci. 77 (22), 4615-4629 (2020).
Reprints and Permissions
