We established a Duplex in situ hybridization assay to map insulin receptor isoforms IR-A and IR-B in the murine choroid plexus, overcoming limitations of traditional methods. This high-resolution approach reveals isoform-specific expression, offering new insights into brain insulin signaling and potential isoform-targeted therapies for neurological disorders.
Method Article
Precise Visualization of Insulin Receptors A and B in Murine Brain with an RNA In Situ Hybridization Assay
In This Article
Summary
Abstract
Insulin receptors (IRs) are widely expressed across all tissues and all cell types. It exists in two functionally distinct isoforms -- IR-A and IR-B -- differing by 12 amino acids due to alternative exon 11 splicing. These isoforms exhibit tissue- and cell-specific expression patterns, with their relative abundance varying throughout development, aging, and disease. Due to their high sequence similarity, distinguishing between IR-A and IR-B using traditional immunological methods has been challenging. Here, we describe a novel Duplex in situ hybridization (ISH) assay that enables the visualization of IR-A and IR-B expression in tissue. Using this approach, we demonstrate for the first time that while both isoforms are expressed in the murine choroid plexus, IR-A is predominant. This method provides a powerful tool for investigating the spatial distribution of insulin receptor isoforms in situ across different tissues. While real-time qPCR can detect IR-A and IR-B transcripts in monocellular in vitro cultures, it lacks the capacity for spatial localization within complex tissues, highlighting the need for and utility of the Duplex ISH technique.
Introduction
The insulin receptor (IR) is a single-pass transmembrane enzymatic receptor that mediates the diverse physiological effects of insulin. It functions as a dimeric protein, with each monomer composed of two peptide chains linked by a disulfide bond: The extracellular α-subunit, which contains the ligand-binding domain, and the transmembrane β-subunit, whose intracellular sequence possesses intrinsic tyrosine kinase activity1. Through alternative splicing of exon 11, transcription of the IR gene gives rise to two IR mRNA variants. IR-A lacks exon 11, while IR-B retains it. Consequently, IR-A and IR-B differ by a 12-amino acid sequence near the C-terminus of the α-subunit, resulting in distinct binding of growth factors besides mature insulin, and varying downstream signaling properties. While both variants exhibit similar affinity for insulin, IR-A has a higher affinity for insulin-like growth factor-II (IGF-II) and proinsulin compared to IR-B. The expression patterns of IR-A and IR-B vary depending on tissue and cell type, and disease state2.
Their differential expression in tissues and disease underscores their unique contribution to physiology and pathology. The choroid plexus (CP), a specialized structure that produces cerebrospinal fluid (CSF) and forms part of the blood-CSF barrier, plays a critical role in nutrient transport, waste clearance, and neuroprotection, especially during inflammation. Both IR isoforms are expressed in the CP, where they likely regulate CSF volume and composition. IR-A, through its high-affinity binding by IGF-II, likely promotes cellular proliferation and tissue repair in the CP epithelium. IR-B, on the other hand, is implicated in insulin transport across the blood-CSF barrier, supporting insulin availability in the brain for astrocytes, neurons, glia, and glucose homeostasis3,4.
Pre-diabetic IR levels have been associated with elevated CSF tau in asymptomatic individuals at genetic risk for Alzheimer's disease (AD)5, and alterations in the IR-A/IR-B ratio have been linked to insulin resistance, aging, and increased proliferative activity-factors that may contribute to cancer and other pathologies6. Identifying isoform-specific expression patterns of IR-A and IR-B represents a critical step toward developing novel therapeutic strategies for complex central nervous system disorders. However, current approaches, such as immunostaining and qPCR, are limited: Not all proteins can be reliably immunolabeled due to a lack of validated antibodies, and while qPCR is highly specific, it lacks spatial resolution.
To overcome these limitations, we utilized Duplex in situ hybridization (ISH), an advanced RNA detection technology based on the RNAscope platform BaseScope. This assay employs a unique double-Z probe design that requires tandem binding to the target RNA, enabling high specificity and sensitivity, even for low-abundance transcripts. The fluorescent or chromogenic signal is amplified through multiple probe-binding events, enhancing detection and reducing background7. Unlike standard RNAscope, this assay is optimized to detect short RNA sequences (50-300 bases), making it particularly suitable for identifying alternative splicing events, single-nucleotide variants, and rare transcripts in complex tissues like the brain8.
This assay visualizes targets simultaneously as distinct green (C1) and red (C2) chromogenic signals under brightfield. It ensures success using tissues fixed in 4% paraformaldehyde (PFA) or 10% neutral buffered formalin (NBF) and sectioned at 5 µm-15 µm (frozen/FFPE), containing low-to-high abundance RNA. Due to sensitivity to RNA degradation, over-fixation, and probe errors, we need to optimize pretreatment, probe design, and controls to maximize specificity and minimize background. Here, we applied this Duplex ISH assay to characterize the expression patterns of IR-A and IR-B in the murine CP, offering new insights into the spatial biology of IR isoforms and their possible roles in brain health and disease.
Protocol
All animal procedures were conducted in compliance with protocols approved by the National Institute on Aging (NIA), which is fully accredited by the American Association for Accreditation of Laboratory Animal Care (AAALAC). Protocols were reviewed and approved by the Animal Care and Use Committee of the NIA Intramural Research Program (IRP/NIA). Mice were housed in a temperature-controlled facility under a 12 h light/dark cycle, with ad libitum access to water and standard chow unless otherwise specified. C57BL/6J male mice were obtained from the Jackson Laboratory and used for experiments at 3–4 months of age.
1. Fixed frozen sample preparation
- Perfuse the mouse with freshly prepared 4% PFA in 1x PBS and place the whole brain in freshly prepared 4% PFA for 17–24 h at 4 °C.
NOTE: Tissue placed in 4% PFA (10 mL for each brain) for no more than 24 h. - Immerse the tissue in 10% (10 mL) sucrose in 1x PBS at 4 °C until the tissue sinks to the bottom of the container. Then, sequentially transfer the tissue to 20% sucrose and finally to 30% sucrose, allowing it to sink at each step.
NOTE: The time needed for the tissue to sink varies with tissue type and size. For brain tissue, it takes approximately 18 h. - Freeze the tissue in OCT embedding media and store tissue blocks in an airtight container at -80 °C.
- Coronally section formaldehyde-fixed frozen brain tissues into 10 µm slices and store at −80 °C until use.
NOTE: Mount the sections on positively charged microscope slides; other slide types may result in tissue loss. If slides are not used immediately, store them at -80 °C for up to 3 months.
2. Section pretreatment prior to duplex detection assay
- On the day of the assay, wash the slides in 1x PBS for 5 min, gently moving the slide rack up and down to remove any residual OCT.
- Bake the slides at 60 °C for 30 min.
- Post-fix the slides in prechilled 4% PFA in 1x PBS for 15 min at 4 °C.
- Transfer the slides sequentially through an EtOH series: 50% EtOH for 5 min at RT, 70% EtOH for 5 min at RT, 100% EtOH for 5 min at RT, 100% EtOH again for 5 min at RT.
- Air-dry slides for 5 min at RT.
- Apply 2–4 drops of hydrogen peroxide to each section and incubate for 10 min at RT. Rinse once with distilled water.
- Prepare 700 mL of fresh 1x Target Retrieval solution in a beaker. Cover with foil and bring to a consistent boil (99–100 °C).
NOTE: Do not boil for more than 30 min before use. Meanwhile, preheat the oven (see the Table of Materials) to 40 °C. - Carefully immerse the slide rack into the boiling Target Retrieval solution and incubate for 5 min. Maintain the temperature between 98–102 °C and monitor closely.
NOTE: Boiling time may need to be adjusted (5–15 min) depending on the tissue type. - Immediately transfer the hot slide rack into a dish with distilled water, moving the rack up and down 3–5x. Repeat with fresh distilled water.
- Rinse slides in fresh 100% EtOH, moving them up and down 3–5x. Air-dry slides.
- Use a hydrophobic barrier pen to draw around each tissue section 2–3x. Allow the barrier to dry completely at RT.
- Place the slides in the Batch Slide Tray. Add Protease (see the Table of Materials) to each section, ensuring the tissue is fully covered. Incubate in the oven at 40 °C for 15 min.
NOTE: Protease incubation time may require adjustment depending on tissue type and target gene. - Remove the slide tray from the oven and place it into distilled water. Gently wash the slides by moving them up and down for 2 min, repeating this step 2x with fresh distilled water.
3. Duplex detection assay
- Probes
- Prepare two additional sections for positive and negative control probes.
- Select control probes with the same number of ZZ pairs as the target probe. For 1 ZZ pair, use a Positive control and a Negative control (see the Table of Materials).
- Prior to use, equilibrate probes at 40 °C for 10 min and bring AMP1-12 reagents to RT.
- Probe Hybridization
- Briefly spin down the C2 probe and mix at 1:50 ratio with the C1 probe. Add enough probe (100–200 µL) mix to fully cover each section and incubate the slides in the oven at 40 °C for 2 h. Wash the slides for 2 x 2 min in 1x Wash buffer at RT.
- Base Scope Duplex AMP1 Application
- Remove excess washing buffer from slides and add AMP1 (100–200 µL) to entirely cover each section. Return to the oven and incubate at 40 °C for 30 min.
- Wash 2 x 2 min in 1x Wash Buffer.
- Base Scope Duplex AMP2 Application
- Remove excess washing buffer from slides and add AMP2 (100–200 µL) to entirely cover each section. Return to the oven and incubate at 40 °C for 30 min.
- Wash 2 x 2 min in 1x Wash Buffer.
- Base Scope Duplex AMP3 Application
- Remove excess washing buffer from slides and add AMP3 (100–200 µL) to entirely cover each section. Return to the oven and incubate at 40 °C for 15 min.
- Wash 2 x 2 min in 1x Wash Buffer.
NOTE: Do not exceed 15 min of incubation.
- Base Scope Duplex AMP4 Application
- Remove excess washing buffer from slides and add AMP4 (100–200 µL) to entirely cover each section. Return to the oven and incubate at 40 °C for 15 min.
- Wash 2 x 2 min in 1x Wash Buffer.
- Base Scope Duplex AMP5 Application
- Remove excess washing buffer from slides and add AMP5 (100–200 µL) to entirely cover each section. Return to the oven and incubate at 40 °C for 30 min.
- Wash 2 x 2 min in 1x Wash Buffer.
- Base Scope Duplex AMP6 Application
- Remove excess washing buffer from slides and add AMP6 (100–200 µL) to entirely cover each section. Return to the oven and incubate at 40 °C for 15 min.
- Wash 2 x 2 min in 1x Wash Buffer.
NOTE: As for AMP3, do not exceed 15 min of incubation.
- Base Scope Duplex AMP7 Application
- Remove excess washing buffer from slides and add AMP7 (100–200 µL) to entirely cover each section and incubate at room temperature for 30 min.
- Wash 2 x 2 min in 1x Wash Buffer.
NOTE: Incubate with AMP7 at room temperature (RT) for 30 min.
- Wash 2 x 2 min in 1x Wash Buffer.
- Remove excess washing buffer from slides and add AMP7 (100–200 µL) to entirely cover each section and incubate at room temperature for 30 min.
- Base Scope Duplex AMP8 Application
- Remove excess washing buffer from slides and add AMP8 (100–200 µL) to entirely cover each section and incubate at room temperature for 15 min.
- Wash 2 x 2 min in 1x Wash Buffer.
NOTE: Incubate with AMP8 incubation for 15 min at RT.
- Red Signal Detection (C2)
- Briefly spin down the Fast Red-B and mix with Fast Red-A in a 1:60 ratio.
- Apply to each section (100–200 µL), cover the tray, and incubate for 10 min at RT in the dark.
- Wash 2x in 1x Wash Buffer.
NOTE: Use mixed Fast Red solution within 5 min. Protect from light (sunlight or UV).
- Base Scope Duplex AMP9 Application
- Remove excess washing buffer from slides and add AMP9 (100–200 µL) to entirely cover each section. Return to the oven and incubate at 40 °C for 15 min.
- Wash 2 x 2 min in 1x Wash Buffer.
- Base Scope Duplex AMP10 Application
- Remove excess washing buffer from slides and add AMP10 (100–200 µL) to entirely cover each section. Return to the oven and incubate at 40 °C for 15 min.
- Wash 2 x 2 min in 1x Wash Buffer.
- Base Scope Duplex AMP11 Application
- Remove excess washing buffer from slides and add AMP11 (100–200 µL) to entirely cover each section. Incubate at RT for 30 min.
- Wash 2 x 2 min in 1x Wash Buffer.
NOTE: Incubate with AMP11 at RT for 30 min.
- Base Scope Duplex AMP12 Application
- Remove excess washing buffer from slides and add AMP12 (100–200 µL) to entirely cover each section. Incubate at RT for 15 min.
- Wash 2 x 2 min in 1x Wash Buffer.
NOTE: Do not exceed 15 min of incubation.
- Green Signal Detection (C1)
- Briefly spin down Fast Green-B tube and mix with Fast Green-A in a 1:50 ratio.
- Apply the GREEN solution to each section (100–200 µL), cover the tray, and incubate for 10 min at RT.
- Wash for 5 min in 1x Wash Buffer and briefly rinse in distilled water.
NOTE: Use mixed Fast Green solution within 5 min. Protect from light. Green B to A ratio is 1:50. Both RED and GREEN substrates are alcohol-sensitive. Do not use any reagents containing alcohol.
4. Counterstain
- Immerse slides in 50% Hematoxylin staining solution for 1 min at RT until sections appear purple.
- Rinse in tap water 3–5x by moving up and down. Repeat with fresh tap water until the background clears but sections remain purple.
- Dip slides in 0.02% Ammonia water up and down 3x until the sections turn blue.
- Rinse again in tap water 3–5x.
5. Mounting
- Completely dry slides in a 60 °C dry oven for ~15 min.
- Dip slides in fresh xylene.
NOTE: As the mounting medium is quite viscous, a brief dip in xylene prior to mounting facilitates smoother spreading of the medium across the tissue section and reduces the formation of air bubbles under the coverslip. - Apply mounting medium (see the Table of Materials) on the slide and coverslip, avoiding bubbles.
- Air dry slides for at least 5 min.
6. Evaluate the samples
- Image the sections under a standard bright field microscope at 20x or 40x magnification. (Figure 1).
NOTE: Positive controls should show punctuate dots in cells. Negative controls are acceptable if there is no more than 1 dot per 20 cells at 20x magnification.
7. Scoring (optional)
- Use image analysis software (e.g., Halo, or QuPath) to quantify the RNA dots per cell.
Results
The insulin receptor (IR) is a transmembrane tyrosine kinase receptor composed of two extracellular α-subunits and two transmembrane β-subunits, forming a functional heterotetramer. The α-subunits mediate insulin binding, while the β-subunits possess intrinsic tyrosine kinase activity that initiates downstream signaling. IR mRNA alternative splicing of exon 11 generates two isoforms of the IR, IR-A and IR-B. As such, IR-B includes a 12-amino-acid segment encoded by exon 11 within the C-terminal region of the α-subunit, whereas IR-A lacks this segment.
To distinguish these isoforms in brain tissue, we employed two specific probes: The IR-A probe, which targets the exon 10-12 junction (skipping exon 11), and the IR-B probe, which targets the exon 11-12 junction. Using Duplex in situ hybridization (ISH), we visualized isoform-specific expression in the third and lateral ventricles of the mouse brain (Figure 1A,B). This assay produces a chromogenic signal in teal (IR-A) and red (IR-B), with each punctate dot representing a single RNA molecule. This method enables detection with single-cell resolution. Positive-control cells typically exhibit 1-5 BaseScope dots per cell in >70% of cells (manufacturer's guideline).
In the choroid plexus of the third and lateral ventricles, we observed that while both insulin receptor isoforms are present, IR-A is predominantly expressed compared to IR-B. While some signals may initially appear to localize within the nuclei -- likely due to the imaging angle when acquired in a single focal plane (top-down) -- Z-stack imaging and three-dimensional analysis confirm that these signals are perinuclear, residing in the cytoplasm close to the nuclei.
Some cells showed high levels of IR-A expression (black arrows in Figure 1A,B), while others co-expressed both isoforms (red arrows in Figure 1A,B). The choroid plexus consists mainly of specialized epithelial cells, but also includes mesenchymal (mural and fibroblast), endothelial, immune, neuronal, and glial cells across all ventricles9. The expression levels of IR-A and IR-B likely vary among these different cell types, suggesting that shifts in IR-A, IR-B, or their ratio could influence cerebrospinal fluid (CSF) production and impact the function of the choroid plexus-brain barrier. Positive and negative control probes were included to assess RNA quality and background signal, respectively (Figure 1C,D). Choroid plexus in the third and lateral ventricles showed IR protein expression (green in Figure 1E,F).
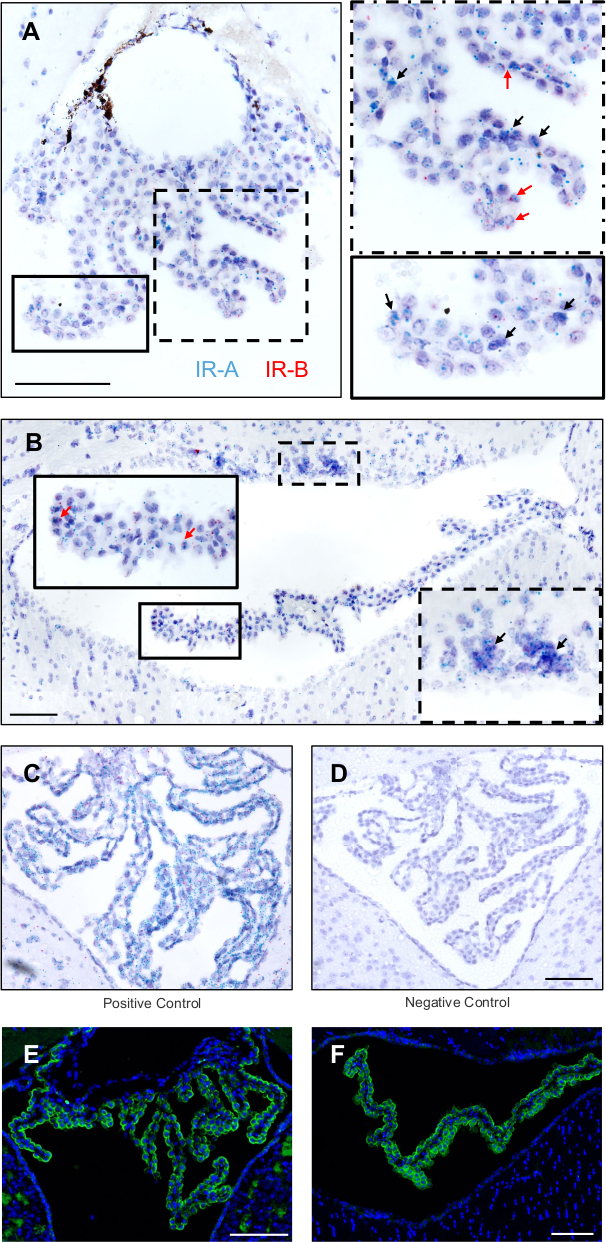
Figure 1: Detection of IR-A and IR-B isoforms in murine choroid plexus. (A) Representative images of staining in the third ventricle reveal that IR-A (teal) is the most prevalent isoform in the choroid plexus with some cells also expressing IR-B (red). (B) Representative images of the lateral ventricle show that while CP expresses both IR isoforms, CP-adjacent brain regions (i.e., caudoputamen) express almost exclusively IR-A (teal). Representative images of (C) positive and (D) negative control. Black arrows indicate cells with high IR-A expression, while red arrows indicate cells co-expressing both IR-A and IR-B. Immunofluorescence analysis of insulin receptor protein (green) showing staining in the (E) third ventricle and the (F) lateral ventricle. Scale bar = 100 µm. Abbreviations: IR = insulin receptor; CP = choroid plexus. Please click here to view a larger version of this figure.
Discussion
Within the brain, the expression of insulin receptors (IR) is heterogeneous, with high densities observed in regions such as the olfactory bulb, hypothalamus, hippocampus, and choroid plexus10. Comprehensive characterization of the variant expression patterns in specific brain regions and cell types would provide crucial information, enabling us to study and understand the specific roles of insulin and IGF-II signaling in synaptic plasticity, learning, and memory12. Additionally, this would give us better insights into the pathological processes involved in complex neurological disorders. Dysregulation of IR-A and IR-B expression in the brain has already been implicated in various neurological and neuropsychiatric disorders, including Alzheimer's disease, depression, autism, and schizophrenia6. Identification of isoform-specific expression patterns would be a fundamental step towards developing selective therapeutic strategies targeting either IR-A or IR-B, a completely new area to be explored in the treatment of these complex central nervous system disorders.
The BaseScope Duplex Assay builds on the proven RNAscope technology to enable the detection of short RNA sequences and exon junctions with high specificity and spatial resolution, offering unique insights into complex biological mechanisms. This method is particularly well-suited for visualizing IR isoforms IR-A and IR-B in the brain at the cellular level, especially when studying alternative splicing events involving exon 11 inclusion or exclusion.
We utilized qPCR data for quantification, as it provides more accurate and reliable measurements under these experimental conditions. Consistent with prior literature, our findings confirm that IR-A serves as the predominant isoform in the choroid plexus (data not shown). A comprehensive analysis of IR expression and functional significance in the brain will be detailed in an upcoming manuscript from our group.
BaseScope ISH offers several key advantages. First, it provides single-molecule sensitivity, allowing the detection of low-abundance RNA isoforms -- even in fragmented RNA samples such as formalin-fixed tissues. Second, the assay uses specially designed probes that can distinguish between IR-A (exon 11 exclusion) and IR-B (exon 11 inclusion) with 1-2 base resolution, minimizing cross-reactivity with homologous transcripts like IGF-1R or hybrid receptors. It also enables mapping of IR-A and IR-B expression to specific brain regions and cell types with subcellular precision.
Several critical factors influence assay success. For optimal signal, tissues should be fixed in fresh 4% paraformaldehyde (PFA) for no longer than 24 h. The use of prechilled 4% PFA helps preserve membrane integrity and minimizes fixation artifacts. Overfixation diminishes probe accessibility and reduces signal intensity. Following fixation, tissues should be gradually equilibrated in 10% to 30% sucrose to prevent ice crystal formation, which is critical for high-quality cryosectioning. Sucrose acts as a cryoprotectant by minimizing ice damage and improving section integrity.
Target retrieval time should not exceed 15 min. Based on our experience, a 5 min retrieval is sufficient for most tissues and probe sets. It is also essential to include technical control sections in each run and use appropriate positive and negative controls that match the probe design. BaseScope probes come in two formats: Single ZZ pairs and three ZZ pairs. Controls should match the format of the target probe to ensure accurate signal interpretation and to define minimum and maximum detection thresholds.
Importantly, the chromogenic red and green detection substrates are sensitive to ethanol and will fade if exposed to ethanol-containing reagents, particularly during mounting. Therefore, it is critical to verify that all reagents -- especially the mounting medium -- are ethanol-free.
While BaseScope ISH does have limitations, including the cost of custom-designed probes and the need for optimization to achieve optimal signal-to-noise ratios, its ability to detect splice variants and short RNA sequences with single-cell resolution makes it a powerful tool for studying gene expression and RNA biology in situ. Probe penetration can be a limitation, particularly with certain probes. Increased cell density in thicker sections (e.g., of 30 µm thickness) within a single field of view can lead to overlapping cells. As a result, the two-dimensional image shows a high concentration of green and red puncta that often appear overcrowded and overlapping, making it difficult to clearly distinguish individual signals or determine their precise cellular localization.
Here, we highlight the BaseScope Duplex technique, a method capable of visualizing two distinct IR mRNA splicing variants that differ by only a single exon in the brain. Moruzzi's group also successfully used this assay to detect IR-A and IR-B in adipose tissue and liver, demonstrating its effectiveness and suitability for use in other laboratories12. Future studies aiming for single-cell spatial resolution of RNA isoforms, mutations, or edits may find that BaseScope Duplex ISH is a powerful tool. Adaptable to diverse tissues-including brain, tumor, heart, and adipose-it enables detection of cell-type-specific RNA expression under both normal and disease conditions. Its compatibility with FFPE samples supports broad clinical and preclinical use. Moreover, its correlation with transcriptomic or proteomic data links RNA localization to function. Applications include mapping isoform switching in neurodegeneration, tracking RNA editing in cancer, and analyzing insulin IR in metabolic disorders. BaseScope's precision offers unique insights into tissue molecular architecture, advancing gene regulation and disease research. Work is underway to establish a protocol that allows simultaneous detection of cell markers and isoform-specific probes, which will help identify the specific cell types expressing both isoforms.
The protocol section places strong emphasis on tissue processing steps and critical notes, specifically addressing common pitfalls often encountered by trainees and first-time users. Drawing from our experience training colleagues and collaborators, this optimized protocol is designed to significantly improve reproducibility and provide effective troubleshooting strategies, ultimately helping researchers achieve more reliable and consistent results in their projects.
Disclosures
The authors have no conflicts of interest to disclose.
Acknowledgements
This work was supported by the Intramural Research Program/National Institute on Aging/National Institutes of Health.
Materials
| Name | Company | Catalog Number | Comments |
|---|---|---|---|
| Ammonium Water | Electron Microscope Science | 26754-4A | |
| BaseScope Dulplex Detection Reagent Kit | ACD Bio | 323810 | |
| BaseScope Dulplex Duplex Positive Control Probe- Mouse(Mm)-C1-Ppib-1ZZ/C2-Polr2a-1ZZ | ACD Bio | 700121 | |
| BaseScope Dulplex Duplex Positive Control Probe-C1-DapB-1ZZ/C2-DapB-1ZZ | ACD Bio | 700141 | |
| Gill's Hematoxylin I | Sigma-Aldrich | GHS132-1L | |
| Goat anti-Rabbit IgG (H+L) Highly Cross-Adsorbed Secondary Antibody, Alexa Fluor Plus 488 | Invitrogen | A32731 | |
| HybEZ OVEN, Tray, Rack and Wash Tray | ACD Bio | 321721, 310012, 321716, 321717 | |
| ImmEdge Hydrophobic Barrier Pen | Vector Laboratory | H-4000 | |
| INSR isoform Aand B probes: BA-Mm-Insr-tv1-E10E11, BA-Mm-Insr-tv2-E11E12-C2 | ACD Bio | 717411, 717421-C2 | |
| Insulin Receptor antibody | Cell Signaling | 23413 | |
| RNAscope 10x Target Retrival | ACD Bio | 322000 | |
| RNAscope Hydrogen Peroxide, Protease Plus | ACD Bio | 322381 | |
| Saline-Sodium Citrate (SSC) 20x | Fisher Scientific | BP1325-1 | |
| SuperFrost Plus slides | Fisher Scientific | 12-550-18 | |
| VectaMount Permanent Mounting Medium | Vector Laboratory | H-5000 |
References
- Häring, H. U. The insulin receptor: signalling mechanism and contribution to the pathogenesis of insulin resistance. Diabetologia. 34 (12), 848-861 (1991).
- Benecke, H., Flier, J. S., Moller, D. E. Alternatively spliced variants of the insulin receptor protein: expression in normal and diabetic human tissues. J Clin Invest. 89 (6), 2066-2070 (1992).
- Vella, V., Malaguarnera, R., Nicolosi, M. L., Morrione, A., Belfiore, A. Insulin/IGF signalling and discoidin domain receptors: an emerging functional connection. Biochim Biophys Acta Mol Cell Res. 1866 (11), 118522(2019).
- Galal, M. A., et al. Insulin receptor isoforms and insulin growth factor-like receptors: implications in cell signaling, carcinogenesis, and chemoresistance. Int J Mol Sci. 24 (19), 15006(2023).
- Starks, E. J., et al. Insulin resistance is associated with higher cerebrospinal fluid tau levels in asymptomatic APOEɛ4 carriers. J Alzheimers Dis. 46 (2), 525-533 (2015).
- Belfiore, A., et al. Insulin receptor isoforms in physiology and disease: an updated view. Endocr Rev. 38 (5), 379-431 (2017).
- Wang, F., et al. RNAscope: a novel in situ RNA analysis platform for formalin-fixed, paraffin-embedded tissues. J Mol Diagn. 14 (1), 22-29 (2012).
- BaseScope assays. , Advanced Cell Diagnostics, Inc. https://acdbio.com/basescope-duplex-assay (2025).
- Dani, N., et al. A cellular and spatial map of the choroid plexus across brain ventricles and ages. Cell. 184 (11), 3056-3074.e21 (2021).
- Schulingkamp, R. J., Pagano, T. C., Hung, D., Raffa, R. B. Insulin receptors and insulin action in the brain: review and clinical implications. Neurosci Biobehav Rev. 24 (8), 855-872 (2000).
- Milstein, J. L., Ferris, H. A. The brain as an insulin-sensitive metabolic organ. Mol Metab. 52, 101234(2021).
- Moruzzi, N., et al. Tissue-specific expression of insulin receptor isoforms in obesity/type 2 diabetes mouse models. J Cell Mol Med. 25 (10), 4800-4813 (2021).
Reprints and Permissions
