This protocol presents a method for fabricating a double-layer microfluidic chip and analyzing microbial growth under rapid oxygen oscillations. The device's performance was validated through oxygen sensing in fluid channels and microbial cultivation.
Method Article
Creating Rapid Oxygen Oscillations in Microbial Single-cell Growth Analysis using a Microfluidic Double-layer Device
In This Article
Summary
Abstract
Microbial single-cell analysis using microfluidics coupled with time-lapse microscopy holds promise for investigating microbial growth behavior under confined environments with spatiotemporal resolution, offering insights that cannot be gained from conventional cultivation and analytical platforms. Oxygen plays a crucial role in determining microbial growth. However, temporal control in the range of seconds has not been implemented in microbial analysis using microfluidics. We have recently developed a double-layer PDMS microfluidic chip enabling temporal oxygen control in the tens-of-seconds range. The chip comprises an upper layer for gassing and a bottom layer for cultivation and fluid perfusion. The two layers are separated by a thin intermediate PDMS membrane, allowing fast gas exchange between the two layers. In this methodological paper, we explain the procedure for chip fabrication, characterization, and microbial cultivation using the chip. As representative results, we demonstrate the fast oxygen switching capability in tens of seconds, microbial cultivation, and time-resolved growth analysis under constant and oscillating oxygen conditions. This protocol aims to assist researchers interested in implementing temporal oxygen control in their microfluidic setup.
Introduction
Oxygen is linked closely with microbial growth and physiology among various environmental factors, particularly affecting cellular processes such as oxidative stress response, iron homeostasis, and pathogenic infections1,2,3. Conventionally, microbial cultivation has been conducted under ambient conditions or with minimal control at specific oxygen levels. In realistic scenarios, on the other hand, oxygen environments are often not constant in many cases but rather fluctuate over time. For instance, microbes can be exposed to shifting oxygen levels within seconds to minutes in aquatic systems as they move around the environment due to fluid movement and microbial motility4,5,6. Similarly, industrial bioreactors also create inhomogeneous oxygen environments due to inadequate mixing, which impacts microbial growth and final yield7,8. Studying microbial responses to such dynamic conditions is vital for understanding ecological processes and improving biotechnological applications.
Facultative anaerobes such as Escherichia coli (E. coli) can switch between aerobic and anaerobic pathways depending on oxygen availability9,10. Although previous research has explored this metabolic adaptability, most studies focus on single oxygen shifts using conventional cultivation systems, which fail to replicate the rapid changes microbes often face9,11,12,13,14. As a result, there is a limited understanding of how microbes respond physiologically to frequently changing oxygen levels.
As mentioned, traditional lab setups lack the precision and speed needed to mimic rapid oxygen fluctuations and do not support continuous, high-resolution monitoring. To address this, we have recently developed a specialized microfluidic platform with a double-layer polydimethylsiloxane (PDMS) chip, allowing rapid oxygen control and single-cell imaging15. Here, we provide protocols for fabricating a double-layer microfluidic chip that creates rapid oxygen oscillations and enables microbial single-cell growth analysis under controlled oxygen conditions. The chip is composed of two layers – a top layer for gas perfusion and a bottom layer for fluid perfusion and microbial cultivation. The intermediate thin membrane between the two layers allows for rapid gas exchange. As a demonstration, E. coli MG1655 was cultivated in the developed chip. The growth under constant and oscillating oxygen conditions was analyzed.
Protocol
1. Mold preparation
- Prepare a mold for the top layer by 3D printing. Fabricate the top-layer mold with a smooth surface to ensure a smooth surface of the resulting PDMS top layer. We recommend the use of stereolithography (SLA) 3D printing.
- Design the mold with 3D CAD software (Figure 1A). Ensure the design includes gas channels that overlap with the bottom fluid channels. Perform this design process in parallel to designing the bottom layer (step 1.2.1).
- Print the mold using SLA 3D printing. Remove the remaining resin from the printed mold and wash it in an isopropyl alcohol (IPA) bath for 30 minutes (Figure 1B).
- Perform post-curing by exposing the mold to 405 nm light with appropriate duration and temperature depending on the resin type and geometry.
- Let the mold soak in IPA in an ultrasound bath for 15 min to remove uncured resin remaining in the mold, which might otherwise inhibit PDMS curing.
- Prepare a silicon wafer mold for the bottom layer.
- Design the microfluidic chip with CAD layout editor (Figure 1C). Ensure the design includes inlets, fluid channels, and outlets.
- Create a silicon wafer mold using two-layer photolithography, as described in the previous paper (Figure 1D)16.
NOTE: The channels on the bottom layer are the size of µm and require precise fabrication, whereas the channels on the top layer are the size of mm. As the SLA 3D printing offers shorter fabrication time and therefore faster prototyping, SLA printing was used for fabricating rather big structures for the top layer mold. The bottom layer was fabricated by photolithography to ensure precise fabrication. In case the channels in the top layer are also in the range of µm and require precision, consider fabricating a mold using photolithography as well.
2. PDMS double-layer microfluidic chip fabrication
- Prepare the PDMS pre-cure solution by thoroughly mixing the base and curing agent in a ratio of 10:1. Degas the mixture in a desiccator for 1 h.
- Clean the top layer mold with IPA and dry using compressed air.
- Pour the PDMS into the top layer mold, followed by thermal curing at 80 °C for 20 min (1st curing step, Figure 1E). The 1st curing step allows the peeling, cutting, and punching of PDMS while it is not fully cured.
- Check the PDMS stickiness by hand or with tweezers after 20 min of heating. If the PDMS is still sticky, adjust the heating time.
- Peel the PDMS out of the top layer mold and cut it into single pieces (here 20 mm x 18 mm). Punch holes (diameter = 0.75 mm) for gas inlets (Figure 1F). Clean the bottom surface of the top layer by rinsing with IPA, drying with compressed air, and attaching adhesive tape.
- Clean the bottom layer mold with IPA and dry it using compressed air. Fix the bottom layer mold on a spin coater and pour PDMS at the center of the mold. Pour PDMS close to the wafer to reduce air bubbles. If any air bubbles are found after pouring PDMS, move them to the outer side using clean tweezers or needles.
- Spin coat the PDMS onto the bottom layer mold at 1000 rpm for 60 s, followed by thermal curing at 80 °C for 10 min (1st curing step, Figure 1G). Check the PDMS stickiness by hand or with tweezers after 10 min and adjust the heating time if necessary.
- Place the top layer PDMS pieces onto the bottom PDMS layer on the mold and firmly press from the top to ensure surface attachment of the top and bottom layers (Figure 1H).
- Thermally cure the PDMS completely at 80 °C for at least 1 h (2nd curing step). The 2nd curing step allows the final PDMS curing, where the top and bottom layers are irreversibly bonded together (Figure 1H).
- Gently cut the PDMS bottom layer into pieces. Carefully peel off the whole PDMS chip from the mold (Figure 1H).
NOTE: If the PDMS chips are hard to peel off from the mold, consider further surface treatment of the bottom layer mold, such as silanization and chemical surface coating, to ease the peeling procedure. If the top and bottom layers detach while peeling off, consider shortening the time for 1st curing step. - Punch holes (diameter = 0.5 mm) for fluid inlets and outlets at both ends of the fluid channels (Figure 1H). Carefully clean the bottom surface of the chip by rinsing with IPA, drying with compressed air, and attaching scotch tape.
- Bond the chip with a 0.175 mm-thick cover glass after activating the surface by plasma oxidation (25 s, Figure 1H).
- After placing the chip on the glass substrate, flush the top layer with pressurized air to ensure that the PDMS membrane bottom layer is properly attached to the glass.
- Heat the bonded chip at 80 °C for 10 s to 1 min to increase bonding stability.
NOTE: The aforementioned PDMS curing step and the required curing time can be affected by various parameters, such as mold thickness, equipment, and ambient conditions. Therefore, adjust the curing time accordingly in case the suggested protocol does not suit the application.
3. Experimental setup
NOTE: An inverted microscope equipped with a complementary metal oxide semiconductor (CMOS) camera, a fluorescence lifetime imaging microscopy (FLIM) camera (frequency domain), and a temperature incubator is used as the standard experimental setup. A modulated excitation laser source (445 nm, 100 mW) is connected to the FLIM camera. Three mass flow controllers (nitrogen, oxygen, and carbon dioxide) are used for gas control. Syringe pumps are used for medium perfusion.
- Prepare tubings for gas (inlet) and fluid (inlet and outlet) perfusion. Turn on the incubator to reach the desired temperature before the experiment (here 37 °C).
- Select a desired objective lens (here, 20x for oxygen sensing and 100x for microbial observation) and add immersion oil if required. Fix the double-layer chip on a chip holder with adhesives.
4. On-chip oxygen control and sensing
- Prepare an oxygen-sensitive dye solution with appropriate concentration (here, 3 mM tris(2,2'-bipyridyl)dichlororuthenium(II)hexahydrate, RTDP).
- Calibrate the FLIM camera using a reference slide with a known lifetime (here 3.75 ns). Measure the signal intensity with the FLIM camera and adjust the exposure time or microscope aperture to achieve 0.68 - 0.72 signal intensity for better calibration.
- Fix the chip holder on the microscope stage. Connect appropriate tubings to the fluid inlet and outlet. Start perfusing oxygen-sensitive dye solution at a constant flow rate using a syringe pump (here 100 nL/min).
- Connect the gas inlet and the mass flow controllers with appropriate tubing. Start flushing gas with controlled oxygen concentration (here 0% or 21% oxygen, total mass flow rate 600 mL/min).
- Measure the phase lifetime in the absence of oxygen (τ0) and at another known oxygen concentration (here at 21%). Calculate the quenching constant (Kq) using the Stern-Volmer equation as follows, which describes the fluorescence quenching in the presence of oxygen. Alternatively, fluorescence intensity (I) can be used; however, intensity-based measurement may be affected by variations in light source intensity, photo bleaching, and so on.

NOTE: It is recommended to wait for a few minutes after initiating gas flushing to ensure accurate calibration, particularly when targeting oxygen depletion levels as low as 0%. For improved precision, consider supplementing the process with additional oxygen depletion methods, such as using oxygen scavengers or an additional sealed chamber setup. - Measure phase lifetime and calculate corresponding oxygen concentration using the Stern-Volmer equation. For creating oscillating oxygen conditions, use any instrument control system to automate adjusting the volume flow rates for nitrogen and oxygen.
5. Bacterial culture preparation
- .Start a preculture by inoculating a desired organism (here, E. coli MG1655, single ready-to-use bead from a cryo vial per flask) in a desired medium (here, LB medium comprising 10 g/L peptone, 5 g/L yeast extract, and 10 g/L NaCl) and incubate overnight (here, 37 °C at 150 rpm).
- Measure the resulting optical density using a photometer at 600 nm (OD600).
- Initiate the next culture in LB medium by inoculating the preculture (here initial OD600 = 0.3 or 0.0001). Incubate the culture till it reaches the exponential growth phase.
NOTE: If the medium for on-chip cultivation differs from the first preculture medium, it is desirable to perform a second preculture with the medium for on-chip cultivation to allow organisms to familiarize themselves with a new medium16. - Prepare a seeding solution by diluting the culture to an appropriate optical density. Transfer the seeding solution into a 1 mL syringe for the next step. For E. coli, the optical density (OD600) of the seeding solution was around 0.5.
6. On-chip microbial cultivation and time-lapse imaging under controlled oxygen conditions
- Fix the chip holder on the microscope stage. Let the chip holder and the PDMS chip warm up in the incubator (here 37 °C) for several hours, as this will decrease the risk of defocusing during time-lapse imaging due to temperature-associated displacement.
- Before starting cultivation, start gassing with the desired initial oxygen concentration by adjusting the volumetric percentage of oxygen and nitrogen mass flow while keeping the total flow rate and carbon dioxide flow rate constant.
- Connect the gas inlet of the chip and the mass flow controllers.
- Seed the organism into the chip by connecting the syringe with the seeding solution to the fluid outlet and manually pushing the syringe. Check through the microscope whether cells are successfully trapped in the cultivation chambers.
- After cell inoculation, remove the syringe and connect another syringe with the fresh medium to the fluid inlet. Manually push the syringe to flush any remaining cells in the medium supply channel.
- Start perfusing the medium at a constant flow rate (here 100 nL/min) with the syringe pump. Ensure a sufficient flow rate, as an inadequate rate may lead to the chamber drying out. The sufficient flow rate can vary depending on several factors, including the geometry of the fluid channel and the gas flow rate in the top layer channel.
- Start time-lapse image acquisition. For cultivation under oscillating oxygen conditions, start automatic control of mass flow controllers at the same time as the image acquisition starts. In case there is any delay in starting the gas control and image acquisition, take the delay into account for later image data analysis.
7. Image data analysis
- Save the time-lapse image as one image stack per position.
- Pre-process the image to rotate, align, and crop the cultivated colony using image analysis programs. Examples of pre-processed .TIF images are available here: https://doi.org/10.5281/zenodo.1398274715
- Segment cells and extract relevant values, such as cell number, length, area, fluorescence intensity, and so on. Analyze growth behaviors further. Example Python scripts are available here: https://github.com/JuBiotech/Supplement-to-Kasahara-et-al.-202515
Results
PDMS double-layer chip fabrication
The fabricated double-layer chip is depicted in Figure 2A, with colored gas channels (red) and fluid channels (blue) for visualization. The chip has three identical fluid channels and overlapping gas channels to allow parallel experiments. The fluid channel has a cultivation area with a series of cultivation chambers (Figure 2A(i)). Cells are trapped inside the cultivation chambers and allowed to grow in a monolayer format, which enables high-resolution time-lapse imaging with a high image acquisition rate. The cross-section of the chip illustrates a 3 mm-thick top layer and 65 µm-thick bottom layers, enabling fast gas diffusion from the gas channel to the fluid channel through the intermediate PDMS membrane (Figure 2A (ii-ii')).
On-chip oxygen control
The gas exchange capability of the developed chip was tested using FLIM and oxygen-sensitive dye15. As shown in Figure 2B, the oxygen concentration in the fluid channel showed either a corresponding decrease or increase within tens of seconds when the oxygen concentration was shifted between 21% and 0%. These oxygen measurement results demonstrate that the rapid oxygen oscillation in tens of seconds can be replicated in the developed double-layer microfluidic chip.
Microbial cultivation under constant oxygen conditions
The chip was first employed to characterize facultative anaerobe E. coli growth under constant gaseous conditions with various oxygen concentrations. Carbon dioxide was always added to the supply gas since we observed restricted growth of E. coli under depletion of carbon dioxide in preliminary experiments (data not shown). Figure 3A and Figure 3B depict representative phase-contrast images of E. coli under aerobic (21% oxygen supply) and anaerobic (0% oxygen supply) conditions, respectively. After 3 h of cultivation, E. coli grown under aerobic conditions resulted in larger colonies compared to anaerobic conditions. Quantitative analysis also shows different increase rates in colony size (Acolony) dependent on oxygen availability, as shown in the growth curves in Figure 3C. Note that Acolony is normalized by initial area to allow comparison over different colonies and conditions. The exponential growth rate µ can be determined from the growth curve as follows and summarized in Figure 3D.
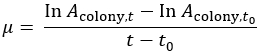
The results validate the device's capability to control oxygen at aimed concentrations and effectively analyze corresponding microbial growth from acquired time-lapse images.
Microbial cultivation under oscillating oxygen conditions
Finally, E. coli was cultivated under oscillating oxygen conditions, switching between aerobic and anaerobic gassing phases with a switching interval T'. Various T' between 60 min down to 1 min were examined to test the capability for time-resolved growth analysis in correlation to oscillating oxygen conditions. Figure 4 depicts quantified E. coli growth under oscillating oxygen conditions with T' = 60, 30, 10, 5, 2, and 1 min. In addition to the growth curve based on Acolony, the instantaneous growth rate µΔt is also determined to acquire time-resolved insights as follows.

The growth rates under constant aerobic and anaerobic conditions are also shown with dotted lines (µ21%, µ0%) in Figure 4 as growth references. The E. coli growth presented distinct dynamics in response to oscillating gaseous conditions. For instance, after the gassing phase was switched from aerobic to anaerobic conditions (T' = 60 min), the growth showed (i) response phase: sudden decrease in growth rate, followed by (ii) recovery phase: gradual increase in growth rate, and (iii) stabilization phase: growth stabilization around µ0%. The E. coli growth dynamics were temporally resolved successfully under various T' as short as 1 min, where E. coli showed a monotonous growth rate up and down due to limited time for adapting growth to shifting gaseous conditions. Furthermore, growth behavior can be analyzed not only at the colony level but also at the single-cell level. Figure 5 illustrates the development of the single-cell area under oxygen oscillations at various switching intervals T'. Single-cell growth can be inferred by following neighboring plots, without tracking analysis. The growth behavior at the single-cell level resembles what was observed at the colony level in Figure 4; a faster area increase during the aerobic gassing phase and a clear change in growth speed at the gas switching event. The results here demonstrate the capability to cultivate microbes under oscillating gaseous conditions and to analyze microbial growth in correlation with oxygen availability in a time-resolved manner.
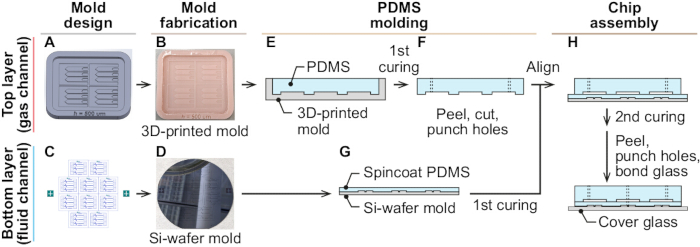
Figure 1: Double-layer chip fabrication procedure. The procedure starts with (A, C) mold designing, (B, D) mold fabrication, (E-G) PDMS molding, and (H) chip assembly. This figure has been modified from15. Please click here to view a larger version of this figure.
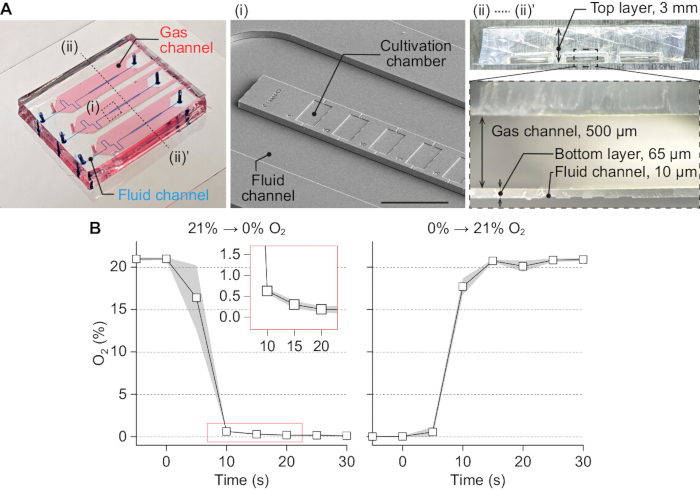
Figure 2: Fabricated double-layer chip and its oxygen control capability. (A) The representative image of the fabricated chip is presented, featuring colored gas channels (red) and fluid channels (blue) for visualization. The SEM image is shown in (i), depicting a series of cultivation chambers connected to fluid channels on both sides (scale bar 100 µm). The cross-section of the chip is shown in (ii-ii'), depicting the 3 mm-thick top layer and the 65 µm-thick bottom layer. (B) The measured oxygen concentration in the fluid channel after the switch between aerobic (21% oxygen) and anaerobic (0% oxygen) conditions. This figure has been modified from15. Please click here to view a larger version of this figure.
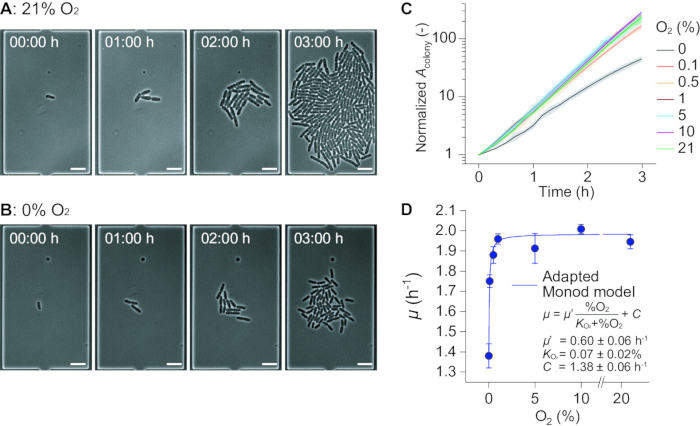
Figure 3: E. coli cultivation under constant oxygen conditions. (A) Cells are cultivated aerobically (21% oxygen supply) for 3 h, and time-lapse images are acquired using phase-contrast microscopy. (B) Cells are cultivated anaerobically (0% oxygen supply), and time-lapse images are acquired for 3 h. (C) Cell growth under various constant oxygen conditions is plotted based on Acolony. (D) The exponential growth rate is calculated and summarized. All scale bars = 5 µm. Data are expressed as mean ± S.D. n = 35 colonies (0%), 27 (0.1%), 21 (0.5%), 16 (1%), 13 (5%), 13 (10%), 29 (21%). This figure has been modified from15. Please click here to view a larger version of this figure.
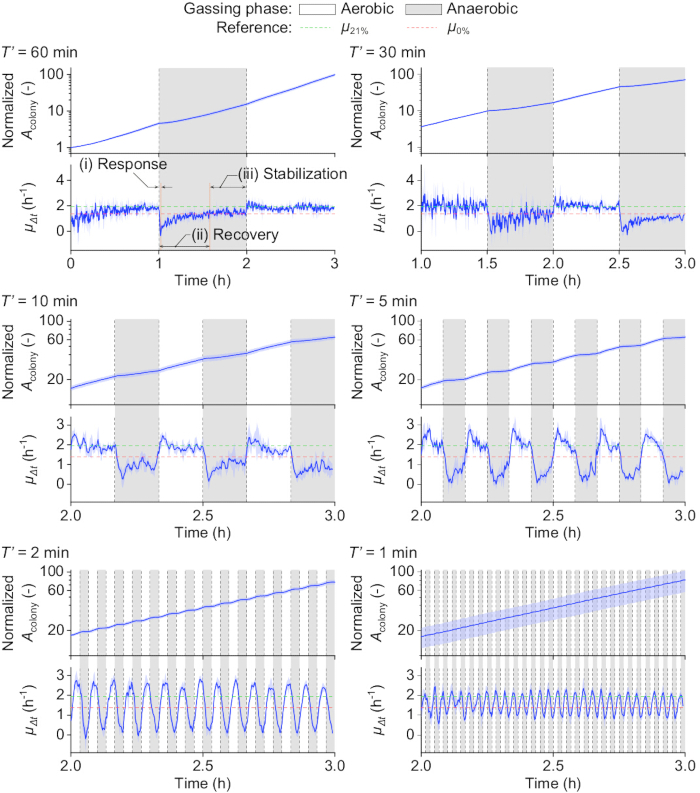
Figure 4: E. coli cultivation under oscillating oxygen conditions. Cell growth under various oscillating oxygen conditions is examined (T', switching interval between aerobic and anaerobic conditions). Cell growth based on Acolony is plotted over time (top), and µΔt is plotted over time to allow time-resolved data interpretation (bottom). Data are expressed as mean ± S.D. n = 5 colonies (60 min), 3 (30 min), 4 (10 min), 4 (5 min), 4 (2 min), 5 (1 min). This figure has been modified from15. Please click here to view a larger version of this figure.
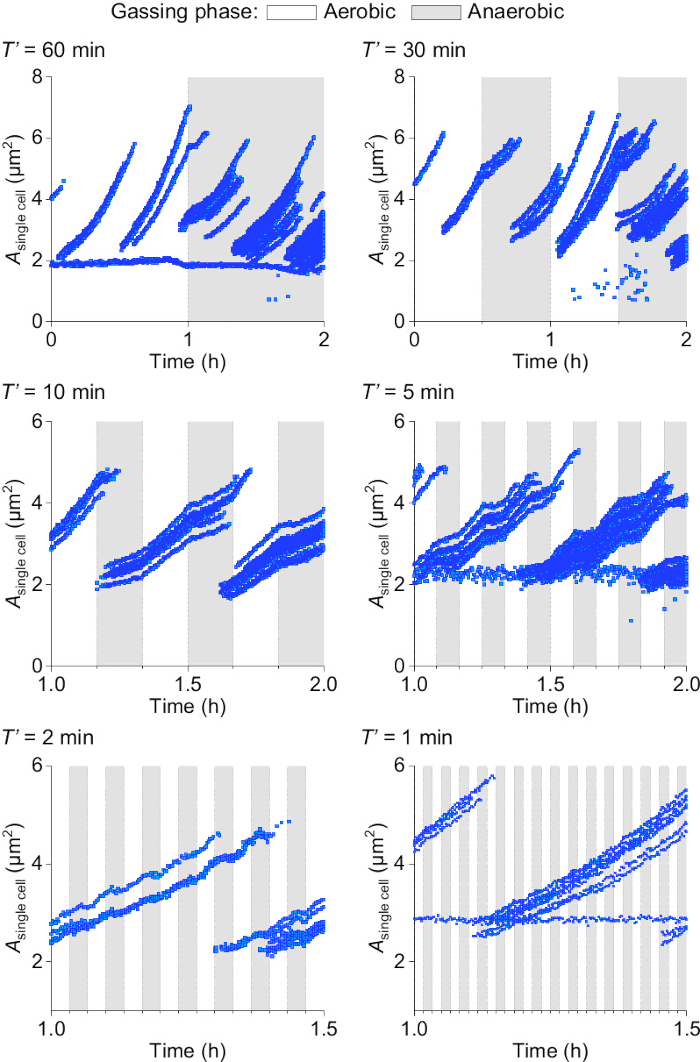
Figure 5: Single-cell area (A single cell ) of E. coli cultivated under oscillating oxygen conditions. Data are from a representative colony from each switching interval T'. This figure has been modified from15. Please click here to view a larger version of this figure.
Discussion
The protocol for fabricating and operating a double-layer microfluidic system was provided to observe microbial growth under rapidly oscillating oxygen conditions with high spatiotemporal resolution. Coupled with time-lapse imaging, this platform enables on-chip cultivation and real-time monitoring of microorganisms under controlled oxygen conditions, allowing analysis of microbial growth in correlation to oxygen availability.
In this protocol, the top and bottom layers are prepared separately and then assembled into a single chip. This modular concept permits various chip designs simply by replacing the two-layer configurations. Different fabrication methods were used for the top and bottom layer molds - SLA 3D printing for the top and photolithography for the bottom - based on their respective size and accuracy requirements. This approach improves the overall efficiency of the fabrication process. The assembly of the two layers is accomplished through a two-step PDMS curing process. It is essential to optimize the heating time for the first curing step according to the design, as mold thickness and local heating conditions can impact the PDMS curing results.
We leverage the nature of PDMS being highly air permeable to achieve rapid oxygen switching. On the other hand, the precision of oxygen control may also be affected by the passive diffusion of oxygen through PDMS, particularly at lower oxygen levels. To compensate for this limitation, further improvements can be added to the protocol. For instance, the calibration method for the oxygen sensor has opportunities for improvement. In the demonstrated protocol, the sensor is calibrated at two reference points, 0% and 21% oxygen levels, using the PDMS double-layer chip. Consequently, the precision of oxygen sensing relies on the ability to create accurate oxygen-depleted conditions for calibration. As mentioned in the protocol, it is recommended to wait for a few minutes after initiating gas flushing to ensure accurate calibration, particularly when targeting oxygen depletion levels as low as 0%. Nevertheless, this task is challenging due to potential leaks or air retention in the air-permeable PDMS chip. Calibration accuracy may be further improved by utilizing oxygen-scavenging chemicals or enclosing the chip in a tightly sealed, gas-depleted chamber17,18. These supplements could allow a more robust and precise analysis of microbial behavior under strictly anaerobic and low-oxygen conditions.
The demonstrated device would be of interest for various research fields. For instance, it would be useful for replicating oxygen conditions in industrial bioreactors, where oxygen availability is assumed to be spatiotemporally inhomogeneous7,8,19,20. Using the double-layer chip allows researchers to characterize and understand microbial behavior under rapidly fluctuating oxygen environments, which was not possible in conventional cultivation setups.
Disclosures
The authors have nothing to disclose.
Acknowledgements
KK was supported by the Japan Student Services Organization (JASSO) Student Exchange Support Program (G2130401003N) and the Deutsche Forschungsgemeinschaft (DFG, German Research Foundation) - SFB1535 - Project ID 458090666.
Materials
| Name | Company | Catalog Number | Comments |
|---|---|---|---|
| Clewin 5 | WieWeb software, Netherlands | N/A | Layout editor |
| CMOS camera | Nikon, Japan | DS-Qi2 | |
| cover glass | Schott AG, Germany | D263 Bio | 39.5 mm x 34.5 mm x 0.175 mm |
| Femto plasma cleaner | Diener Electronics, Germany | - | chip plasma bonding |
| Form 3B | Formlabs, US | - | 3D printer |
| Lifetime reference | Starna Scientific, UK | UMM-SFG | |
| Mass flow controller | Vögtlin Instruments GmbH, Switzerland | GSC-A9SA-BB22 | nitrogen, oxygen |
| Mass flow controller | Vögtlin Instruments GmbH, Switzerland | GSC-A9SA-BB21 | carbon dioxide |
| Model v3 resin | Formlabs, US | RS-F2-DMBE-03 | 3D print resin |
| NaCl | Carl Roth, Germany | 3957.1 | LB medium component |
| Nikon Eclipse Ti-E 2 | Nikon, Japan | - | Inverted microscope |
| pco.flim camera | PCO AG, Germany | - | |
| pco.flim laser | Omicron-Laserprodukte GmbH, Germany | - | |
| Peptone | Carl Roth, Germany | 8986.1 | LB medium component |
| Plan Apo λ | Nikon, Japan | - | 100x oil, 20x |
| Polydimethylsiloxane (PDMS) | Dow Chemical Company, US | Sylgard 184 Silicone Elastomer Kit | |
| Punching tool, Φ0.50 mm | World Precision Instruments, US | 504528 | |
| Punching tool, Φ0.75 mm | World Precision Instruments, US | 504529 | |
| ROTI Store cryo vial | Carl Roth, Germany | - | |
| Solidworks 2016 x64 Edition | Dassault Systems, France | N/A | 3D CAD |
| Substrate spin coater | APT Automation, Germany | SPIN150i | PDMS spincoating |
| Syringe pump | CETONI, Germany | neMESYS | |
| Temperature incubator | Okolab, Italy | - | Microscope equipment |
| tris(2,2’-bipyridyl)dichlororuthenium(II)hexahydrate, (RTDP) | Acros Organics, Belgium | 208750010 | |
| Tubing | Saint-Gobain, France | Tygon F-4040-A | Gas inlet tubing |
| Tubing | Saint-Gobain, France | Tygon AAD04103 | Fluid tubing |
| Yeast extract | Carl Roth, Germany | 2363.3 | LB medium component |
References
- Cabiscol, E., Tamarit, J., Ros, J. Oxidative stress in bacteria and protein damage by reactive oxygen species. Int Microbiol. 3 (1), 3-8 (2000).
- Miethke, M., Marahiel, M. A. Siderophore-based iron acquisition and pathogen control. Microbiol Mol Biol Rev. 71 (3), 413-451 (2007).
- André, A. C., Debande, L., Marteyn, B. S. The selective advantage of facultative anaerobes relies on their unique ability to cope with changing oxygen levels during infection. Cell Microbiol. 23 (8), e13338(2021).
- Blackburn, N., Fenchel, T., Mitchell, J. Microscale nutrient patches in planktonic habitats shown by chemotactic bacteria. Science. 282 (5397), 2254-2256 (1998).
- Smriga, S., Fernandez, V. I., Mitchell, J. G., Stocker, R. Chemotaxis toward phytoplankton drives organic matter partitioning among marine bacteria. Proc Natl Acad Sci U S A. 113 (6), 1576-1581 (2016).
- Taylor, J. R., Stocker, R. Trade-offs of chemotactic foraging in turbulent water. Science. 338 (6107), 675-679 (2012).
- Enfors, S. O., et al. Physiological responses to mixing in large scale bioreactors. J Biotechnol. 85 (2), 175-185 (2001).
- Takors, R. Scale-up of microbial processes: Impacts, tools and open questions. J Biotechnol. 160 (1), 3-9 (2012).
- Partridge, J. D., Scott, C., Tang, Y., Poole, R. K., Green, J. Escherichia coli transcriptome dynamics during the transition from anaerobic to aerobic conditions. J Biol Chem. 281 (38), 27806-27815 (2006).
- Ren, T., et al. Oxygen sensing regulation mechanism of Thauera bacteria in simultaneous nitrogen and phosphorus removal process. J Cleaner Prod. 434, 140332(2024).
- Murashko, O. N., Lin-Chao, S. Escherichia coli responds to environmental changes using enolasic degradosomes and stabilized DicF sRNA to alter cellular morphology. Proc Natl Acad Sci. 114 (38), E8025-E8034 (2017).
- Yasid, N. A., Rolfe, M. D., Green, J., Williamson, M. P. Homeostasis of metabolites in Escherichia coli on transition from anaerobic to aerobic conditions and the transient secretion of pyruvate. Royal Soc Open Sci. 3 (8), 160187(2016).
- von Wulffen, J., RecogNice-Team,, Sawodny, O., Feuer, R. Transition of an Anaerobic Escherichia coli Culture to Aerobiosis: Balancing mRNA and Protein Levels in a Demand-Directed Dynamic Flux Balance Analysis. PloS one. 11 (7), e0158711(2016).
- Pedraz, L., Blanco-Cabra, N., Torrents, E. Gradual adaptation of facultative anaerobic pathogens to microaerobic and anaerobic conditions. FASEB J. 34 (2), 2912-2928 (2020).
- Kasahara, K., et al. Unveiling microbial single-cell growth dynamics under rapid periodic oxygen oscillations. Lab on a Chip. 25, 2234-2246 (2025).
- Gruenberger, A., et al. Microfluidic picoliter bioreactor for microbial single-cell analysis: fabrication, system setup, and operation. J Vis Exp. (82), e50560(2013).
- Wu, H. M., et al. Widefield frequency domain fluorescence lifetime imaging microscopy (FD-FLIM) for accurate measurement of oxygen gradients within microfluidic devices. Analyst. 144 (11), 3494-3504 (2019).
- Kasahara, K., et al. Enabling oxygen-controlled microfluidic cultures for spatiotemporal microbial single-cell analysis. Front Microbiol. 14, 1198170(2023).
- Bisgaard, J., et al. Characterization of mixing performance in bioreactors using flow-following sensor devices. Chem Eng Res Des. 174, 471-485 (2021).
- Nauha, E. K., Kálal, Z., Ali, J. M., Alopaeus, V. Compartmental modeling of large stirred tank bioreactors with high gas volume fractions. Chem Eng J. 334, 2319-2334 (2018).
Reprints and Permissions
