This protocol outlines a method for producing skin organoids containing hair follicles from human induced pluripotent stem cells using a planar, physiologically relevant air-liquid interface culture system to replicate skin architecture and function.
Method Article
Generation of Human Induced Pluripotent Stem Cell-derived Planar Hair-bearing Skin Organoids Using an Air-Liquid Interface Culture System
In This Article
Summary
Abstract
Human induced pluripotent stem cell (hiPSC)-derived skin organoids (SOs) containing hair follicles provide a sophisticated in vitro model for investigating intercellular interactions within the skin microenvironment. Initially developed in an inverted cystic configuration, where the dermis is exposed to the environment and the epidermis faces inward toward the organoid center, SOs can subsequently be transferred to a planar configuration in an air-liquid interface (ALI) culture system, which more closely resembles human skin physiology. This manuscript presents a comprehensive protocol for generating and selecting cystic SOs that can be dissected into planar SOs and further developed in an ALI culture system. The protocol includes defined checkpoints for macroscopic qualitative assessment at critical stages of organoid development, details the technical steps required for flattening cystic SOs into planar skin, specifies optimal conditions for ALI culture, and demonstrates outcomes through molecular analysis. At Day 27, immunofluorescence staining with lineage-specific markers revealed a pluristratified pigmented epithelium with skin appendages, including hair follicles and sebaceous gland-like structures. This protocol provides a robust method for generating planar SOs with appendages, offering a physiologically relevant in vitro model. This system supports diverse applications in skin research and has already been successfully used to model pathogen infection, ultraviolet radiation-induced tissue damage, and drug responses.
Introduction
Skin forms a crucial protective barrier between organisms and their environment, while also regulating body temperature, water balance, and sensory input. It is composed of three main layers: the epidermis, a stratified keratinocyte epithelium with a cornified surface; the dermis, a connective tissue rich in extracellular matrix, fibroblasts, nerves, blood vessels, and immune cells; and the hypodermis, which primarily consists of subcutaneous adipocytes. The function of human skin also depends on specialized appendages such as hair follicles (HFs), sebaceous glands, and sweat glands1.
Skin disorders are among the most common medical conditions worldwide2,3. Historically, most skin-focused studies have been conducted using animal models4, which replicate the organ's physiological complexity within a systemic context. However, significant interspecies differences4, along with growing ethical concerns, have driven the development of physiologically relevant human skin models.
Conventional human skin models fall into two categories: reconstructed human epidermis, which consists of stratified keratinocytes, and reconstructed human skin, which additionally incorporates an underlying dermal compartment composed of fibroblasts embedded in a collagen matrix5. Although both model types have significantly advanced our understanding of skin physiology, they lack the full architectural fidelity and cellular diversity of native human skin. A major limitation of these models is the absence of skin appendages such as HFs, rendering them unsuitable for research and drug testing related to skin disorders involving hair growth and regeneration6. While more advanced systems incorporating HFs have been reported, they either fail to fully recapitulate the complexity of HF structure and microenvironment or rely on complex technologies such as bioprinting or micromolding7,8,9,10.
A novel skin model that addresses several of these challenges is the skin organoid (SO), generated from human induced pluripotent stem cells (hiPSCs)11. Mimicking embryonic development, hiPSCs can be directed toward cranial surface ectoderm and cranial neural crest lineages, self-organizing into cystic structures that closely resemble human skin. These SOs contain nearly all non-immune skin cell types, organized into a stratified epidermis and an extracellular-matrix-rich dermis. Importantly, SOs support the development of skin appendages: HFs and sebaceous glands. Given the virtually unlimited scalability of hiPSCs, SOs allow for sophisticated genetic engineering and the development of new functional tools. As such, SOs represent a major advancement in the field and hold promise for applications in developmental biology, disease modeling, drug testing, and regenerative medicine.
However, a considerable limitation remains: SOs form inverted cystic structures in which the epidermis is located inside the dermal cyst, sheltered from mechanical forces and submerged in aqueous medium. This configuration is not only physiologically inaccurate but also precludes the establishment of air-liquid interface (ALI). As a result, cystic SOs have limited application for studies involving the epidermal barrier, mechanical forces, or direct apical treatments. To address this issue, a reproducible method to mechanically flatten cystic SOs and subsequently culture them as planar skin under an ALI condition is presented below. This approach, originally reported by Jung et al., reorganizes the tissue architecture so that the apical epidermis is exposed to the air, thereby promoting further stratification and barrier function12. The resulting planar, hair-bearing organoids retain the complex architecture of human skin while also reflecting physiologically accurate tissue orientation, enabling experimental access to the apical surface. Although the procedure is lengthy (~100 days) and involves some technically challenging steps, particularly when dissecting cystic SOs into planar SOs, it may be of particular interest to researchers already working with SOs or other human skin equivalents who wish to increase the physiological relevance of their model systems.
Protocol
Figure 1 presents the workflow for generating planar SOs using an ALI culture system. The first section outlines the generation of cystic SOs from hiPSCs based on the methodology pioneered by Karl R. Koehler11, with minor modifications (Figure 2). The second section details the procedure for further developing cystic SOs into planar SOs using an ALI culture system as previously described12, with modifications (Figure 3). All chemicals and materials are listed in the materials table. Three previously described hiPSC lines (LUMCi001-A, LUMCi004-A, and WT2) were used to generate SOs (https://hpscreg.eu/)13.
1. Generation of cystic SOs
Figure 2 presents expected and aberrant morphologies at key steps.
- Cell aggregation (Day -2)
- Culture hiPSCs in a standard 6-well plate until they reach 70-80% confluence.
- Wash the cells with 1 mL of Dulbecco's Phosphate-Buffered Saline (DPBS). Add 1 mL of Cell Dissociation Reagent (CDR) and incubate at 37 °C with 5% CO2 for ~6 min to loosen the hiPSCs without detaching them from the matrix (avoid overdigestion).
- Aspirate the CDR and add 1 mL of hiPSC maintenance medium (hiMM) containing 10 µM ROCK inhibitor. Gently detach the cells by pipetting up and down with a P1000 pipette and prepare a cell suspension at 3.5 × 10³ cells/mL.
- Dispense 100 µL of the cell suspension into each well of a 96-well U-bottom, ultra-low-attachment plate using a multichannel pipette. Centrifuge the plate at 110 × g for 6 min at room temperature and incubate at 37 °C with 5% CO2.
- Dilution of ROCK inhibitor (Day -1)
- Prepare hiMM containing 100 µg/mL of antibiotic-antimycotic supplement (AAS).
- Dispense 100 µL per well and incubate at 37 °C with 5% CO2.
- Induction of surface ectoderm (Day 0)
- Thaw the appropriate volume of basement membrane matrix on ice before proceeding to the next step. Prepare hiPSC minimal medium (hiMinM) supplemented with basement membrane matrix (2%), BMP4 (2.5 ng/mL), SB431542 (10 µM), and bFGF (4 ng/mL) (referred to as hiMinM+SFB) on ice.
NOTE: The BMP4 concentration may need to be adjusted depending on the cell line used (see discussion). - Collect cell aggregates into a 2 mL round-bottom tube using a wide-orifice P200 pipette tip.
NOTE: Use commercially available wide-orifice tips. Select an orifice with an inner diameter of at least 2 mm to minimize damage to aggregates. Alternatively, heat a scalpel with an Infrared Loop Sterilizer and use it to create a wide orifice from a conventional pipette tip. - Allow aggregates to settle at the bottom of the tube. Carefully aspirate the medium and add 2 mL of hiMinM to wash the aggregates. Repeat the wash for a total of 3x.
- Transfer the cell aggregates in cold hiMinM+SFB to a well of a precooled 6-well plate using a wide-orifice P1000 pipette tip. Then, transfer each aggregate in 100 µL of hiMinM+SFB to a 96-well U-bottom ultra-low-attachment plate using a wide-orifice P200 pipette tip. Place the plate back in the incubator at 37 °C with 5% CO2.
NOTE: Use a stereomicroscope placed under a laminar airflow (LAF) hood for this step.
- Thaw the appropriate volume of basement membrane matrix on ice before proceeding to the next step. Prepare hiPSC minimal medium (hiMinM) supplemented with basement membrane matrix (2%), BMP4 (2.5 ng/mL), SB431542 (10 µM), and bFGF (4 ng/mL) (referred to as hiMinM+SFB) on ice.
- Induction of non-epithelial cell populations (Day 3)
- Prepare hiMinM containing LDN193189 (1 µM), bFGF (250 ng/mL), and AAS (100 µg/mL). Dispense 25 µL into each well using a multichannel pipette.
- Gently agitate the plate to ensure even distribution of the medium. Place the plate back in the incubator at 37 °C with 5% CO2.
- Supplying nutrients (Day 6)
- Prepare hiMinM containing AAS (100 µg/mL). Dispense 75 µL into each well using a multichannel pipette.
- Gently agitate the plate to ensure even distribution of the medium. Place the plate back in the incubator at 37 °C with 5% CO2.
- Medium refreshment (Day 8 and Day 10)
- Prepare hiMinM containing AAS (100 µg/mL). Carefully remove 100 µL of medium from each well using a multichannel pipette. Dispense 100 µL of fresh medium into each well using a multichannel pipette.
- Gently agitate the plate to ensure even distribution of the medium. Place the plate back in the incubator at 37 °C with 5% CO2.
- Transition to low-attachment 24-well plates (Day 12)
- Thaw the appropriate volume of Basement membrane matrix on ice before proceeding to the next step. Prepare organoid maturation medium (OMM) using Advanced medium (49% v/v), Neural basal medium (49% v/v), Glutamine supplement (1x), B-27 supplement minus vitamin A (0.5x), N2 supplement (0.5x), 2-Mercaptoethanol (0.1 mM), and AAS (100 µg/mL). Prepare the appropriate volume of cold OMM containing 1% basement membrane matrix (OMM1%M) and keep on ice.
NOTE: Use personal protective equipment and work in a well-ventilated area when manipulating 2-mercaptoethanol. - Collect cell aggregates into a 2 mL round-bottom tube using a wide-orifice P1000 pipette tip.
- Allow aggregates to settle at the bottom of the tube. Carefully aspirate the medium. Add 1.5 mL of Advanced medium to wash the aggregates. Repeat the wash for a total of 3x.
- Transfer the cell aggregates in cold OMM1%M to a well of a precooled 6-well plate using a wide-orifice P1000 pipette tip. Then, transfer each aggregate in 500 µL of OMM1%M to a 24-well low-attachment plate using a wide-orifice P1000 pipette tip. Place the plate back in the incubator at 37 °C with 5% CO2.
NOTE: Use a stereomicroscope placed under a LAF hood for this step.
- Thaw the appropriate volume of Basement membrane matrix on ice before proceeding to the next step. Prepare organoid maturation medium (OMM) using Advanced medium (49% v/v), Neural basal medium (49% v/v), Glutamine supplement (1x), B-27 supplement minus vitamin A (0.5x), N2 supplement (0.5x), 2-Mercaptoethanol (0.1 mM), and AAS (100 µg/mL). Prepare the appropriate volume of cold OMM containing 1% basement membrane matrix (OMM1%M) and keep on ice.
- Medium refreshment (Day 15)
- Thaw the appropriate volume of Basement membrane matrix on ice before proceeding to the next step. Prepare the appropriate volume of cold OMM1%M. Keep on ice.
- Using P1000 tips, carefully remove 250 µL of medium from each well. Then, add 250 µL of OMM1%M to each well. Place the plate back in the incubator at 37 °C with 5% CO2 on an orbital shaker set at 65 rpm.
- Between Day 18 to Day 45, perform a half medium change (250 µL) with OMM on Mondays, Wednesdays, and Fridays.
- Between Day 45 and Day 90, perform a half medium change (250 µL) with OMM on Mondays and Wednesdays and a full medium change on Fridays.
2. Transition from cystic SOs to planar SOs
NOTE: Cystic SOs exhibit an inverted morphology, with the epidermis facing inwards towards the center of the organoid and the dermis in contact with the external environment. Between Day 70 and Day 90, depending on the cell line and differentiation efficiency, early suprabasal differentiation of the epidermis is well advanced, and hair pegs are developed. This is the stage at which the cystic SOs are transitioned to an ALI culture system to obtain tissue that more closely resembles native human skin.
- Selection of cystic SOs between Day 70 and Day 90 for transition to planar SOs
- Select cystic SOs with a diameter of at least 5 mm and minimal byproduct content (mesenchymal cells that accumulate at one pole of the cyst and may also contain cartilage). Use the presence of hair placodes/pegs as a quality indicator of the skin organoid development (Figure 1A and Figure 2B).
NOTE: Flatten 2-4 planar SOs from each cystic SO, depending on their size.
- Select cystic SOs with a diameter of at least 5 mm and minimal byproduct content (mesenchymal cells that accumulate at one pole of the cyst and may also contain cartilage). Use the presence of hair placodes/pegs as a quality indicator of the skin organoid development (Figure 1A and Figure 2B).
- Preparation of collagen-coated insert (12-well format)
- Prepare a NaOH solution (1 M) by dissolving the appropriate amount of NaOH pellets in distilled water. Filter-sterilize the NaOH solution using a 0.2 µm pore-size membrane filter.
NOTE: Use personal protective equipment and work in a well-ventilated area when manipulating NaOH solution (1 M). - On ice, dilute the collagen type I solution to a final concentration of 2 mg/mL using 10x PBS (to a final 1x concentration), NaOH (5 mM), and distilled water to adjust the final volume. Distribute 150 µL of the collagen solution into each insert placed in a standard 12-well plate. Incubate the plate at 37 °C for 30 min to allow the collagen gel to polymerize.
- Prepare a NaOH solution (1 M) by dissolving the appropriate amount of NaOH pellets in distilled water. Filter-sterilize the NaOH solution using a 0.2 µm pore-size membrane filter.
- Flattening of cystic SO (Figure 3)
NOTE: Use a stereomicroscope placed under an LAF hood for this step.- Place the selected cystic SO with a small amount of medium on the lid of a 10 cm Petri dish using a wide-orifice P1000 pipette. Carefully excise byproducts of the SO using a sterile scalpel. Use sterile forceps on the opposite side to stabilize the organoid during the excision (Figure 3A).
NOTE: At this stage, the cystic SO resembles a deflated balloon with two layers of skin positioned one on top of the other. - Excise approximately 1 mm from the ends of the organoid adjacent to the first incision using a scalpel (Figure 3B,F). Gently unfold the upper layer of skin using sterile forceps (Figure 3C,G).
- Cut the piece of tissue into 2-4 pieces depending on size. Delicately transfer each piece of tissue and place it to a collagen-coated insert with the epidermis facing up, using sterile forceps (Figure 3D,H).
NOTE: Assess the pegs under a stereomicroscope to ensure correct epidermis orientation. - Transfer the insert back to a standard 12-well plate containing 600 µL of OMM. Place the plate back in the incubator at 37 °C with 5% CO2 (Figure 3E).
- Place the selected cystic SO with a small amount of medium on the lid of a 10 cm Petri dish using a wide-orifice P1000 pipette. Carefully excise byproducts of the SO using a sterile scalpel. Use sterile forceps on the opposite side to stabilize the organoid during the excision (Figure 3A).
- Long-term air-liquid interface culture maintenance
- Between Day 1 and Day 21 post flattening, perform a full medium change (600 µL) with OMM on Mondays, Wednesdays, and Fridays. Place the plate back in the incubator at 37 °C with 5% CO2 and 95% relative humidity.
- Between Day 21 and Day 27 post flattening, place the plate in an incubator at 37 °C with 5% CO2 without humidity to strengthen the skin barrier. Perform a full medium change (800 µL) with OMM daily.
Results
The optimization and checkpoints for the generation of cystic SOs have been extensively described14. The method presented here, therefore, focuses on the key checkpoints to assess during the development of cystic organoids (Figure 2A), the selection of those suitable for transition into planar SOs (Figure 2B), and the criteria used to evaluate the quality of the resulting planar SOs (Figure 1B-D and Figure 4).
The first key step in the development of cystic SOs is the formation of a single, dense cellular aggregate that incorporates the majority of the cells present in the well at Day 0 (Figure 2A). This is achieved through careful and rapid handling of hiPSCs, combined with efficient centrifugation, resulting in a homogeneous distribution of cells at the center of the well (Figure 2A, Day -2). Proper induction of surface ectoderm leads to the formation of a thin, clear epithelium on the outermost layer of the aggregate by Day 3 (Figure 2A), which subsequently develops, following mesenchymal cell induction, into transparent cystic aggregates containing a dark core of mesenchymal cells by Day 8. Between Day 12 and 20, the epithelial cyst becomes covered by a thin layer of mesenchymal cells that accumulate at one pole of the cyst (Figure 2A, Day 12). Successful co-induction of epithelial and mesenchymal cells ultimately results in a stratified epithelium, enabling the formation of hair placodes and pegs, which become visible between Days 50 and 80 (Figure 2A,B). By selecting appropriate SOs based on these developmental checkpoints, morphological and size variability can be minimized at the time of transition to planar SOs.
The presence of hair placodes or pegs is the primary inclusion criterion for selecting cystic SOs for further development into planar SOs. The absence of visible placodes usually results from a defect in epidermal stratification, which then appears extremely thin (Figure 2B, Day 50, middle panel). For flattening, only large cysts (at least 5 mm in diameter) with byproducts concentrated at one pole and overall minimal byproducts are used, while those with non-polarized byproducts are excluded (Figure 2B).
Once in their planar configuration, the primary quality check of SOs relies on the macroscopic monitoring of HF growth under a stereomicroscope. HFs elongate progressively throughout the 27 days of ALI culture, with sebaceous glands becoming visible around Day 14 and pigmentation gradually increasing over time (Figure 1B,C). Due to spatial constraints imposed by the insert membrane lying just beneath the thin collagen gel, only HFs located at the periphery of the planar SO can fully grow, and they do so in an orientation parallel to the insert (Figure 1C). Notably, the hair shaft seldom protrudes beyond the surface of the skin. To further assess the quality of the developed planar SOs, they can be embedded in paraffin or OCT, sectioned, and stained to examine their composition and morphology. H&E staining reveals that their structure closely resembles that of human skin (Figure 4A), with a fully stratified epithelium and a dermis separated by a basement membrane. Immunofluorescence staining using specific markers for the different epidermal layers, sebaceous glands, and melanocytes further confirms the human skin-like tissue architecture of the planar SOs (Figure 1D and Figure 4B).
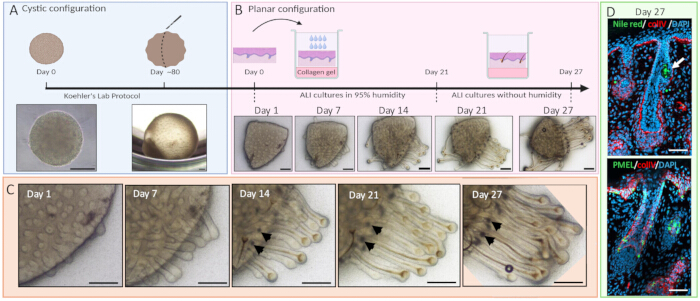
Figure 1: Workflow for generating planar SOs containing HFs from hiPSCs using an ALI culture system. Schematic representation and representative images of key steps are shown. (A) Generation of cystic SOs, essentially as previously described10, until visible hair placodes/pegs form around Day 80. (B) Cystic SOs are incised and flattened, with the epidermis side facing upward, on a type I collagen-coated cell culture insert. ALI cultures are maintained for 21 days under humidified conditions, followed by 6 days in dry conditions. (C) High-magnification view of a region shown in (B), illustrating hair follicle growth, sebaceous gland-like structure development (arrowheads), and progressive pigmentation over time. (D) Confocal images of planar SO sections at Day 27 post-flattening, labeled with anti-type IV collagen antibody together with either Nile red, which marks sebaceous gland-like structures, or anti-PMEL antibody, which stains melanocytes. Nuclei are counterstained with DAPI. Scale bars: 200 µm (A); 500 µm (B,C); 50 µm (D). Abbreviations: SOs = skin organoids; HFs = hair follicles; hiPSCs = human induced pluripotent stem cells; ALI = air-liquid interface; Col IV = type IV collagen; PMEL = premelanasome protein; DAPI = 4',6-diamidino-2-phenylindole. Please click here to view a larger version of this figure.
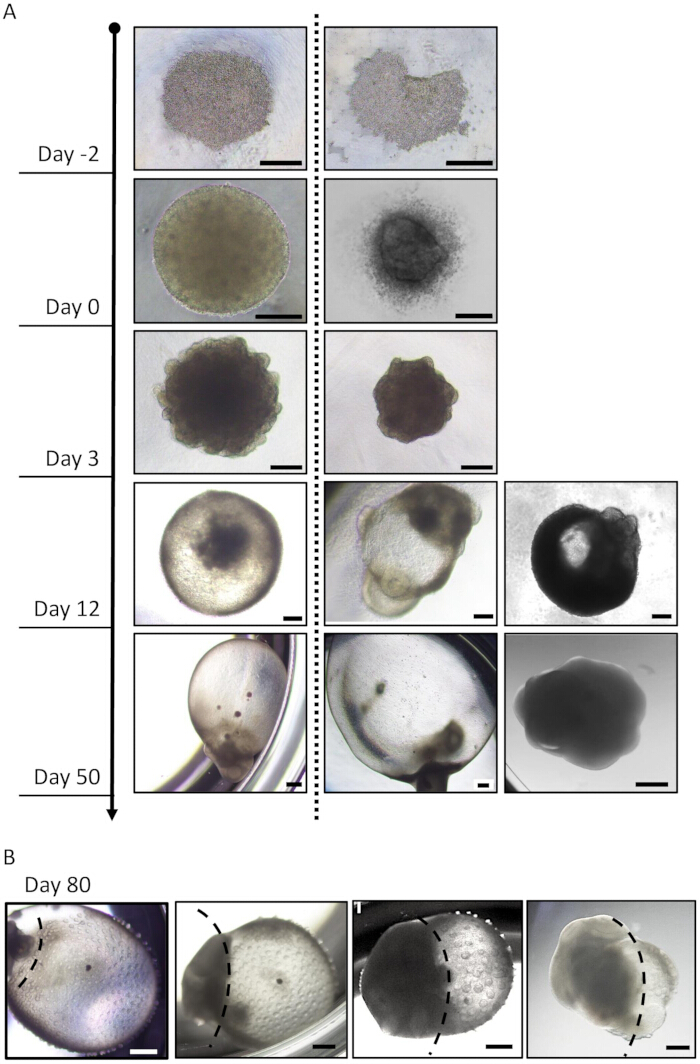
Figure 2: Representative images of cell aggregate morphology at key steps during SO production. (A) Representative images of cystic SOs with appropriate (left panels) and inadequate (middle and right panels) morphologies at different stages. At Day -2, cell aggregates should display a uniform distribution (left panel), whereas improper plate handling after centrifugation may disrupt cell distribution (right panel). At Day 0, well-formed aggregates appear as compact, dense cellular clusters (left panel), while low cell viability results in widespread cell death and loss of the compact 3D structures (right panel). At day 3, a distinct outer epithelial layer becomes visible (left panel), its absence may indicate that BMP4 concentration needs optimization (right panel). At Day 12, mesenchymal cells accumulate at one pole and migrate to envelop the epithelial cyst (left panel), whereas excessive epithelial (middle panel) or mesenchymal (right panel) differentiation impedes proper epithelial stratification. At Day 50, SOs exhibit bipolar morphology, with cystic skin on one side and by-products, predominantly cartilage, on the other (left panel). Excessive epithelial (middle panel) or mesenchymal (right panel) differentiation hinders proper skin development. (B) Representative images of cystic SOs with visible hair pegs at around Day 80. Note the variable proportion of by-products (left to the dashed curve) relative to the skin. The three leftmost panels allow the generation of 2-4 planar SOs, while the rightmost panel shows a SO of insufficient quality for flattening. Scale bars: 500 µm for Day -2, Day 50, and Day 80; 200 µm for Day 0, Day 3, and Day 12. Abbreviation: SO = skin organoid. Please click here to view a larger version of this figure.
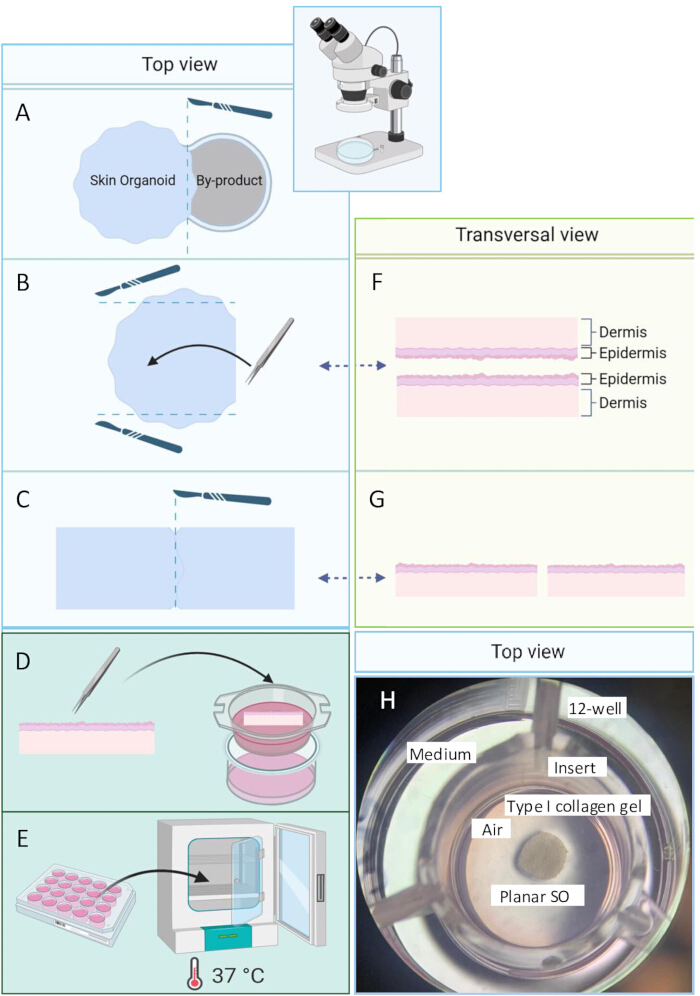
Figure 3: Schematic representation of the technical steps for producing planar SOs. Perform flattening of cystic SOs under a stereomicroscope within an LAF hood. (A) Excise the pole accumulating by-products from the cystic SO using a sterile scalpel. (B) Trim the upper and lower extremities of the SO to facilitate tissue unfolding. (C) Cut the planar tissue into 2-4 pieces. Transfer and flatten each piece, epidermal side up, onto a collagen-coated insert using sterile forceps. (D) Place the culture insert containing the flattened tissue into a standard 12-well plate containing 600 μL of medium. (E) Incubate the plate at 37 °C with 5% CO2. (F) Schematic transversal view of the skin organoid depicted in (B). (G) Schematic transversal view of the skin organoid depicted in (C). (H) Image of a planar SO placed on a type I collagen gel poured onto a cell culture insert positioned in a 12-well plate containing 600 μL of medium. Abbreviations: SO = skin organoid; LAF = laminar air flow. Please click here to view a larger version of this figure.
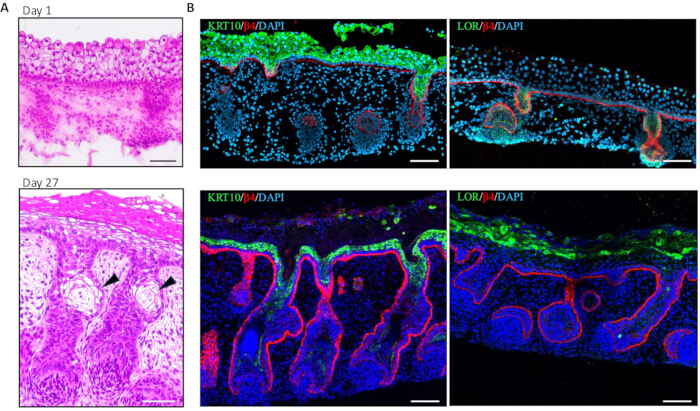
Figure 4: Characterization of hiPSC-derived planar SOs. (A) Representative bright-field images of H&E-stained planar SO at Days 1 and 27 post flattening. By Day 27, the planar SOs show skin maturation with a pluristratified epidermis and HFs containing sebaceous gland-like structures (arrowheads). (B) Confocal images of planar SO sections stained with anti-β4 integrin and either anti-keratin 10 or anti-loricrin antibodies show early suprabasal differentiation (KRT10+ cells) at Day 1 and late differentiation (LOR+ layer) at Day 27. Nuclei are counterstained with DAPI. Scale bars: 50 µm (A); 100 µm (B). Abbreviations: SO = skin organoid; hiPSC = human induced pluripotent stem cell; H&E = hematoxylin and eosin; β4 = b4 integrin; KRT10 = keratin 10; LOR = loricrin; DAPI = 4',6-diamidino-2-phenylindole. Please click here to view a larger version of this figure.
Discussion
The protocol described here overcomes a key limitation of the cystic SO system by restoring native tissue orientation and environment through tissue flattening and exposure of the apical epidermis to air. This method preserves the organoid's intrinsic cellular and structural complexity, promotes physiologically relevant organization, and provides direct access to the pluristratified epidermal surface for experimental manipulation.
Several steps in the protocol are critical for achieving high-quality planar SOs, beginning with the generation of high-quality cystic SOs. Key quality control checks and potential protocol modification points have been extensively described before12. Briefly, the starting point should be well-maintained, undifferentiated hiPSC cultures at 70-80% confluency, displaying tightly packed cells with a high nuclear-to-cytoplasmic ratio. Generation of cystic SOs requires precise modulation of BMP4 signaling during surface ectoderm induction12. As BMP4 sensitivity can vary between hiPSC lines, titration may be necessary for optimal results. Testing BMP4 concentrations between 2.5 and 15 ng/mL is recommended, as no successful cases have been reported outside this range. Consistency in reagent source is also important; therefore, bulk stocks from a single supplier should be prepared and stored in the recommended conditions and used before their expiration date to ensure full biological activity and minimize variability.
Selecting cystic SOs with appropriate morphology and size is crucial for successful SO flattening. The maturation of cystic SOs and consequently the formation of pegs and hair placodes-may vary between hiPSC lines, therefore, the timing of flattening can range from Day 70 to Day 90. The addition of CHIR99021, a GSK3 inhibitor and WNT signaling agonist, at Day 3 of cystic SO formation may be considered, as it has been shown to increase organoid size and reduce cartilage formation by promoting proliferation and inhibiting neural crest migration12. Although promising, we have not observed consistent results with this modification in our cultures.
The flattening process requires manual dexterity and familiarity with the tissue. Notably, during the transfer of the skin fragment onto the coated insert, care must be taken to ensure correct tissue orientation. Verifying the orientation using fine forceps under a stereomicroscope and gently adjusting the tissue until the apical side faces upward is recommended. When positioned properly, pegs/hair placodes should face downward. Following the transfer of planar SOs to ALI culture, the HFs typically begin to show noticeable growth and hair shaft pigmentation within a few days.
The main limitations of the described model are the time and the high level of maintenance required, and the model's immaturity. The development of cystic SOs endowed with hair pegs takes between 70 to 90 days and is followed by 4 weeks of ALI culture. This extended timeline, combined with a laborious flattening procedure, makes the system less suitable for high-throughput applications, especially compared to commercially available human skin equivalents. While minor optimizations may slightly reduce culture time, a substantial reduction is unlikely. The high cellular and structural diversity of the skin depends on a complex sequence of epithelial-mesenchymal interactions and mechanical cues, which likely cannot be accelerated by the addition of exogenous factors in vitro15,16,17,18. The formation of cystic SOs and their progression into the planar form require a high level of maintenance. One of the most handling-intensive periods-apart from the first 18 days of cystic culture-occurs when planar SOs are maintained in a low-humidity atmosphere and require daily medium replenishment. Similar to other hiPSC-derived models, SOs retain a fetal-like phenotype in vitro. Furthermore, sweat glands and arrector pili muscles are largely absent in SOs14, likely due to the lack of vascularization, immune cells, and mechanical forces such as shear stress, stretching, and friction-all of which are essential for proper maturation15,16,17,18,19. Some of these limitations may be addressed by increasing the complexity of the model. Co-culture with autologous hiPSC-derived macrophages17, integration of a perfusion system9, or application of mechanical stretching17 may help promote model maturity20,21.
It should be noted that the transwell insert format somewhat restricts the downward growth of HFs in the planar SOs. As a result, HFs tend to spread laterally and may become exposed to the air. Since HFs are normally protected within the skin in vivo, this should be considered when designing experiments. Modifying the insert coating by applying a thicker hydrogel layer may help mitigate this issue. Additionally, hair shafts rarely protrude beyond the skin surface in this model. Our observations indicate that HFs in planar SOs remain in anagen, the active growth phase, until day 27 of ALI culture. Given the extended duration of anagen in human HFs, this is not entirely unexpected. Although long-term culture may eventually support phase transition, this is unlikely in the absence of systemic cues. Identifying and supplementing the molecular signals required for follicular cycling may enable artificial induction of the catagen and telogen phases.
In summary, the protocol to generate planar SOs enables a wide range of experimental approaches that are not feasible or relevant in cystic SO. Planar SOs have already been successfully used to model bacterial11 and viral infections22, ultraviolet radiation-induced tissue damage22, and associated drug responses12,22,23. The ability to access the apical surface of a physiologically relevant, complex skin equivalent represents a substantial advancement for the field and opens the door to a variety of novel applications in skin research.
Disclosures
The authors have no conflicts of interest to declare.
Acknowledgements
We thank our colleagues at the hiPSC Hotel, Leiden University Medical Center, for providing hiPSC lines. This work was supported by the Novo Nordisk Foundation Center for Stem Cell Medicine supported by the Novo Nordisk Foundation, Denmark (grant number NNF21CC0073729) to K.R. K.R. is Chargé de Recherche at the Institut National de la Santé et de la Recherche Médicale (INSERM).
Materials
| Name | Company | Catalog Number | Comments |
|---|---|---|---|
| Advanced DMEM/F12 | Thermo Fisher Scientific | #12634010 | referred to as Advanced medium in the text. |
| ALK5, inhib.TGFb type 1, SB431542 | Tocris Bioscience | #1614 | Aliquot, store at -20 °C and keep at 4 °C for a maximum of 7 days |
| Anti-CD104 rat monoclonal clone 439-9B antibody | BD Biosciences | #555719 | NA |
| anti-collagen type IV polyclonal antibody | MerckMillipore | #Ab769 | NA |
| Anti-cytokeratin 10 rabbit polyclonal antibody | Biolegend | #905401 | NA |
| Anti-loricrin rabbit polyclonal antibody | Biolegend | #905101 | NA |
| anti-PMEL mouse monoclonal antibody | Novus Biologicals | #NBP2-29407 | NA |
| B-27 Supplement, Minus Vitamin A | Thermo Fisher Scientific | #12587010 | Aliquot, store at -20 °C |
| Cell culture inserts | Greiner Bio-one | #665641 | 12-well, pore size 0.4 µm; transparent (48 inserts/box) ; https://shop.gbo.com/en/row/products/bioscience/3d-cell-culture/thincert/3d-thincert-cell-culture-inserts/665641.html |
| Collagen Type I | Corning | #354249 | Keep stock solution at 4 °C |
| Disposable scalpel sterile 0507 No. 21 | Swann Morton | #0507 | NA |
| Dulbecco’s Phosphate-Buffered Saline (DPBS) | Thermo Fisher Scientific | #14190094 | NA |
| Essential 6 (E6) medium | Thermo Fisher Scientific | #A1516401 | referred to as hiPSC minimal medium (hiMinM) in the text. |
| Fasudil | LC Labs | #F-4660 | Aliquot a 1000x stock solution and store at -20 °C. Once thawed, keep at 4 °C for a maximum of 14 days |
| Gentle Cell Dissociation Reagent | Stemcell Technologies | #100-0485 | NA |
| GlutaMAX Supplement | Thermo Fisher Scientific | #35050038 | NA |
| Human FGF-2 basic prenium grade | Miltenyi Biotec | #130-093-842 | Aliquot, store at -80 °C and keep at 4 °C for a maximum of 7 days |
| LDN 193189 dihydrochloride | Tocris | #6053 | Aliquot , light-sensitive, store at -20 °C |
| Matrigel Growth Factor Reduced Basement Membrane Matrix | Corning | #354230 | Aliquot, store at -20 °C and keep at 4 °C for a maximum of 7 days |
| 2-Mercaptoethanol | Thermo Fisher Scientific | #21985023 | Hazardous substance, toxic, corrosive, irritant, health and environmental hazard. |
| NaOH | Merck | #567530-250MG | Hazardous substance, corrosive and irritant. Prepare a solution extemporaneously. |
| Neurobasal Medium | Thermo Fisher Scientific | #21103049 | referred to as Neural Basal medium in the text. |
| Normocin 50 mg/ml | Invivogen | #ant-nr-1 | referred to as antibiotic-antimycotic supplement, in the test. Aliquot, store at -20 °C and keep at 4 °C for a maximum of 14 days |
| Nunclon Sphera 96-WellU-Bottom Microplate | Thermo Fisher Scientific | #174929 | NA |
| Nunclon Sphera 174930 24-well multidish | Thermo Fisher Scientific | #174930 | NA |
| N2 Supplement | Thermo Fisher Scientific | #17502048 | Aliquot , store at -20 °C |
| Orbital shaker | Thermo Fisher Scientific | #88881102 | NA |
| Penicillin-Streptomycin | Thermo Fisher Scientific | #15070063 | NA |
| Recombinant human BMP4 protein | R&D Systems | #314-BP-010 | Aliquot, store at -80 °C and keep at 4 °C for a maximum of 7 days |
| StemFlex (SF) medium | Thermo Fisher Scientific | #A3349401 | referred to as hiPSC maintenance medium (hiMM) in the text. |
| SteriMax smart - Infrared Loop Sterilizer | WLD-TEC | #4.002.000 | Optional |
| Tweezers | Merck | #T4537-1EA | Style 5; fine needle-sharp, anti-magnetic stainless steel |
| Vitronectin | Stemcell Technologies | #07180 | NA |
References
- Kolarsick, P. A. J., Kolarsick, M. A., Goodwin, C. Anatomy and physiology of the skin. J Dermatol Nurses Assoc. 3 (4), 203-213 (2011).
- Karimkhani, C., et al. Global skin disease morbidity and mortality: An update from the Global Burden of Disease Study 2013. JAMA Dermatol. 153 (5), 406(2017).
- Seth, D., et al. Global burden of skin disease: Inequities and innovations. Curr Dermatol Rep. 6 (3), 204-210 (2017).
- Grada, A., Mervis, J., Falanga, V. Research techniques made simple: Animal models of wound healing. J Invest Dermatol. 138 (10), 2095-2105.e1 (2018).
- Zomer, H. D., Trentin, A. G. Skin wound healing in humans and mice: Challenges in translational research. J Dermatol Sci. 90 (1), 3-12 (2018).
- Vig, K., et al. Advances in skin regeneration using tissue engineering. Int J Mol Sci. 18 (4), 789(2017).
- Chu, X., et al. Functional regeneration strategies of hair follicles: Advances and challenges. Stem Cell Res Ther. 16 (1), 77(2025).
- Motter Catarino, C., Cigaran Schuck, D., Dechiario, L., Karande, P. Incorporation of hair follicles in 3D bioprinted models of human skin. Sci Adv. 9 (41), eadg0297(2023).
- Kageyama, T., Miyata, H., Seo, J., Nanmo, A., Fukuda, J. In vitro hair follicle growth model for drug testing. Sci Rep. 13 (1), 4847(2023).
- Abaci, H. E., et al. Tissue engineering of human hair follicles using a biomimetic developmental approach. Nat Commun. 9 (1), 5301(2018).
- Lee, J., et al. Hair-bearing human skin generated entirely from pluripotent stem cells. Nature. 582 (7812), 399-404 (2020).
- Jung, S., et al. Wnt-activating human skin organoid model of atopic dermatitis induced by Staphylococcus aureus and its protective effects by Cutibacterium acnes. iScience. 25 (10), 105150(2022).
- Zhang, M., et al. Recessive cardiac phenotypes in induced pluripotent stem cell models of Jervell and Lange-Nielsen syndrome: Disease mechanisms and pharmacological rescue. Proc Natl Acad Sci U S A. 111 (5), E5383-E5392 (2014).
- Lee, J., et al. Generation and characterization of hair-bearing skin organoids from human pluripotent stem cells. Nat Protoc. 17 (5), 1266-1305 (2022).
- Hu, M. S., et al. Embryonic skin development and repair. Organogenesis. 14 (1), 46-63 (2018).
- Li, K. N., Tumbar, T. Hair follicle stem cells as a skin-organizing signaling center during adult homeostasis. EMBO J. 40 (11), e107135(2021).
- Biggs, L. C., Kim, C. S., Miroshnikova, Y. A., Wickström, S. A. Mechanical forces in the skin: Roles in tissue architecture, stability, and function. J Invest Dermatol. 140 (2), 284-290 (2020).
- Gopee, N. H., et al. A prenatal skin atlas reveals immune regulation of human skin morphogenesis. Nature. 635 (8039), 679-689 (2024).
- Tokuyama, E., Nagai, Y., Takahashi, K., Kimata, Y., Naruse, K. Mechanical stretch on human skin equivalents increases the epidermal thickness and develops the basement membrane. PLoS One. 10 (11), e0141989(2015).
- Bai, X., et al. Organoid research: Theory, technology, and therapeutics. Organoid Res. 1 (1), 025040007(2025).
- Wang, Y., et al. Organoid research breakthroughs in 2024: A review. Organoid Res. 1 (2), 025040005(2025).
- Li, P., et al. Mpox virus infection and drug treatment modelled in human skin organoids. Nat Microbiol. 8 (11), 2067-2079 (2023).
- Kim, M. J., Ahn, H. J., Kong, D., Lee, S., Kim, D. H., Kang, K. S. Modeling of solar UV-induced photodamage on the hair follicles in human skin organoids. J Tissue Eng. 15, 20417314241248753(2024).
Reprints and Permissions
