This protocol provides detailed operations on sample preparation, data collection, and analysis of DNA intrinsic fluorescence spectra.
Method Article
Spectroscopic Super-resolution Imaging of DNA Molecules using Intrinsic Contrast
In This Article
Summary
Abstract
Super-resolution imaging has revolutionized biological research by revealing structural details at the nanoscale. Most optical super-resolution methods rely on fluorescent labeling of biomolecules, which enables specific tagging of molecular species but can disrupt cellular functions, introduce inaccuracies from linker molecules, and fail to provide the consistent high labeling density required for chromatin imaging at the scale of individual DNA molecules. A technology that enables label-free, in situ genomic imaging with nanometer resolution would profoundly impact biology. Here, we present a protocol that harnesses the intrinsic fluorescence of DNA to perform spectroscopic single-molecule localization microscopy (sSMLM). The protocol details sample preparation, data acquisition, and spectral analysis. Briefly, a thin DNA gel is created by depositing a polynucleotide solution onto glass and allowing it to dry for hours. After gel formation, the sample is imaged in the presence of an imaging buffer using sSMLM. The recorded dataset comprises a zeroth-order image, providing spatial localizations, and a first-order image, encoding the emission spectrum of each localization. Spatial reconstructions are generated from the zeroth-order data, after which the corresponding spectra are extracted from the first-order signal. Finally, we demonstrate the feasibility of this approach using multiple excitation wavelengths and DNA molecules with varying lengths, sequences, and compositions.
Introduction
Super-resolution fluorescence microscopy techniques -- including structured illumination microscopy (SIM), stimulated emission depletion microscopy (STED), and single molecule localization microscopy (SMLM) approaches such as photoactivated localization microscopy (PALM) and stochastic optical reconstruction microscopy (STORM) -- have pushed the resolution of optical microscopy far beyond the diffraction limit1,2,3,4,5,6,7, enabling unprecedented access to the nanoscale organization of chromatin8,9,10,11,12. However, current staining methods for visualizing nucleic acid structures rely on labeling DNA-associated proteins rather than DNA itself or employ small-molecule dyes that can disturb native chromatin configuration and compromise cell viability13,14. Due to these limitations, the development of label-free optical super-resolution imaging methods under native, non-perturbing conditions is highly desirable. The protocol presented here is intended for synthetic purified single-stranded or double-stranded DNA nucleotides, where intrinsic fluorescence can be reliably detected; it is not optimized for imaging nuclear DNA molecules in fixed-cell or live-cell.
Since nucleic acids were long considered non-fluorescent owing to their extremely low quantum yield (on the order of 10−4 under UV excitation) and ultrafast fluorescence decay at room temperature15, studies of the intrinsic fluorescence of DNA (mainly the fluorescence lifetime) were rare until femtosecond spectroscopy was developed. It has been well acknowledged that nucleotides fluoresce weakly under UV illumination, whereas their absorption in the visible range is considerably weaker. Nonetheless, it was recently observed that visible light-excited fluorescence of unmodified nucleic acids at physiologically relevant concentrations exists16. This phenomenon had likely been overlooked because most photochemical studies of nucleotides were performed in dilute solutions (10-100 µM)17,18,19,20, while in nuclei and chromosomes, DNA concentrations can reach 0.1-1 M21,22,23. More importantly, stochastic fluorescence switching under visible illumination was observed16, laying the groundwork for using unmodified nucleic acids as endogenous contrast agents for localization-based super-resolution microscopy.
The photochemical characteristics of nucleotide monomers and single-stranded DNA molecules with simple sequences at physiological concentrations under visible-light excitation have been explored24. It has also been demonstrated that these DNA molecules have stochastic fluorescence switching properties, which aligns well with the theory of ground state depletion (GSD)6,7 by examining the fluorescence recovery of nucleotides under varying depletion conditions. Moreover, because nucleotides exhibit relatively high quantum yields and low intersystem crossing probabilities, the photon counts and blinking durations of single-molecule emission events are comparable to those of popular exogenous dyes in STORM (e.g., Alexa Fluor 647), exhibiting distinct spectra25,26 and making DNA an ideal intrinsic contrast agent for high-resolution imaging. Additionally, implementing the spectral regression algorithm described in the previous section enables sub-ten-nanometer super-resolution imaging of polynucleotides and linear single-stranded DNA fibers27.
To capture the full spectrum of DNA intrinsic fluorescence, we employed a dual-wedge prism (DWP) for spectral detection, which enables concurrent high-throughput single-molecule spectroscopic analysis and imaging with minimal transmission loss and wavefront error28,29,30, and an open source spectroscopic SMLM analysis software (RainbowSTORM) for automatic data processing31,32. Building on this capability, we developed a multi-laser SMLM platform integrated with spectroscopic detection and a dedicated spectral analysis pipeline. The protocol we present here encompasses sample preparation, data acquisition, and analysis, providing a reproducible workflow for harnessing DNA intrinsic fluorescence in single-molecule localization microscopy. Beyond enabling proof-of-concept studies on imaging single-stranded oligonucleotides and double-stranded DNA molecules with intrinsic contrast, the approach established a foundation for broader applications in DNA imaging under native, label-free conditions, such as sequence prediction based on intrinsic fluorescence of DNA combined with computational methods.
Protocol
1. Preparation of DNA gel samples (Figure 1A)
- Dissolve the DNA sample (either oligonucleotide or double-stranded DNA) powder in nuclease-free deionized water to a final concentration of 100 mM and store the stock solution at -4 °C.
- Prepare 5 µL aliquots to minimize repeated freeze-thaw cycles. If using frozen aliquots, thaw them at room temperature for 5-15 min, depending on the volume.
- Clean a glass slide gently with a laboratory wipe. Pipette 5 µL of the 100 mM DNA molecule solution onto the freshly cleaned glass slide and allow it to evaporate for 1-3 h, forming a DNA gel.
- Operate this step in a fume hood for safety. Prepare imaging buffer as per Table of Materials. Both β-mercaptoethanol buffer and DABCO buffer were validated to support stochastic photo-switching of DNA molecules.
- Operate this step in a fume hood for safety. Add 5 µL of imaging buffer to the DNA gel and place a coverslip on top immediately before imaging. There could be bubbles inside the covered sample. Use a tweezer to remove the bubbles inside the covered sample,
2. Calibration of the sSMLM system and data acquisition (Figure 1B)
- Prepare a fabricated nanohole array with a hole diameter of 100 nm and a spacing of 4 µm, arranged in 8 rows x 5 columns for the following calibration of the spectroscopic SMLM system33.
NOTE: Alternatively, the United States Air Force (USAF) 1951 resolution chart (R3L1S4N) can also be used for the spectral calibration33.- Produce the nanohole array by sequential metal sputtering and focused ion beam (FIB) milling. First, deposit a 150-nm-thick aluminum film onto a 22 x 22 mm borosilicate glass coverslip using DC sputtering at 75 W with 20 standard cubic centimeters per minute (SCCM) argon flow at 3 mTorr.
- Pattern a 5 x 8 nanohole array into the aluminum layer using FIB milling operated at an acceleration voltage of 30 kV.
- Turn on the spectroscopic SMLM system (Figure 2), insert narrow-bandwidth filters (532 nm, 580 nm, 633 nm, 680 nm, and 750 nm) directly in front of the camera, and use a white light source (e.g., the microscope lamp) to illuminate the calibration sample.
- Collect 10 frames with each filter. Set the exposure time for 532 nm, 580 nm, 633 nm, and 680 nm to 200 ms and to 2000 ms for 750 nm due to the low intensity of the lamp and the low efficiency of the camera in the near infrared region (Figure 3).
- Load the DNA gel sample on the microscope, make sure that the coverslip side is facing the objective, and open the camera software for data acquisition.
- Identify the appropriate z-position with the aid of the automatic focus tracking system, ensuring that clear stochastic blinking is visible. This step is critical and requires patience as DNA gel samples lack obvious morphological cues such as cell structures, making it difficult to navigate to a proper signal.
- Ensure that the objective does not touch the coverslip edge, as this may cause buffer leakage into the immersion oil and interfere with the tracking.
- Acquire 10,000-30,000 frames with a typical illumination power of 5 kW/cm² and an exposure time of 30 ms. Adjust the number of frames, illumination power, and the exposure time as needed. After the acquisition, the software will save the data in nd2 format by default.
- After completing the experiment, dispose of the glass slide in an approved sharps waste container (e.g., broken glass or sharps disposal bin), and discard all remaining buffers into the designated chemical liquid waste container in accordance with institutional safety guidelines.
3. Analysis of calibration and spectroscopy data (Figure 1C)
- Load the acquired raw image stack of the DNA sample into FIJI (Windows 64-bit), using the Bio-Formats Plugin.
- Subtract the minimum projection from the stack to obtain a background-subtracted dataset and save it for spectral analysis. For the loaded raw image stack, select Image > Stacks > Z Project and choose Min intensity in the Projection type. Then select Process > Image calculator to subtract the minimum projection from the raw image stack and save it as a TIFF.
- Perform localization identification on the zeroth-order raw image stack using the ThunderSTORM plugin (version 1.3). Use appropriate parameters (e.g., threshold = 1.2 x std (Wave.F1), sigma = 1.5, fit radius = 3) to reconstruct the zeroth-order image and extract the emission event coordinates (units: nm). For the cropped zeroth-order raw image stack, select Plugin > ThunderSTORM > Run analysis.
- Use FIJI and the open-source software RainbowSTORM (GitHub link in32, with MATLAB version newer than 2020b) to process the calibration data to obtain the relation between horizontal and vertical shifts and the wavelengths31,32.
- Perform localization identification on the calibration images of the 5 wavelengths using the ThunderSTORM plugin. Use appropriate parameters (e.g., threshold = 5 x std (Wave.F1), sigma = 1.5, fit radius = 3) to reconstruct the localizations of the nanoholes on the zeroth order and their corresponding spectral localizations on the first order.
- Adjust the threshold (e.g., in a range of 5-10 x std (Wave.F1)) until there are 80 localizations for each calibration image.
- Run the RainbowSTORM and click Spectral Calibration > Browse and load the CSV files for each calibration wavelength (532 nm, 580 nm, 633 nm, 680 nm, 750 nm) from the previous step. Click Save Calibration File.
- Convert the nanometer-based coordinates into pixel coordinates and map them to the corresponding spectral window based on the horizontal and vertical shifts from the zeroth order to the first order, determined in the calibration (Figure 4), in order to measure the full spectrum of DNA intrinsic fluorescence.
- Use customized Python scripts34 (version 3.11.7) to extract the full spectrum data with the following steps.
- Set correct file paths for the background-subtracted image stack (.tiff) from step 3.2, the localization CSV file (.csv) produced from step 3.3, and the calibration file from step 3.4 (.mat).
- Use 900-950 pixels as the horizontal shift for the 488 nm data acquired with the 3D DWP, corresponding to a spectral window of 484-588 nm, slightly broader than the 500-550 nm filter range to ensure coverage.
- Use 925-984 pixels as the horizontal shift for the 532 nm data acquired with the 3D DWP, corresponding to a 525-750 nm spectral window, again chosen to be broader than the 590-650 nm filter range.
- Use 23 pixels as the vertical shift for both the 488 nm and 532 nm data with the 3D DWP.
The above values were derived from the spectral calibration curve obtained using RainbowSTORM. The Python scripts for the full spectrum measurement can be found in34.
- Linearize the nonlinear spectrum for subsequent analysis (comparison, classification, etc.) using a 3rd order polynomial fitting (Figure 3).
Results
The complete process -- from sample preparation to data acquisition and analysis -- for one image stack of a DNA sample takes approximately 120 min, assuming DNA gel formation requires 1 h (Figure 1). The combined time for thawing, gel formation, and spectral calibration is fixed at about 90 min, regardless of the number of images or samples in the experiment. To maximize efficiency, we recommend collecting multiple image stacks across several samples in a single session.
Representative real-time images obtained after the DWP are shown in Figure 1B and Figure 3A, where fluorescence signals are split into the zeroth order (left, containing spatial information) and the first order (right, containing spectral information). In Figure 1B, images were acquired using the 2D DWP configuration, in which the separation between zeroth- and first-order images is relatively small. In contrast, Figure 3A shows data collected using the 3D DWP, where the two diffraction orders are more widely separated due to the engineered optical path difference required for biplane 3D imaging. All data presented in Figure 1C, Figure 3, and Figure 4 were collected using the 3D DWP configuration. The choice between 2D and 3D imaging depends on the experimental objective: for intrinsic fluorescence spectral measurements of synthesized DNA samples, the 2D DWP is generally preferred because these samples lack relevant three-dimensional structural features, although the 3D DWP configuration can also be used when axial information is desired.
Together, these representative results demonstrate the core capability of the DWP-based imaging platform to simultaneously resolve spatial localization and emission spectra from individual DNA molecules in real time. Proper system performance is indicated by the clear and stable separation between the zeroth-order spatial image and the first-order spectrally dispersed image, with each single-molecule localization in the zeroth-order corresponding to a distinct spectral trace in the first-order. Quantitative spectral analysis is performed by identifying isolated single-molecule events in the zeroth-order image, measuring the relative pixel shift of the associated first-order signal, and converting this shift into wavelength using a calibrated mapping function. Because the relationship between pixel displacement and emission wavelength is nonlinear, a third-order polynomial fit is applied to accurately reconstruct linear emission spectra from raw data28. The resulting single-molecule spectra can be further integrated into computational analysis pipelines, including machine learning or deep learning models, to enable spectral classification and inference of DNA sequence composition or molecular structure based on intrinsic fluorescence signatures under different illumination conditions and photophysical states.
All data shown in this protocol were collected using the β-mercaptoethanol-based imaging buffer35. In principle, any imaging buffer that enhances fluorophore photo-switching behavior should be compatible with this approach, e.g., DABCO-based imaging buffer36. The tested DNA molecules include 20-base single-stranded A, G, C, T; 40-base single-stranded AC chain (A1C1, A5C5, A10C10, A20C20); single-stranded 5-, 8-, 12-, 16- base Guanine; 20-base pair double-stranded GC and AT (see Table of Materials for detailed information). The selection of 20- and 40-base DNA constructs is based on the observation that a 40-base DNA chain adopts a compact conformation with an effective size of less than 40 x 3.4 = 13.6 nm, placing it below the resolution limit of the reconstructed SMLM image. The excitation wavelengths (488 nm and 532 nm) were not uniquely optimized for specific sequences but were rather selected to demonstrate that intrinsic DNA fluorescence can be robustly detected across different base compositions and conformational states using either wavelength. We tested the imaging buffer as shown in Supplementary Figure 1 and found almost no stochastic blink signals were detected, ruling out buffer components and glass surface treatments. Only the DNA gel + imaging buffer presented a significant number of blinks. The glass slides and coverslips were clean and carefully handled, while the sample gel was formed in an enclosed environment. Therefore, the detected signals are unlikely to come from impurities or substrate autofluorescence. We also measured the signal from the drying gel and DNA solution, both, and found there was no significant difference, so photochemical artifacts during drying are not the main source of the signals. Photodegradation products usually exhibit wide spectra and have no blinking properties, which were never observed in our study. The quantitative limits of detection, reflected by the minimum photon count of localizations, are 30 - 50 [photon count]. This value remains the same for DNA samples and labeled systems, such as AF647-labeled H3K9me3 in fixed cells. The average localization precision of the DNA intrinsic fluorescence is about 15 - 25 nm, while the AF647 is about 10 - 15 nm.
In the 2D scenario, the reconstructed SMLM image has a pixel size of 22 nm. The precision of the localizations of stochastic emissions has an average of ~20 nm, which describes the confidence interval of where the single molecule localizes. However, the samples tested for intrinsic fluorescence do not have biological structures, so the resolution of the structures cannot be interpreted. The coherent Raman scattering microscopy is reported to have a resolution of 250 - 300 nm37, and the UV two-photon has a resolution of 300 nm38. The signal-to-noise ratio of coherent Raman scattering imaging is in the magnitude of 10 - 10039, while it is 2 - 20 (often expressed as signal-to-both-standard-deviation, SSDR) for UV 2-photon microscopy40,41. The SNR for DNA intrinsic fluorescence using sSMLM is about 5 due to the low photon count and limitations imposed by camera detection noise.
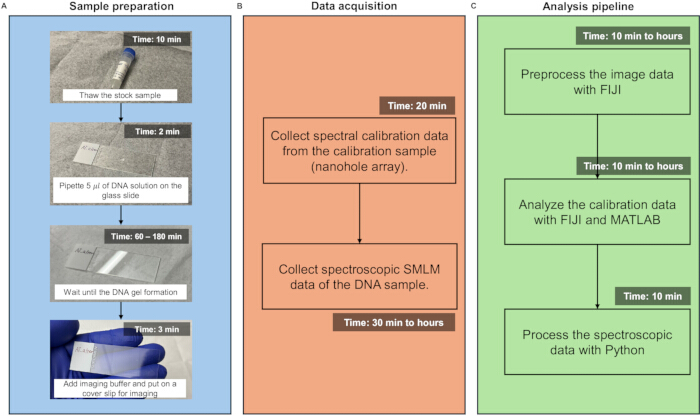
Figure 1: Workflow with estimated durations. (A) Sample preparation involves thawing the stock, preparing the DNA gel, and adding imaging buffer. The total time varies from 1-3 h depending on the sample and environment. (B) Each acquisition requires a calibration process with a specially designed nanohole array sample. The total calibration time will be about 20 min, and the data acquisition time for one image stack will be about 10 min, including sample searching (10,000 frames and 50 ms exposure time). (C) The analysis pipeline involves FIJI preprocessing and spectral analysis in Python. The preprocessing in FIJI takes about 10 min, while the spectral analysis is fast with the established codes. The presented spectra were collected from 16-base Guanine. Please click here to view a larger version of this figure.
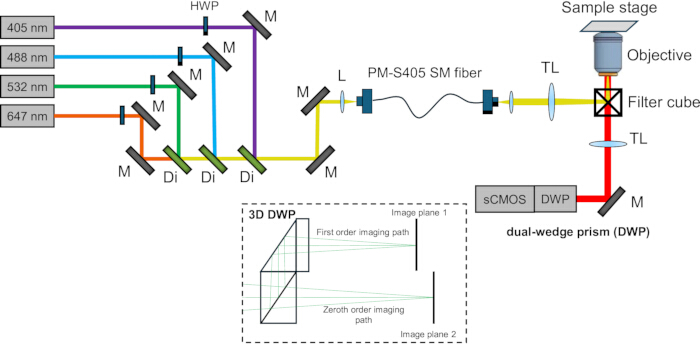
Figure 2: Optical schematic. The four laser lines (405 nm, 488 nm, 532 nm, 647 nm) are directed to the inverted microscope via laser alignment, making the system stable and easy to operate. The DWP is placed right before the sCMOS camera, enabling spectroscopic single-molecule detection. When calibrating for the DWP, a filter wheel will be inserted between the camera and the DWP. Please click here to view a larger version of this figure.
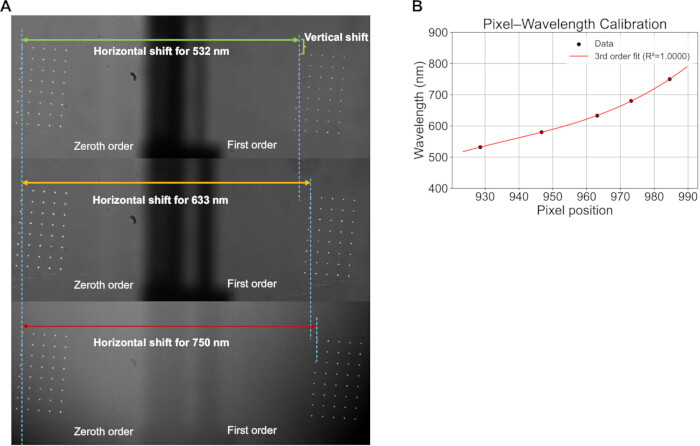
Figure 3: Spectral calibration. The calibration wavelengths used are 532 nm, 580 nm, 633 nm, 680 nm, and 750 nm. By sequentially placing narrow bandwidth filters with these central wavelengths after the DWP and before the camera, the corresponding horizontal and vertical shifts of different wavelengths can be measured, allowing the mapping of a calibration curve between pixel position and wavelength. Please click here to view a larger version of this figure.
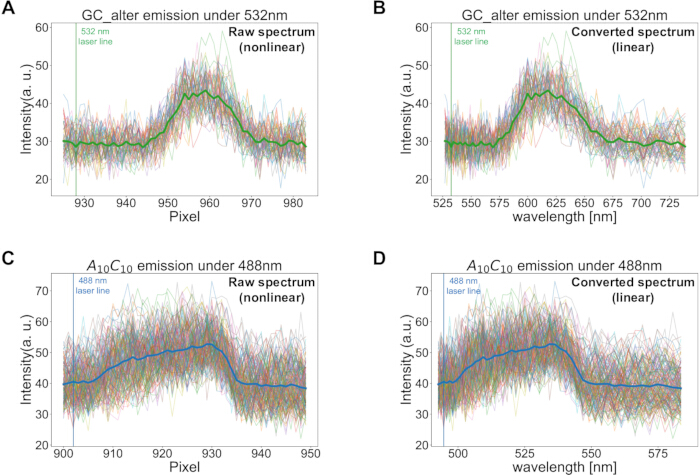
Figure 4: Spectra of selected double-stranded and single-stranded DNA molecules under 532 nm and 488 nm excitation, respectively. (A - B) The nonlinear and linear spectra of GC_alter, which refers to a type of double-stranded DNA molecule, with both strands as 20-base 5'-GCGCGCGCGCGCGCGCGCGC-3'. The highlighted green spectrum shows the average curve. (C - D) The nonlinear and linear spectra of A10C10, which refers to a type of single-stranded DNA molecule, with 40-base length and repeated 10 adenine and 10 cytosine (5'- AAAAAAAAAACCCCCCCCCCAAAAAAAAAACCCCCCCCCC-3'). The highlighted blue spectrum shows the average curve. Please click here to view a larger version of this figure.
Supplementary Figure 1: Control experiments for intrinsic DNA fluorescence. Please click here to download this File.
Discussion
Here, we present, for the first time, a protocol for capturing the full spectrum of DNA intrinsic fluorescence from both single-stranded and double-stranded DNA molecules, covering the workflow from sample preparation to data acquisition and computational analysis. This protocol enables label-free super-resolution imaging of DNA molecules by exploiting intrinsic fluorescence rather than exogenous probes. In principle, this approach could be extended to fixed cells and potentially to live-cell imaging, as it avoids chemical labeling and antibody-based amplification. Chromatin inside the nucleus involves DNA, RNA, and different kinds of proteins, which is a much more complicated system than the DNA gel. Currently, due to low photon counts from DNA molecules, stochastic emissions from within the nucleus in fixed/live cells are challenging. But for the isolated chromosomes, or nucleus, the DNA intrinsic fluorescence signal had been reported16,24,27. However, in its current form, the protocol is limited to in vitro environments using synthesized DNA samples. By comparison, labeling nuclear DNA or chromatin using immunostaining typically involves lengthy multistep procedures -- including quenching, blocking, and primary and secondary antibody incubations -- that can take on the order of several hours (often ~5 h per target)12,42, introducing both experimental complexity and potential perturbations to native chromatin structure. By eliminating exogenous labels, intrinsic fluorescence-based imaging not only substantially reduces sample preparation time but also avoids structural perturbations and linkage errors associated with bulky fluorescent probes and antibodies, thereby enabling more faithful nanoscale localization of DNA.
Despite its label-free nature and conceptual simplicity, the successful implementation of this protocol requires careful attention to several critical experimental details. For example, during sample preparation, insufficient time for DNA gel formation reduces the number of detectable single-molecule localizations compared to fully formed gels. Usually, it takes about 1.5 h for the gel to form. If the solution is not fully dried, just wait a bit longer. For a 22 x 22 mm coverslip, 5 µL of imaging buffer is sufficient, whereas a greater volume of buffer can cause leakage, which can disrupt the oil-immersion interface of the objective and adversely affect imaging performance. If leakage occurs, it can be carefully removed using a laboratory wipe. While focusing, gradually raise the objective from the lowest z position. After the objective engages the immersion oil, use fine-adjustment mode to identify the focal plane with frequent stochastic single-molecule emission events. If large gel clusters produce aggregated signals with overlapping first-order spectra, select an alternative imaging area.
Despite its advantages, this protocol has several important limitations that should be considered when assessing its applicability and performance. First, accurate spectral extraction relies on sufficient spatial separation between individual single-molecule events; high localization densities, such as those arising from large DNA gel clusters or densely packed macromolecular assemblies, can lead to overlapping first-order spectral traces that complicate or preclude reliable spectrum reconstruction. Second, the method is sensitive to optical alignment and focus stability, as small misalignments of the dual-wedge prism or deviations from the optimal focal plane can introduce systematic errors in wavelength calibration and reduce signal-to-noise ratio. Third, the protocol currently does not implement spectral demixing, limiting its use in samples with high molecular density or multiple spectrally overlapping species. Collectively, these factors define the practical operating regime of the method and should be carefully considered when extending the protocol to more complex or crowded biological systems.
In this protocol, RainbowSTORM is used only for spectral calibration, although the software also provides powerful tools for 2D/3D calibration, sSMLM data analysis, and image reconstruction. Such analysis tools are well-suited for linking spatial localization information with spectral readouts in spectroscopic super-resolution imaging and could be further leveraged in future extensions of this protocol. Finally, this protocol is potentially feasible for other types of biological macromolecules43,44,45, such as RNA, tubulin, etc. The detected spectrum can be further fed into computational models, such as deep learning models46, to perform classification, thus predicting sequence or molecular structure from intrinsic spectra under different illumination as well as photophysical properties. This study also paves the way for label-free, molecular-specific chromatin imaging, which avoids external labeling or denaturization of native structures.
Disclosures
The authors declare that they have no competing interests.
Acknowledgements
This research was supported by grants R02CA225002, U54CA261694, R01CA289294, and U54CA268084 from the National Institutes of Health and grant CBET-2430743 from the National Science Foundation. We thank Prof. Hao F. Zhang's lab at Northwestern University for their dual-wedge prism device as a key part of the spectroscopic SMLM system.
Materials
| Name | Company | Catalog Number | Comments |
|---|---|---|---|
| 488 nm emission filter for imaging | Chroma Technology Corp. | ET525/50M | |
| 532 nm bandpass filter for calibration | Thorlabs | FL532-3 | |
| 532 nm emission filter for imaging | Chroma Technology Corp. | ET620/60M | |
| 580 nm bandpass filter for calibration | Thorlabs | FB580-10 | |
| 633 nm bandpass filter for calibration | Thorlabs | FL632.8-3 | |
| 680 nm bandpass filter for calibration | Thorlabs | FB680-10 | |
| 750 nm bandpass filter for calibration | Thorlabs | FB750-10 | |
| Beta-mercaptoethanol | Sigma | M6250 | |
| BME imaging buffer | NA | NA | 7 μL GLOX, 7 μL Beta-mercaptoethanol and 690 μL glucose buffer |
| Catalase from bovine liver | Sigma | C100 | |
| DABCO (1,4-di-azobicyclo-(2.2.2.)-octane) | Sigma | D27802 | |
| DABCO imaging buffer | NA | NA | 65 mM DABCO+30 mM Sodium sulfite + 30 mM DTT 1 M in DNAse, RNAse free deionized water. The sodium sulfite should be dissolved in PBS 10× to 1 M prior to making the imaging buffer. |
| DNA deplex for spectroscopic SMLM | IDT | NA | 20-base pair double stranded GC_alter, GC_conti, AT_alter and AT_conti. E.g. GC_alter has both strands as 5’ - GCGCGCGCGCGCGCGCGCGC - 3’; GC_conti has one strand as 5’ - GGGGGGGGGGGGGGGGGGGG - 3’ and the other as 5’ - CCCCCCCCCCCCCCCCCCCCCC - 3’ All samples are in HPLC standard. |
| DNA oligonucleotide/double stranded DNA | IDT | NA | |
| DNA oligos for spectroscopic SMLM | IDT | NA | 20-base A, G, C, T; 40-base single stranded AC chain (A1C1, A5C5, A10C10, A20C20); single stranded 5-, 8-, 12-, 16- base Guanine. E.g. A10C10 is 5'- AAAAAAAAAACCCCC CCCCCAAAAAAAA AACCCCCCCCCC - 3' All samples are in HPLC standard. |
| DNase/RNase-Free Distilled Water | Invitrogen | 10977015 | |
| DTT (DL-Dithiothreitol) | Sigma | 43816 | |
| GLOX | NA | NA | 14 mg glucose oxidase, 50 μL catalase (17 mg/ml) + 200 μL buffer A, which is 10 mM Tris (pH 8.0) and 50 mM NaCl. |
| glucose buffer | NA | NA | 50 mM Tris (pH 8.0), 50 mM NaCl and 10% glucose. |
| glucose oxidase | sigma | G7141 | |
| Glucose, powder | Thermo Fisher | 15023021 | |
| PBS (10X) | Thermo Fisher | J62036.K3 | |
| PBS (1X) | Gibco | 10010023 | |
| Sodium chloride | Thermo Fisher | 424290010 | |
| Sodium sulfite | Sigma | S0505 | |
| Tris (1M) pH 8.0 | Invitrogen | AM9856 |
References
- Ellis, R. J., Minton, A. P. Join the crowd. Nature. 425 (6953), 27-28 (2003).
- Hell, S. W., Wichmann, J. Breaking the diffraction resolution limit by stimulated emission: stimulated emission-depletion fluorescence microscopy. Opt Lett. 19 (11), 780(1994).
- Rust, M. J., Bates, M., Zhuang, X. Sub-diffraction-limit imaging by stochastic optical reconstruction microscopy (STORM). Nat Methods. 3 (10), 793-796 (2006).
- Betzig, E., et al. Imaging intracellular fluorescent proteins at nanometer resolution. Science. 313 (5793), 1642-1645 (2006).
- Gustafsson, M. G. L. Nonlinear structured-illumination microscopy: wide-field fluorescence imaging with theoretically unlimited resolution. Proc Natl Acad Sci U S A. 102 (37), 13081-13086 (2005).
- Hell, S. W., Kroug, M. Ground-state-depletion fluorescence microscopy: a concept for breaking the diffraction resolution limit. Appl Phys B. 60 (5), 495-497 (1995).
- Fölling, J., et al. Fluorescence nanoscopy by ground-state depletion and single-molecule return. Nat Methods. 5 (11), 943-945 (2008).
- Ricci, M., Manzo, C., García-Parajo, M. F., Lakadamyali, M., Cosma, M. Chromatin fibers are formed by heterogeneous groups of nucleosomes in vivo. Cell. 160 (6), 1145-1158 (2015).
- Bintu, B., et al. Super-resolution chromatin tracing reveals domains and cooperative interactions in single cells. Science. 362 (6413), eaau1783(2018).
- Matsuda, A., et al. Condensed mitotic chromosome structure at nanometer resolution using PALM and EGFP-histones. PLoS One. 5 (9), e12768(2010).
- Bohn, M., et al. Localization microscopy reveals expression-dependent parameters of chromatin nanostructure. Biophys J. 99 (5), 1358-1367 (2010).
- Acosta, N., et al. Three-color single-molecule localization microscopy in chromatin. Light Sci Appl. 14, 7(2025).
- Almassalha, L. M., et al. Label-free imaging of the native, living cellular nanoarchitecture using partial-wave spectroscopic microscopy. Proc Natl Acad Sci U S A. 113 (42), E6372-E6381 (2016).
- Beerman, T. A., et al. Effects of analogs of the DNA minor groove binder Hoechst 33258 on topoisomerase II and I mediated activities. Biochim Biophys Acta. 1131 (1), 53-61 (1992).
- Cadet, J., Anselmino, C., Douki, T., Voituriez, L. New trends in photobiology. J Photochem Photobiol B. 15 (4), 277-298 (1992).
- Dong, B., et al. Superresolution intrinsic fluorescence imaging of chromatin utilizing native, unmodified nucleic acids for contrast. Proc Natl Acad Sci U S A. 113 (35), 9716-9721 (2016).
- Vayá, I., Gustavsson, T., Miannay, F., Douki, T., Markovitsi, D. Fluorescence of natural DNA: from the femtosecond to the nanosecond time scales. J Am Chem Soc. 132 (34), 11834-11835 (2010).
- Anders, A. DNA fluorescence at room temperature excited by means of a dye laser. Chem Phys Lett. 81 (2), 270-272 (1981).
- Plessow, R., Brockhinke, A., Eimer, W., Kohse-Höinghaus, K. Intrinsic time- and wavelength-resolved fluorescence of oligonucleotides: a systematic investigation using a novel picosecond laser approach. J Phys Chem B. 104 (15), 3695-3704 (2000).
- Takaya, T., et al. UV excitation of single DNA and RNA strands produces high yields of exciplex states between two stacked bases. Proc Natl Acad Sci U S A. 105 (30), 10285-10290 (2008).
- Bancaud, A., et al. A fractal model for nuclear organization: current evidence and biological implications. Nucleic Acids Res. 40 (18), 8783-8792 (2012).
- Daban, J. R. High concentration of DNA in condensed chromatin. Biochem Cell Biol. 81 (3), 91-99 (2003).
- Bohrmann, B., et al. Concentration evaluation of chromatin in unstained resin-embedded sections by means of low-dose ratio-contrast imaging in STEM. Ultramicroscopy. 49 (1-4), 235-251 (1993).
- Dong, B., et al. Stochastic fluorescence switching of nucleic acids under visible light illumination. Opt Express. 25 (7), 7929-7944 (2017).
- Gong, R., et al. DNA spectroscopic intrinsic-contrast photon-localization optical nanoscopy. Proc SPIE. 13326, 133260F(2025).
- Wang, G., et al. Label-free DNA spectroscopic photon-localization nanoscopy. Optica Biophotonic Congress. , (2025).
- Eshein, A., et al. Sub-10-nm imaging of nucleic acids using spectroscopic intrinsic-contrast photon-localization optical nanoscopy (SICLON). Opt Lett. 43 (23), 5817-5820 (2018).
- Song, K. H., et al. Monolithic dual-wedge prism-based spectroscopic single-molecule localization microscopy. Nanophotonics. 11 (8), 1527-1535 (2022).
- Song, K. H., Sun, C., Zhang, H. F. Design strategy for a dual-wedge prism imaging spectrometer in spectroscopic nanoscopy. Rev Sci Instrum. 94 (2), 023702(2023).
- Yeo, W. H., Sun, C., Zhang, H. F. Physically informed Monte Carlo simulation of dual-wedge prism-based spectroscopic single-molecule localization microscopy. J Biomed Opt. 29 (S1), S11501(2023).
- Davis, J. L., et al. RainbowSTORM: an open-source ImageJ plug-in for spectroscopic single-molecule localization microscopy (sSMLM) data analysis and image reconstruction. Bioinformatics. 36 (19), 4972-4974 (2020).
- Davis, J. L., et al. RainbowSTORM v2 (MATLAB app). , https://github.com/FOIL-NU/sSMLM-protocol (2020).
- Brenner, B., et al. Implementation and calibration of spectroscopic single-molecule localization microscopy. BMC Methods. 2 (1), 2(2025).
- sSMLM for DNA intrinsic fluorescence (Python scripts). , Backman Lab. https://github.com/BackmanLab/sSMLM-for-DNA-intrinsic-fluorescence (2025).
- N-STORM protocol. , Molecular Vista. Available from: https://www.mvi-inc.com/wp-content/uploads/N-STORM+Protocol.pdf (2014).
- Abdelsayed, V., Boukhatem, H., Olivier, N. An optimized buffer for repeatable multicolor STORM. ACS Photonics. 9 (12), 3926-3934 (2022).
- Zumbusch, A., Holtom, G. R., Xie, X. S. Three-dimensional vibrational imaging by coherent anti-Stokes Raman scattering. Phys Rev Lett. 82 (20), 4142(1999).
- Benninger, R. K. P., Piston, D. W. Two‐photon excitation microscopy for the study of living cells and tissues. Curr Protoc Cell Biol. 59 (1), 4-11 (2013).
- Zhang, C., Zhang, D., Cheng, J. X. Coherent Raman scattering microscopy in biology and medicine. Ann Rev Biomed Eng. 17 (1), 415-445 (2015).
- Song, J., et al. SNR enhanced high-speed two-photon microscopy using a pulse picker and time gating detection. Sci Rep. 13 (1), 14244(2023).
- Luu, P., Fraser, S. E., Schneider, F. More than double the fun with two-photon excitation microscopy. Comm Biol. 7 (1), 364(2024).
- Van de Linde, S., et al. Direct stochastic optical reconstruction microscopy with standard fluorescent probes. Nat Protoc. 6 (7), 991-1009 (2011).
- Wang, D., et al. Research progress on the luminescence of biomacromolecules. J Mater Sci Technol. 76, 60-75 (2021).
- Varejão, N., Reverter, D. Using intrinsic fluorescence to measure protein stability upon thermal and chemical denaturation. Methods Mol Biol. 2581, 229-241 (2023).
- Sindrewicz, P., et al. Intrinsic tryptophan fluorescence spectroscopy reliably determines galectin-ligand interactions. Sci Rep. 9 (1), 11851(2019).
- Ho, C. S., et al. Rapid identification of pathogenic bacteria using Raman spectroscopy and deep learning. Nat Commun. 10 (1), 4927(2019).
Reprints and Permissions
