This protocol provides a reproducible framework for mapping frequency-dependent cortical responses to transcutaneous auricular vagus nerve stimulation using functional near-infrared spectroscopy in individuals with major depressive disorder.
Method Article
Functional Near-Infrared Spectroscopy-Guided Frequency Mapping of Auricular Vagus Nerve Stimulation in Depression
In This Article
Summary
Abstract
Major depressive disorder (MDD) is associated with alterations in large-scale brain networks, and variability in transcutaneous auricular vagus nerve stimulation (taVNS) parameters, particularly stimulation frequency, limits reproducibility and comparability across studies. Standardized strategies for systematic parameter selection are therefore needed. This protocol presents a reproducible, neuroimaging-guided workflow for mapping individual cortical responses to multiple taVNS frequencies using functional near-infrared spectroscopy (fNIRS). The approach combines continuous fNIRS acquisition with within-session delivery of multiple stimulation frequencies and network-level analysis of default mode network activity. Frequency-specific responses are quantified using distance-based metrics, followed by algorithmic ranking to identify candidate stimulation parameters within each participant.
The workflow enables direct within-subject comparison of stimulation conditions and provides a structured framework for exploratory parameter mapping based on network-level responses rather than fixed-frequency designs. Representative results demonstrate the feasibility of acquiring stable fNIRS signals across conditions and generating interpretable participant-specific frequency rankings. Although demonstrated in MDD, this protocol is adaptable to other neuromodulation paradigms and disorders involving network-level dysfunction and may support future studies aimed at individualized parameter selection.
Introduction
Transcutaneous auricular vagus nerve stimulation (taVNS) is a noninvasive neuromodulation technique that targets the auricular branch of the vagus nerve and can influence brainstem neuromodulatory nuclei as well as distributed cortical networks1. Prior work has shown that the physiological and neural effects of taVNS depend strongly on stimulation parameters2,3,4,5, particularly stimulation frequency. Across animal and human models, different frequencies have been associated with distinct neuromodulatory pathways and brain responses, and clinical taVNS protocols currently span a wide frequency range6. This variability highlights the need for systematic approaches to frequency mapping and principled parameter selection rather than reliance on fixed-frequency conventions. The goal of this protocol is to provide a reproducible method for within-subject mapping of neural responses to multiple taVNS frequencies using network-level physiological readouts.
The overall goal of this protocol is to provide a reproducible method for mapping individual neural responses to multiple taVNS frequencies.
Functional near-infrared spectroscopy (fNIRS) is a portable optical neuroimaging technique that measures cortical hemodynamics with high temporal resolution and is compatible with concurrent taVNS7,8. Compared with magnetic resonance imaging (MRI)-based approaches, fNIRS offers greater portability, lower logistical burden, and easier integration with stimulation procedures, without constraints such as scanner immobility, acoustic noise, or restricted hardware setups. Compared with symptom-based optimization strategies, fNIRS provides a direct physiological proxy of cortical network responses to stimulation rather than relying solely on subjective or delayed clinical outcomes9. Compared with fixed-frequency stimulation paradigms10, the present protocol enables explicit characterization of interindividual variability in frequency sensitivity instead of averaging responses across participants. In addition, fNIRS supports scalable repeated within-session measurements, making this approach particularly suitable for exploratory frequency-mapping studies and pilot investigations requiring efficient, repeated assessments.
This combined approach should be used when investigators aim to compare neuromodulation parameters within the same participant, identify candidate individualized stimulation settings, or develop protocols before conducting longitudinal or outcome-driven trials. It is broadly applicable to conditions characterized by altered large-scale brain network organization11. This protocol is particularly suitable for exploratory parameter mapping, pilot personalization studies, and early-stage feasibility investigations. Here, depression provides one illustrative context, as it has been associated with altered activity and connectivity within the default mode network (DMN)12,13 and related control networks, and taVNS has been reported to modulate these systems14. However, prior studies have used heterogeneous stimulation frequencies, and the most appropriate frequencies for targeting affective and cognitive networks remain uncertain. This variability motivates the use of within-subject frequency comparison rather than reliance on a single a priori frequency.
Here, we describe a protocol for implementing an fNIRS-guided taVNS frequency-mapping workflow suitable for bedside and longitudinal use. The procedure includes an initial resting-state baseline without stimulation, followed by resting-state taVNS runs at 2, 10, 25, and 40 Hz, as well as a sham condition to control for nonspecific effects. For each condition, fNIRS data are acquired and analyzed using multivariate network distance metrics relative to a normative healthy reference. These metrics capture complementary aspects of network organization, including connectivity strength and regional interaction patterns15,16. The resulting network-level measures are used to compare frequency-specific effects within each participant and to identify candidate stimulation parameters in a network-informed manner. A subsequent resting-state candidate-specific condition is included to assess the short-term reproducibility of the candidate frequency.
This protocol is best suited for exploratory parameter mapping, proof-of-concept personalization, and protocol development prior to larger longitudinal or clinical trials. It provides a structured framework for systematically comparing stimulation frequencies within individuals using network-level physiological metrics. The method is designed to support hypothesis generation and candidate frequency identification in early-stage or pilot investigations. It is not intended to establish definitive clinical efficacy, therapeutic superiority, or treatment optimization, but rather to inform subsequent longitudinal and outcome-driven studies through exploratory, network-informed parameter selection.
Protocol
All procedures involving human participants were performed in accordance with institutional guidelines and the Declaration of Helsinki and were approved by the responsible human research ethics committee of Philipps University Marburg (protocol number: 23-232 BO). Written informed consent was obtained from all participants prior to participation.
The protocol follows the chronological execution of the experimental workflow (see Figure 1 for details). All steps are implemented using predefined parameters to ensure reproducibility and comparability across participants. These parameters included fixed taVNS stimulation settings (frequencies of 2, 10, 25, and 40 Hz, pulse width, and individually adjusted stimulation intensity), standardized resting-state run durations, a consistent sham condition, and a uniform fNIRS acquisition and preprocessing pipeline, including channel configuration, motion correction, filtering, and network-based analysis procedures.
1. Ethical Approval and Study Overview
- Obtain ethical approval
- Obtain approval from the Ethics Committee of Philipps University Marburg Faculty of Medicine (Protocol No. 23-232 BO) before beginning the study.
- Conduct all procedures in accordance with the Declaration of Helsinki and institutional guidelines for human participant research.
- Obtain written informed consent from each participant before screening, assessments, or data acquisition.
- Define study objectives
- Use this protocol to compare sham stimulation and multiple active taVNS frequencies within the same participant.
- Use concurrent functional near-infrared spectroscopy (fNIRS) to quantify cortical network responses during stimulation.
- Use predefined analysis scripts to identify the candidate individualized stimulation frequency based on network-level similarity to a healthy control template.
- Define analytical scope
- Interpret all outcomes as descriptive and exploratory.
- Do not use this protocol to establish clinical efficacy, therapeutic superiority, or treatment optimization.
- Use results to inform future longitudinal or outcome-driven studies.
2. Recruit and Screen Participants
- Recruit study groups
- Recruit adult participants into two groups: Major Depressive Disorder (MDD) and healthy controls (HC).
- Recruit healthy controls during the same study period and using identical procedures as the MDD group.
- Provide compensation according to institutional guidelines.
- Apply inclusion criteria
- Include only participants aged 18 years or older.
- Confirm normal or corrected-to-normal vision.
- MDD group only: Confirm MDD diagnosis using a DSM-5-based structured clinical interview.
- MDD group only: Include only participants with mild to moderate depression severity (HAMD-24 ≥8 and <24; BDI-II ≥8 and <29).
- Healthy control group only: Confirm absence of current psychiatric or severe somatic disease.
- Apply exclusion criteria
- Exclude participants with neurological disorders or history of significant head trauma.
- Exclude participants with psychiatric comorbidity.
- Exclude participants currently taking psychotropic or antidepressant medication or who discontinued such medication within the previous 2 weeks.
- Exclude participants with suicidal ideation or severe depressive symptoms.
- Exclude participants with medical conditions likely to affect neural or vascular function.
- Perform clinical assessment
- Administer the Hamilton Depression Rating Scale (HAMD-24).
- Administer the Beck Depression Inventory-II (BDI-II).
- Record total scores in the study database.
3. Prepare Experimental Environment
- Prepare laboratory room
- Seat the participant in a quiet, dimly lit room.
- Maintain stable ambient temperature and minimize external noise.
- Position a monitor approximately 1 m in front of the participant.
- Instruct participant
- Display a central fixation cross on the monitor.
- Instruct the participant to remain awake, relaxed, and still.
- Instruct the participant to maintain gaze on the fixation cross throughout all recordings.
4. Prepare taVNS and Calibrate Stimulation
- Prepare hardware
- Use a transcutaneous auricular vagus nerve stimulation device equipped with a titanium-iridium stimulation electrode.
- Inspect cables, connectors, and battery status before each session.
- Position electrode
- Clean the left cymba conchae using alcohol wipes.
- Dry the skin completely.
- Place the stimulation electrode on the left cymba conchae.
- Verify stable contact and secure placement.
- Calibrate current amplitude
- Set pulse width to 300 µs.
- Enable continuous stimulation without duty cycling.
- Begin at 0 mA and increase current gradually in 0.1-0.2 mA steps.
- Ask the participant to rate sensation on a 10-point scale after each increase.
- Stop increasing current at the highest tolerable intensity without pain.
- Target a perceived intensity of 7-8/10.
- Repeat calibration separately for 2, 10, 25, and 40 Hz.
- Record final current amplitude for each frequency.
- Configure sham stimulation
- Configure the device to deliver no electrical current.
- Keep electrode placement identical to active conditions.
- Match all visual, tactile, and auditory cues to active stimulation.
- Apply active stimulation blocks
- Deliver four active frequencies (2, 10, 25, and 40 Hz) once each during the session.
- Randomize block order across participants using a computer-generated sequence.
- Insert fixed inter-condition intervals without stimulation.
5. Set Up fNIRS System
- Prepare hardware
- Use two synchronized fNIRS systems.
- Equip each system with 16 light sources and 16 detectors.
- Define montage
- Use an optical layout planning tool to target default mode network regions.
- Position optodes to cover medial prefrontal cortex, posterior cingulate cortex/precuneus, bilateral angular gyri, and medial temporal regions.
- Use 3 cm source-detector spacing for long-separation channels.
- Add short-separation channels at approximately 8 mm.
- Configure acquisition parameters
- Use wavelengths of 760 nm and 850 nm.
- Set sampling frequency to 5.1 Hz.
- Synchronize both systems before recording.
6. Conduct Experimental Session
- Define block sequence
- Record baseline resting state (RS0) for 6 min without stimulation.
- Insert a 2 min interval.
- Apply sham stimulation for 6 min.
- Insert a 2 min interval.
- Apply four randomized active stimulation blocks (2, 10, 25, and 40 Hz), each for 6 min.
- Insert a 2 min interval between consecutive active blocks.
- Record post-stimulation resting state (RS1) for 6 min.
- Maintain session timing
- Ensure that the total session duration is approximately 54 min.
- Acquire fNIRS continuously throughout all blocks.
- Maintain standardized conditions
- Ensure that room lighting, instructions, and fixation display remain identical across all blocks.
- Monitor electrode contact continuously.
- Pause the experiment only after completing a block, if necessary.
7. Preprocess fNIRS Data
- Segment recordings
- Segment continuous recordings into RS0, Sham, 2 Hz, 10 Hz, 25 Hz, 40 Hz, and RS1.
- Extract raw intensity signals for each channel and condition.
- Perform quality control
- Apply Butterworth band-pass filtering between 0.5 and 2.33 Hz.
- Divide signals into non-overlapping 3 s windows.
- Compute Scalp Coupling Index (SCI) and Power Spectral Peak (PSP).
- Classify windows as acceptable when SCI ≥ 0.8 and PSP ≥ 0.1.
- Retain channels with ≥ 70% acceptable windows.
- Retain participants with ≥ 70% acceptable channels.
- Correct artifacts
- Correct motion artifacts using Temporal Derivative Distribution Repair (TDDR).
- Apply wavelet filtering using an 8-wavelet basis.
- Define outliers as coefficients exceeding 4 standard deviations.
- Convert signals
- Convert optical density to oxyhemoglobin using the modified Beer-Lambert law.
8. Compute Network Features and Select Candidate Frequency
- Compute connectivity
- Compute robust Pearson correlations between all ROI pairs.
- Store six unique pairwise correlations as a connectivity vector.
- Assemble a 4 × 4 symmetric connectivity matrix.
- Compute derived features
- Compute eigenvalues and eigenvectors of each matrix.
- Compute average controllability for each node after matrix normalization.
- Construct healthy template
- Compute the average RS0 connectivity matrix across all retained healthy control participants.
- Use the resulting matrix as the healthy reference template.
- Compute distances
- Compute cosine distance between participant features and template for connectivity, eigenvalues, and controllability.
- Compute eigenvector similarity using component matching.
- Rank conditions
- Rank Sham, 2 Hz, 10 Hz, 25 Hz, and 40 Hz in ascending order of distance for each metric.
- Assign rank 1 to the smallest distance.
- Sum ranks across metrics for each condition.
- Select candidate individualized frequency
- Identify the condition with the lowest cumulative rank score.
- Define this condition as the candidate individualized stimulation frequency.
- Stimulation Gain Computation
- Compute the stimulation gain (G_f) for each frequency using the following normalization:
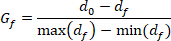
Where df is the RS0 distance and df is the distance during stimulation frequency f., computed across RS0, Sham, 2 Hz, 10 hz, 25 Hz, and 40 Hz conditions.
- Compute the stimulation gain (G_f) for each frequency using the following normalization:
Results
Data quality and feasibility of acquisition
Application of the predefined data quality criteria resulted in the exclusion of channels and participants with insufficient signal quality. Successful outcomes are characterized by high channel retention across conditions, stable hemodynamic recordings, and interpretable connectivity patterns that allow reliable estimation of network features. Poor or suboptimal outcomes include low signal quality, excessive motion artifacts, inadequate optode-scalp coupling, insufficient channel retention, or inconsistent network estimates that limit interpretability. As illustrated in Figure 3 and Figure 4, the final dataset after quality assessment included 19 participants with major depressive disorder (MDD; mean age: 31.21 years, SD: 8.99; 10 females) and 19 healthy controls (HC; mean age: 33.5 years, SD: 13.51; 7 females). Seven participants (3 MDD and 4 HC) were excluded because of insufficient data quality, primarily related to motion artifacts or inadequate optode-scalp coupling.
Channel-wise quality maps further demonstrated heterogeneous spatial distributions of signal quality across participants, with localized regions of reduced quality in some individuals. These findings highlight the importance of applying predefined thresholds based on the scalp coupling index and power spectral peak before further analysis. These quality-control procedures ensure that subsequent network measures are computed from reliable data and represent a critical component of the protocol. The representative outputs shown here depend directly on successful completion of data quality screening, standardized preprocessing, ROI-based time-series extraction, and application of the predefined rank-sum selection procedure.
Pre-processing and network construction
The experimental design and preprocessing workflow are shown in Figure 1 and Figure 2. Following the quality-control step (Figure 2), signals were successfully converted to hemoglobin concentration and corrected for motion artifacts and systemic physiological noise. Successful completion of these preprocessing steps is indicated by retained high-quality channels, stable regional time series, and interpretable connectivity estimates, whereas poor outcomes include excessive signal loss, unresolved artifacts, or unreliable network measures. Extraction of regional time series from default mode network nodes enabled construction of functional connectivity matrices for each condition. These representative results depend directly on successful execution of data quality control17, standardized preprocessing18, ROI definition, and application of the predefined ranking procedure. The resulting default mode network functional connectivity matrices form the basis for subsequent distance-based comparisons.
Representative network-level outcomes
Figure 5A shows an example of condition-specific DMN functional connectivity profile for a representative MDD participant, alongside the reference DMN network template derived from healthy controls. These matrices allow direct visualization of region-to-region connectivity patterns across conditions and help distinguish successful protocol output from less interpretable or poor-quality network estimates. Visual inspection reveals condition-dependent variations in network organization relative to the template, illustrating how stimulation frequency can modulate DMN network structure within a single session.
Distance measures (Figure 5B) quantify these differences across multiple metrics (connectivity, eigenvalues, eigenvectors, and average controllability). For each metric, conditions can be ranked based on their proximity to the reference template, with lower distance values indicating closer similarity. Notably, the ranking of different distance metrics varies across conditions, reflecting the complementary information captured by each metric about the network representations.
Consensus-based frequency selection
To integrate information across four metrics, ranks were aggregated within each participant (Figure 5C). Clear separation of cumulative rank scores across conditions indicates successful differentiation of frequency-specific network responses, whereas highly similar rank scores across conditions suggest limited sensitivity of the protocol or weak separation between stimulation effects. The condition with the lowest cumulative rank score was interpreted as the candidate representative stimulation frequency for that participant. Table 1 summarizes these selections across participants, together with the corresponding stimulation gain values and agreement between metrics quantified by Kendall’s W.
Across the MDD group, 12 of 19 participants showed the lowest cumulative rank for an active stimulation frequency rather than the sham condition. The selected stimulation frequency varied across participants, as summarized in Table 1. Agreement between metrics, quantified using Kendall’s W, also differed across individuals, reflecting variability in ranking consistency. Higher Kendall’s W values indicate stronger concordance among metrics and greater confidence that multiple network measures support the same condition ranking, whereas lower values indicate weaker agreement and greater heterogeneity across metrics. Thus, the final selection should be interpreted as a data-driven integration of complementary network features rather than a decision based on any single metric alone.
These representative and feasibility-based results illustrate the types of network-level outputs generated by the protocol and demonstrate that the workflow can be implemented for within-subject comparison across stimulation conditions. The findings are intended to be illustrative of signal acquisition, preprocessing, feature extraction, and rank-based parameter mapping rather than evidence of therapeutic benefit, clinical efficacy, or performance validation, as shown in Figures 1–5 and Table 1.
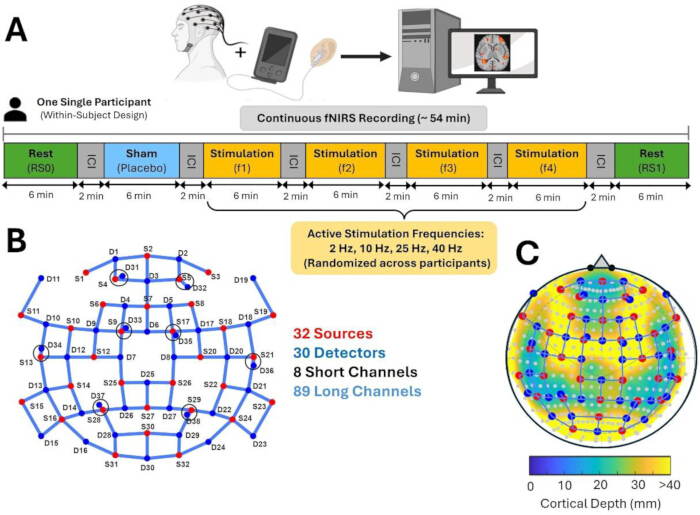
Figure 1. Experimental design and fNIRS probe configuration. (A) Within-subject experimental design. Each participant completed all conditions within a single session, including baseline resting state (RS0), sham stimulation, four active stimulation frequencies (2, 10, 25, and 40 Hz), and post-stimulation resting state (RS1). Active stimulation order was randomized across participants. Each block lasted 6 min and was separated by ~2 min intervals without stimulation. Functional near-infrared spectroscopy (fNIRS) data were recorded continuously (~54 min total) and segmented by condition for analysis. (B) fNIRS probe layout showing 32 sources (red) and 30 detectors (blue), forming 89 long-separation channels and 8 short-separation channels (circled). Short-separation channels were used to remove superficial physiological noise. (C) Cortical sensitivity profile of the probe layout relative to the default mode network (DMN), based on the Automated Anatomical Labeling (AAL) atlas, illustrating depth-dependent measurement sensitivity. Please click here to view a larger version of this figure.
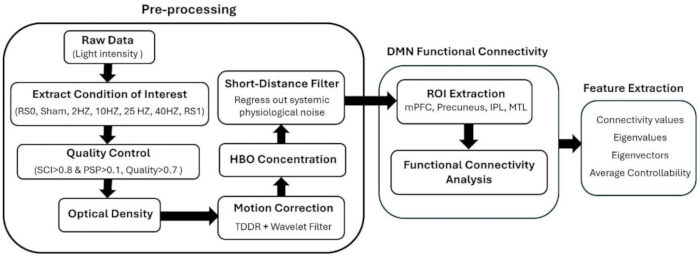
Figure 2. Preprocessing and feature extraction pipeline for fNIRS-based network analysis.
Raw light-intensity data were segmented into condition-specific blocks (RS0, sham, stimulation frequencies, and RS1). Data quality was assessed using the scalp coupling index (SCI > 0.8) and power spectral peak (PSP > 0.1), and only high-quality channels were retained. Signals were converted to optical density, followed by motion correction using temporal derivative distribution repair (TDDR) and wavelet filtering. Hemoglobin concentration changes were computed, and short-separation regression was applied to reduce systemic physiological noise. For network analysis, time series were extracted from regions of interest (ROIs) within the default mode network (DMN), including medial prefrontal cortex (mPFC), precuneus (Prec), inferior parietal lobule (IPL), and medial temporal lobe (MTL). Functional connectivity was calculated between ROIs. Derived features included connectivity values, eigenvalues, eigenvectors, and average controllability. Please click here to view a larger version of this figure.
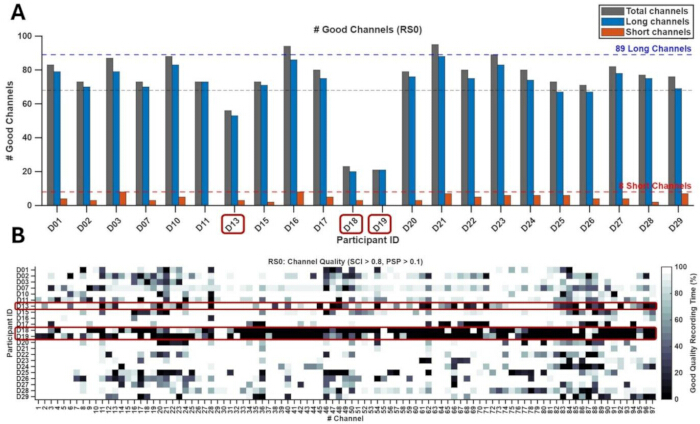
Figure 3. Data quality assessment in participants with major depressive disorder (MDD).
(A) Number of channels meeting quality criteria during the baseline condition (RS0) for each participant with MDD. Bars indicate all channels (gray), long-separation channels (blue), and short-separation channels (orange) meeting quality criteria (≥70% of recording time with SCI > 0.8 and PSP > 0.1). Dashed lines indicate the maximum number of available long-separation channels (89), short-separation channels (8), and the threshold for acceptable participant-level data quality (≥70% of total channels retained). Participants below threshold are highlighted (D13, D18, D19). (B) Channel-wise data quality across participants. The heatmap shows the percentage of recording time meeting quality criteria for each channel and participant during RS0. Darker shading indicates lower data quality. Please click here to view a larger version of this figure.
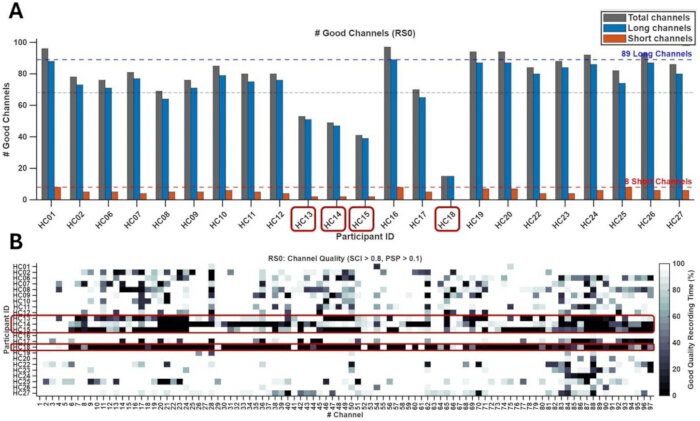
Figure 4. Data quality assessment in healthy control participants. (A) Number of channels meeting quality criteria during the baseline condition (RS0) for each healthy control participant. Bars indicate all channels (gray), long-separation channels (blue), and short-separation channels (orange) meeting quality criteria (≥70% of recording time with SCI > 0.8 and PSP > 0.1). Dashed lines indicate the maximum number of available channels and the threshold for acceptable participant-level data quality (≥ 70% of total channels retained). Participants below threshold are highlighted (HC13, HC14, HC15, HC18). (B) Channel-wise data quality across participants. The heatmap shows the percentage of recording time meeting quality criteria for each channel and participant during RS0. Darker shading indicates lower data quality. Please click here to view a larger version of this figure.
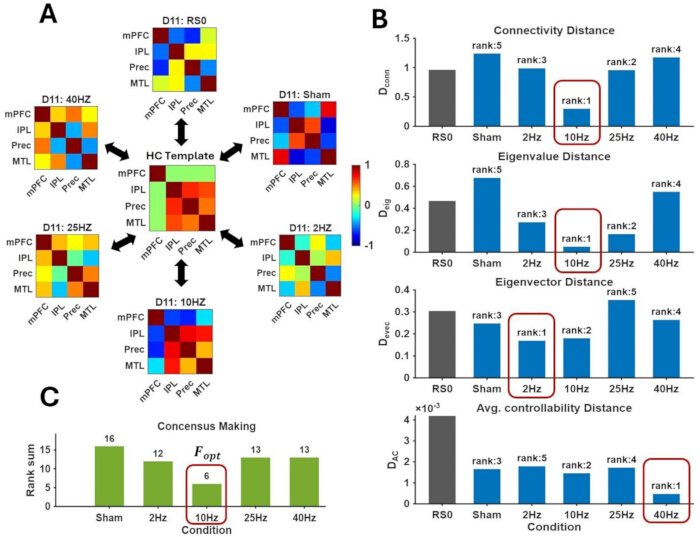
Figure 5. Representative distance-based selection of stimulation frequency in a single participant.
(A) Functional connectivity matrices showing pairwise interactions among four default mode network regions for one representative participant with MDD (D11) across conditions (RS0, sham, and stimulation frequencies). Regions include medial prefrontal cortex (mPFC), inferior parietal lobule (IPL), precuneus (Prec), and medial temporal lobe (MTL). The central matrix represents the healthy control template derived from group-level RS0 data. (B) Distance measures between each condition and the healthy control template across four metrics: connectivity distance (D_conn), eigenvalue distance (D_eig), eigenvector distance (D_evec), and average controllability distance (D_AC). Bars represent distance values; lower values indicate greater similarity to the template. Rankings are shown for each condition (rank 1 = smallest distance). (C) Consensus ranking across metrics obtained by summing ranks for each condition. The condition with the lowest total rank was selected as the candidate stimulation frequency for this participant. Please click here to view a larger version of this figure.
| Participant ID | Connectivity | Eigenvalue | Eigenvector | Ave. Controllability | Concensus | Kandall-W |
| D01 | 40HZ (G=1.00) | 40HZ (G=1.00) | 40HZ (G=1.00) | 40HZ (G=0.29) | 40HZ | 0.85 |
| D02 | Sham (G=0.18) | Sham (G=0.00) | Sham (G=0.11) | Sham (G=-0.09) | Sham | 0.89 |
| D03 | 10HZ (G=0.20) | Sham (G=0.05) | 2HZ (G=0.56) | Sham (G=0.63) | 40HZ | 0.34 |
| D07 | Sham (G=0.29) | 25HZ (G=0.06) | 2HZ (G=0.33) | 25HZ (G=0.45) | 25HZ | 0.36 |
| D10 | Sham (G=1.00) | Sham (G=1.00) | Sham (G=1.00) | Sham (G=1.00) | Sham | 0.59 |
| D11 | 10HZ (G=0.71) | 10HZ (G=0.66) | 2HZ (G=0.73) | 40HZ (G=1.00) | 10HZ | 0.34 |
| D15 | 40HZ (G=0.58) | 40HZ (G=0.53) | 40HZ (G=0.21) | 40HZ (G=-0.27) | 40HZ | 0.96 |
| D16 | 25HZ (G=1.00) | 10HZ (G=1.00) | 25HZ (G=0.90) | 25HZ (G=0.40) | 25HZ | 0.64 |
| D17 | 2HZ (G=0.51) | 2HZ (G=0.75) | 25HZ (G=0.73) | 10HZ (G=0.82) | 10HZ | 0.21 |
| D20 | 25HZ (G=-0.08) | 25HZ (G=0.04) | 25HZ (G=-0.27) | Sham (G=0.31) | 25HZ | 0.84 |
| D21 | Sham (G=0.37) | 2HZ (G=0.08) | Sham (G=0.27) | 40HZ (G=-0.28) | Sham | 0.41 |
| D22 | 2HZ (G=-0.06) | 10HZ (G=0.19) | 2HZ (G=0.75) | 2HZ (G=1.00) | 2HZ | 0.47 |
| D23 | Sham (G=0.53) | 25HZ (G=-0.14) | Sham (G=0.71) | 40HZ (G=0.23) | Sham | 0.31 |
| D24 | 25HZ (G=0.59) | 25HZ (G=0.18) | 25HZ (G=0.18) | Sham (G=0.34) | 25HZ | 0.5 |
| D25 | 25HZ (G=1.00) | Sham (G=-0.01) | 10HZ (G=1.00) | Sham (G=0.19) | 25HZ | 0.16 |
| D26 | 10HZ (G=0.52) | Sham (G=0.01) | 10HZ (G=1.00) | 10HZ (G=0.71) | 10HZ | 0.93 |
| D27 | 10HZ (G=-0.11) | 10HZ (G=0.20) | 2HZ (G=-0.20) | 40HZ (G=1.00) | 2HZ | 0.05 |
| D28 | 10HZ (G=0.51) | 10HZ (G=0.04) | 10HZ (G=1.00) | 10HZ (G=-0.02) | 10HZ | 0.81 |
| D29 | 10HZ (G=0.81) | 10HZ (G=0.54) | Sham (G=1.00) | 10HZ (G=1.00) | 10HZ | 0.85 |
| Gain | 0.50, 0.52 | 0.32, 0.18 | 0.58, 0.73 | 0.46, 0.40 | 0.55, 0.50 | |
| (Mean, Median) |
Table 1: Participant-specific frequency selection across distance metrics.
For each participant, the stimulation condition associated with the minimum distance to the healthy control template is reported for four network-based metrics: connectivity distance (D_conn), eigenvalue distance (D_eig), eigenvector distance (D_evec), and average controllability distance (D_AC). Values in parentheses (G) indicate stimulation gain. The Consensus column shows the candidate stimulation frequency based on rank aggregation across the four metrics. Kendall’s W quantifies agreement among metrics within each participant. The final row summarizes mean and median stimulation gain values across participants for each metric, together with corresponding Kendall’s W values.
Discussion
Methodological rationale and critical steps
This protocol provides a standardized workflow for within-session mapping of frequency-dependent effects of transcutaneous auricular vagus nerve stimulation (taVNS) using resting-state functional near-infrared spectroscopy (fNIRS). The aim is structured comparison of candidate stimulation parameters under controlled conditions, rather than validated individualized optimization.
Several steps are critical for reliable implementation. Failure to properly implement these steps may result in reduced signal quality, unreliable connectivity estimates, unstable rankings, or loss of analyzable datasets. Stimulation intensity must be calibrated separately for each frequency to a fixed perceived level (7–8/10), as perceptual thresholds vary across frequencies and may otherwise confound comparisons19. Improper calibration may lead to differences in perceived stimulation intensity rather than true frequency-specific neural effects, thereby reducing comparability across conditions. fNIRS data quality must be ensured through stable optode-scalp coupling, motion correction, short-separation regression, and predefined channel-retention criteria. Consistent region-of-interest (ROI) definition across participants and conditions is required to ensure comparability of network features. Finally, frequency selection should be based on a predefined rank-based approach integrating multiple complementary metrics, rather than relying on a single measure. These methodological steps directly determine the quality, stability, and interpretability of the resulting network measures and therefore influence the representative outputs shown in the Results section.
Sequential within-session design and carryover effects
The protocol applies multiple stimulation frequencies sequentially within a single session without extended physiological washout. Although fixed inter-condition intervals are used, carryover or interaction effects cannot be excluded. This may influence the independence of condition-specific responses and should be considered when interpreting differences between stimulation frequencies. Accordingly, frequency differences should be interpreted as relative within-session effects. The identified “optimal frequency” reflects the best-performing condition in that session and should be interpreted as a relative, data-driven ranking outcome within the session rather than a definitive or generalizable stimulation parameter without replication20.
Comparison with alternative approaches
Fixed-frequency protocols enable standardization but do not account for interindividual variability, while symptom-based tuning lacks direct physiological insight21. Functional magnetic resonance imaging (fMRI)-guided approaches provide broader spatial coverage but are less feasible for repeated or bedside use. Compared with these approaches, the present protocol offers advantages in portability, feasibility for repeated measurements, and direct network-level assessment, while being limited by reduced spatial depth and sensitivity to motion artifacts22. It should therefore be considered a pragmatic framework for exploratory parameter mapping rather than a clinically validated optimization strategy.
Limitations
The protocol is based on a single-session design and does not assess persistence of network effects or clinical outcomes. Sequential stimulation may introduce residual effects between conditions23. These factors may affect the stability and generalizability of identified frequency-specific responses. In addition, anatomical variability, electrode placement, and skin impedance can affect stimulation efficiency, while strict fNIRS quality-control criteria may reduce the number of analyzable datasets. Furthermore, fNIRS measurements are limited to cortical regions and do not capture subcortical activity, which may contribute to network-level effects.
Scope and applicability
This protocol is particularly suitable for researchers conducting pilot studies, feasibility testing, or early-stage protocol development in neuromodulation research. It supports network-informed selection of candidate stimulation parameters but does not establish therapeutic efficacy or precision psychiatry. The framework can be adapted to other networks, disorders, or stimulation parameters by modifying optode placement and ROI definitions, provided that consistent preprocessing, rigorous quality control, and transparent comparison procedures are maintained24.
Disclosures
All participants provided written informed consent prior to their involvement in the experiments. The study protocols were reviewed and approved by the respective ethics committee of the University of Marburg.
Custom software scripts, anonymized data and other materials used in this study can be made available for interested parties upon request.
Author contribution statement
Svenja J. Francke contributed to participant recruitment, data acquisition, project administration, methodology, and writing of the original draft and revised manuscript. Sarah Alizadeh contributed to conceptualization, methodology, data analysis, visualization, and writing of the original draft and revised manuscript. José C. García Alanis contributed to conceptualization, methodology, project administration, data analysis, and manuscript review and editing. Dorian Kock contributed to participant recruitment, data acquisition, methodology, and writing of the original draft and revised manuscript. Jannick Herrmann contributed to participant recruitment, data acquisition, methodology, and writing of the original draft and revised manuscript. Maximilian Kastl contributed to participant recruitment, data acquisition, methodology, and writing of the original draft and revised manuscript. Hamidreza Jamalabadi contributed to conceptualization, methodology, data analysis, supervision, and manuscript review and editing. Felix P. Bernhard contributed to conceptualization, methodology, supervision, and writing of the original draft and revised manuscript.
Acknowledgements
This work was funded in part by the consortia grants from the German Research Foundation (DFG) SFB/TRR 393 (project grant no 521379614), by a research grant from von Behring Röntgen (No.\ 70\_00038) Stiftung, by a research grant from the University Hospital of Gießen and Marburg (UKGM, No. 1/2024 MR) and by the Edda und Helmut Laich Stiftung. This work was further supported by the DYNAMIC center, which was funded by the LOEWE program of the Hessian Ministry of Science and Arts (Grant Number: LOEWE 1/16/519/03/09.001(0009)/98) and the Deutsche Forschungsgemeinschaft (German Research Foundation, DFG) under Germany’s
Excellence Strategy (EXC 3066/1 “The Adaptive Mind”, Project No. 533717223).
Materials
| Name | Company | Catalog Number | Comments |
|---|---|---|---|
| fNIRS system (wearable continuous-wave multichannel) | NIRx | NIRSport2 | Portable dual-wavelength multichannel fNIRS system for cortical hemodynamic recordings |
| fNIRS acquisition software | NIRx | Aurora | Native software used for signal acquisition, monitoring, and event marking |
| fNIRS cap with optodes | NIRx | Compatible with NIRSport2 | Used for source and detector placement |
| Optodes (sources and detectors) | NIRx | Compatible with NIRSport2 | Long-separation channels (~30 mm) and short-separation channels (~8 mm) |
| MATLAB | MathWorks | Latest release used in study | Used for preprocessing, connectivity analysis, and custom scripts |
| Signal Processing Toolbox | MathWorks | MATLAB add-on | Used for filtering and time-series processing |
| Statistics and Machine Learning Toolbox | MathWorks | MATLAB add-on | Used for ranking, descriptive statistics, and agreement metrics |
| Custom analysis scripts | In-house | N/A | Used for preprocessing, feature extraction, and rank-based frequency selection |
| taVNS stimulation device | tVNS GmbH | Device model used in study | Used for transcutaneous auricular vagus nerve stimulation |
| Auricular stimulation electrodes | tVNS GmbH | Compatible with stimulator | Used for placement at left cymba conchae |
| Electrode cables and connectors | tVNS GmbH | Compatible with stimulator | Used to connect electrodes to stimulation device |
| Contact cream / conductive gel | tVNS GmbH | N/A | Used to improve electrode-skin contact during stimulation |
| Alcohol wipes | tVNS GmbH | N/A | Used for skin preparation before electrode placement |
| PsychoPy | Open Science Tools Ltd. | Version 2024.4.2 | Used for experimental control, timing, block randomization, stimulus presentation, and synchronization |
| Computer workstation | Lenovo | ThinkPad T14, G31666 | Used for acquisition control and offline analysis; Intel Core Ultra 5, 16 GB RAM, 500 GB SSD, Windows 11 Pro |
| Monitor / display | Lenovo | ThinkVision T32UD-40 | 31.5 in IPS display used for fixation cross presentation; resolution 3840 × 2160 at 60 Hz |
| Quiet testing room | Institutional facility | N/A | Used to minimize environmental distraction during recordings |
References
- Rings, T., von Wrede, R., Bröhl, T., Schach, S., Helmstaedter, C., et al. Impact of transcutaneous auricular vagus nerve stimulation on large-scale functional brain networks: from local to global. Front Physiol. 12, 700261(2021).
- Kong, J., Fang, J., Park, J., Li, S., Rong, P. Treating depression with transcutaneous auricular vagus nerve stimulation: state of the art and future perspectives. Front Psychiatry. 9, 20(2018).
- Badran, B. W., et al. Short trains of transcutaneous auricular vagus nerve stimulation (taVNS) have parameter-specific effects on heart rate. Brain Stimul. 11 (4), 699-708 (2018).
- Farmer, A. D., et al. International consensus based review and recommendations for minimum reporting standards in research on transcutaneous vagus nerve stimulation (version 2020). Front Hum Neurosci. 14, 568051(2020).
- Yakunina, N., Kim, S. S., Nam, E. -C. Optimization of transcutaneous vagus nerve stimulation using functional MRI. Neuromodulation. 20 (3), 290-300 (2017).
- Parente, J., et al. Neural, anti-inflammatory, and clinical effects of transauricular vagus nerve stimulation in major depressive disorder: a systematic review. Int J Neuropsychopharmacol. 27 (3), pyad058(2024).
- Chao, J., et al. fNIRS evidence for distinguishing patients with major depression and healthy controls. IEEE Trans Neural Syst Rehabil Eng. 29, 2211-2221 (2021).
- Ho, C. S. H., et al. Diagnostic and predictive applications of functional near-infrared spectroscopy for major depressive disorder: a systematic review. Front Psychiatry. 11, 378(2020).
- Ludwig, M., Pereira, C., Keute, M., Düzel, E., Betts, M. J., et al. Evaluating phasic transcutaneous vagus nerve stimulation (taVNS) with pupil dilation: the importance of stimulation intensity and sensory perception. bioRxiv. , (2024).
- Fox, M. D., Buckner, R. L., White, M. P., Greicius, M. D., Pascual-Leone, A. Efficacy of transcranial magnetic stimulation targets for depression is related to intrinsic functional connectivity with the subgenual cingulate. Biol Psychiatry. 72 (7), 595-603 (2012).
- Drysdale, A. T., et al. Resting-state connectivity biomarkers define neurophysiological subtypes of depression. Nat Med. 23 (1), 28-38 (2017).
- Kaiser, R. H., Andrews-Hanna, J. R., Wager, T. D., Pizzagalli, D. A. Large-scale network dysfunction in major depressive disorder: a meta-analysis of resting-state functional connectivity. JAMA Psychiatry. 72 (6), 603-611 (2015).
- Whitfield-Gabrieli, S., Ford, J. M. Default mode network activity and connectivity in psychopathology. Annu Rev Clin Psychol. 8, 49-76 (2012).
- Fang, J., et al. Transcutaneous vagus nerve stimulation modulates default mode network in major depressive disorder. Biol Psychiatry. 79 (4), 266-273 (2016).
- Bassett, D. S., Sporns, O. Network neuroscience. Nat Neurosci. 20 (3), 353-364 (2017).
- Gu, S., et al. Controllability of structural brain networks. Nat Commun. 6, 8414(2015).
- Brigadoi, S., et al. Motion artifacts in functional near-infrared spectroscopy: a comparison of motion correction techniques applied to real cognitive data. Neuroimage. 85 (Pt 1), 181-191 (2014).
- Yücel, M. A., et al. Best practices for fNIRS publications. Neurophotonics. 8 (1), 012101(2021).
- Berman, G. J., Bialek, W., Shaevitz, J. W. Predictability and hierarchy in Drosophila behavior. Proc Natl Acad Sci U S A. 113 (42), 11943-11948 (2016).
- Atanackov, P., Peterlin, J., Derlink, M., Kovačič, U., Kejžar, N., et al. The acute effects of varying frequency and pulse width of transcutaneous auricular vagus nerve stimulation on heart rate variability in healthy adults: a randomized crossover controlled trial. Biomedicines. 13 (3), 700(2025).
- Anderson, Z., Turner, J. A., Ashar, Y. K., Calhoun, V. D., Mittal, V. A. Application of hyperalignment to resting state data in individuals with psychosis reveals systematic changes in functional networks and identifies distinct clinical subgroups. Aperture Neuro. 4, (2024).
- Austelle, C. W., et al. A comprehensive review of vagus nerve stimulation for depression. Neuromodulation. 25 (3), 309-315 (2022).
- Badran, B. W., et al. Neurophysiologic effects of transcutaneous auricular vagus nerve stimulation (taVNS) via electrical stimulation of the tragus: a concurrent taVNS/fMRI study and review. Focus. 20 (1), 80-89 (2022).
- Baig, S. S., et al. Optimizing non-invasive vagus nerve stimulation for treatment in stroke. Neural Regen Res. 20 (12), 3388-3399 (2025).
Reprints and Permissions
This article has been published
Video Coming Soon