We present a 3D glioblastoma migration model using patient derived magnetic gliomaspheres generated from newly diagnosed and recurrent tumors. This platform allows visualization of patient specific migration dynamics and assessment of therapeutic efficacy. The assay can be multiplexed post migration to evaluate protein localization and expression patterns.
Method Article
Reproducible 3D Glioblastoma Migration Assay with Magnetic Nanoparticle Mediated Spheroid Localization Under Hypoxic Conditions
In This Article
Summary
Abstract
We describe a reproducible 3D migration assay to model the migratory and invasive potential of patient-derived glioblastoma gliomaspheres from newly diagnosed and recurrent tumors under clinically relevant hypoxic conditions. Uniform sized gliomaspheres are transferred onto a thin layer of extracellular matrix and co-cultured with magnetic iron oxide nanoparticles, which enable their centralized localization within culture wells via placement onto a magnetic plate holder. The inclusion of magnetic iron oxide nanoparticles on seeding facilitates precise, localized imaging of individual patient derived gliomaspheres via a gentle magnetic force and optimizes automated image processing pipelines by reducing positional variability. This assay supports detailed study of glioblastoma migratory behavior in a physiologically relevant microenvironment and allows direct comparison of invasive potential and migratory behavior between newly diagnosed and recurrent patient derived gliomaspheres. The method is compatible with live cell imaging and multiplexed analysis, offering a scalable platform for preclinical investigation of glioblastoma migration, invasive potential, and therapeutic response.
Introduction
Glioblastoma remains one of the most significant challenges in neuro oncology. This disease is driven by extensive inter and intra patient heterogeneity, robust evasion of response to standard of care, resistance to apoptotic induction, and remarkable plasticity in response to environmental conditions1 . More recently, the complexity of the tumor microenvironment (TME) has gained considerable attention, particularly the dynamic nature of glioma stem like cells (GSCs), which can switch phenotype and cell state in response to microenvironmental changes2,3. This phenotypic plasticity promotes tumor progression and contributes to inevitable recurrence despite aggressive frontline standard of care treatment. Surgical resection remains the most effective intervention for improving patient prognosis, however, due to the highly infiltrative and microscopic invasive nature of glioblastoma, complete tumor removal is not achievable4. Modelling the invasive dynamics of patient samples across various disease stages and in tumor specific conditions will facilitate a deeper understanding into the dynamic and plastic ability of glioblastoma migration and therefore help to identify effective novel treatment approaches5. Therefore, developing physiologically relevant models that capture patient specific invasion and migration dynamics is essential for enhancing pre-clinical research and progressing these objectives. Moreover, such models are critical for evaluating the efficacy of novel anti-tumor therapies, which could in theory be developed for use in combination with surgery to prevent residual microscopic invasion and ultimately reduce recurrence risk. The complexity of glioblastoma justifies the need for advanced complex preclinical models that can recapitulate key tumor architectural features. Patient derived three-dimensional models have gained increased attention for their ability to preserve cell to cell interactions, maintain gradients of nutrients, oxygen, and therapeutic agents, and replicate the structural integrity of native tumors6,7. However, visualizing these 3D models presents technical challenges, including spheroid positioning, imaging variability, and assay reproducibility.
Here, we describe a patient specific 3D glioblastoma migration model performed under hypoxic conditions, enabling the investigation of migratory dynamics across samples derived from various patient tumor subtypes and disease stages, including treatment naive and recurrent tumor samples. This platform allows assessment of differential responses to therapeutic agents and supports multiplex post migration analysis through image segmentation, enabling quantitative evaluation of migration dynamics, spheroid growth and protein expression. The incorporation of magnetic iron oxide nanoparticles allows consistent centralization of spheroids within each well by applying a gentle magnetic force8. Spheroids cultured in standard multiwell plates often exhibit a tendency to drift toward the well edges, a behavior believed to be influenced by the formation of liquid menisci and peripheral evaporation, especially in wells at the plate perimeter9,10,11. These phenomena introduce imaging artifacts and background noise, particularly during transmitted light microscopy which can complicate time lapse imaging of invasion dynamics. Unlike 2D monolayer cultures, where regions of uniform cell density can be selected for imaging, single spheroid invasion assays require precise and consistent positioning of the entire spheroid and migration area within the imaging field. This adds an additional challenge, as drift or irregular positioning within the well can compromise data quality and reproducibility. Therefore, consistently centralizing spheroids within multiwell plates minimizes these challenges and improves not only imaging quality but experimental consistency, image processing pipelines and post migration analyses. Additionally, initiating spheroid cultures at uniform cell densities in these specialized spheroid culture plates promotes reproducible spheroid formation, reducing the variability in morphology, growth rate, and structural integrity10,11. In practical terms, typical gliomaspheres used in these assays range from 150–300 µm in diameter, forming reproducibly under standardized cell densities. Cultures are maintained under hypoxic conditions (1%–2% O2).
The platform described here supports moderate to high throughput formats, such as 96‑well plates, enabling multiple replicates per patient sample, and is scalable for drug screening or multi-condition assays12 .Optimizing spheroid positioning and culture conditions is therefore essential to enhance the robustness and clinical relevance of 3D preclinical models used to study glioma invasive potential and other dynamic cellular processes.
Protocol
Patient derived glioblastoma cells were provided by Erasmus MC, Rotterdam, The Netherlands, and the Hospital for Sick Children (Toronto, Canada). The source primary patient samples for these lines were obtained as part of routine resections from patients under their informed consent (ethical approval numbers, MEC-2013-090, 0020010404).
1. Preparation of magnetic patient derived gliomaspheres (Figure 1)
- At least 30 min prior to gliomasphere dissociation, aliquot sufficient cell detachment enzyme medium and gliomasphere medium for the experiment (typically 1 mL per confluent T75 flask) and bring both to room temperature.
- Under sterile conditions, collect gliomaspheres from the culture flask by gentle aspiration using a 10 mL serological pipette and pipette aid and transfer them into a 15 mL conical tube. Centrifuge at 300 x g for 3 min. Carefully discard the supernatant without disturbing the cell pellet.
- Resuspend the pellet in 1 mL of room temperature cell detachment enzyme medium and incubate for 10–15 min, gently agitating every 2-3 min by pipetting with a P1000 pipette to facilitate dissociation into a single cell suspension.
- Add an equal volume of gliomasphere media to deactivate the enzyme. Centrifuge the single cell suspension at 300 x g for 3 min at 37 °C, then gently resuspend the cell pellet in 3–5 mL of complete gliomasphere medium, depending on the size of the cell pellet, noting the exact volume used for subsequent cell counting.
NOTE: The time of enzyme medium incubation will largely depend on the size of the gliomaspheres in culture, always visually inspect prior to use and adopt accordingly. - Take a representative 10 µL aliquot of the single cell suspension and gently mix with 10 µL of Trypan Blue in a 1.5 mL microcentrifuge tube. Load 10 µL of this mixture into a haemocytometer or an automated cell counter to determine viable cells.
- Seed 500 single glioblastoma cells per well into an ultra-low attachment 96-well spheroid microplate. Optimal seeding density may vary across patient samples.
- Add 1 µg/mL Propidium Iodide (PI) and 0.05 µL of iron oxide nanoparticles per well (for example, use 1.5 µL magnetic nanoparticles for 20 spheroids, corresponding to approximately 10,000 single cells). Ensure iron oxide nanoparticles are homogenized prior to addition by pipetting up and down with a P100 set to 100 µL.
NOTE: The volume of iron oxide nanoparticles used can be optimized depending on the cell line used, however, in this case, 1.5 µL per 10,000 cells was sufficient to centrally localize the spheroids. This setup ensures consistent spheroid size across patient samples, facilitating direct comparison of invasion and growth dynamics during invasion assay. - Incubate plates for 48 h in a humidified cell culture incubator at 37 °C, 5% CO2 and 21% O2 to allow gliomasphere formation.
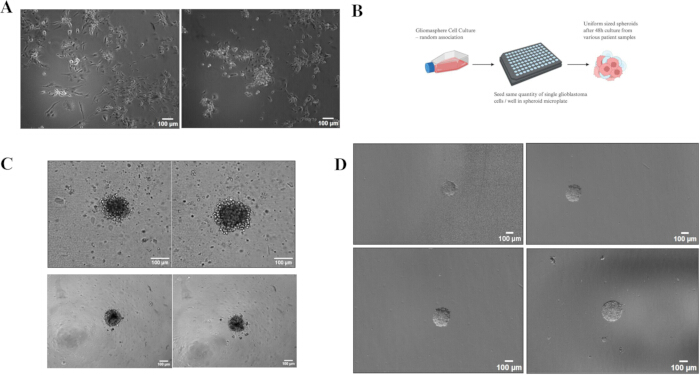
Figure 1: Uniformly sized and located gliomaspheres co-cultured with iron oxide nanoparticles. (A) Gliomaspheres derived from newly diagnosed and recurrent patient tumors exhibit dual phenotypes and random cell to cell associations. (B) Schematic representation of uniform sized spheroid formation within 48 h of seeding. (C) Transmitted light images of gliomaspheres cultured for 48 h in round bottomed spheroid microplate without (top panel) and with (bottom panel) iron oxide nanoparticles. Note the dark, speckled appearance of gliomaspheres containing iron oxide nanoparticles. (D) Gliomasphere positioning showing random localization of gliomaspheres cultured without nanoparticles (top) compared to consistent central localization of those cultured with nanoparticles (bottom), resulting in reduced background noise and enhanced image quality. Scale bar = 100 µm. Schematic made using Biorender.com. Please click here to view a larger version of this figure.
2. Preparation of extracellular matrix (ECM) coated multi well plates (1 h before migration assay)
- Aliquot and store the ECM as per manufacturer’s instructions. Thaw a 1 mL aliquot of ECM (1:10 dilution) slowly on ice overnight at 4 °C. Immediately prior to plating, prepare a final working solution at 1:100 (v/v) by performing a further 1:10 dilution of the 1:10 stock in ice-cold complete neurosphere medium. Keep the diluted ECM on ice at all times to prevent premature polymerization. Always keep this dilution on ice as ECM will polymerize rapidly at room temperature.
- Dispense 50 µL of the 1:100 ECM working solution into each well of a 96-well, clear, flat-bottom or µClear-bottom plate. Incubate the plate at 37 °C for at least 1 h to allow the ECM to set and form a thin matrix in each well.
- After incubation, carefully remove 30 µL from each well, leaving 20 µL of polymerized ECM (final concentration 1:100 v/v) coating the bottom of each well. The ECM must be kept as cold as possible during this time, as it rapidly polymerizes at room temperature. The imaging plate can also be pre-chilled and stored on ice during this process.
3. Imaging plate setup and live cell imaging
- On the day of the assay (48 h after gliomasphere seeding) place the ECM coated microplate onto a magnetic 96-well plate drive, as shown in Figure 2B,C. Sterilize the magnetic plate by spraying with 70% ethanol and wiping dry, do not soak.
- Visually inspect spheroids for quality and uniformity. Using a pipette, transfer 80 µL of medium containing the single gliomasphere from each well and pipette gently onto the plate with the ECM surface.
NOTE: For particularly large spheroids, take care to minimize shear stress during transfer; this can be achieved by cutting off 1-2 mm from the tip of a P100 pipette tip with scissors to widen the opening and reduce mechanical damage. Ensure scissors have been sterilized under UV prior to use. Most importantly, minimize the addition of any air bubbles, as this has a large impact on imaging. - Treat spheroids according to the experimental design. Prepare the treatment solutions at the desired concentrations in 20 µL volumes, then add this 20 µL to each well containing the spheroids to reach a final volume of 100 µL.
NOTE: Treating gliomaspheres in this way reduces pipetting and minimizes risk of removing the spheroids from the well. - Transfer the plate, while remaining on the magnetic drive, to the imaging system for live imaging. Take caution when removing the plate from the magnetic holder and keep as straight as possible to minimize movement of the spheroids from the center of the well.
- Perform live imaging using a programable inverted live cell microscope equipped with a Plan-Apochromat 5x/0.35 NA objective, a 0.5x tube lens, an Axiocam 506 camera (binning =2) and using Zen 3.1 (Blue Edition) software. Pixel to micron calibration is built into the imaging system and is automatically handled by the software, therefore, no manual calibration is required. In this case, perform imaging at a magnification of 2.5x (5x objective with a 0.5x tube lens), with the camera binned to 2 x 2, resulting in a calibration of 1 pixel = 3.645 µm.
- Adjust the environmental controls so that there is 1% oxygen and 5% CO2 with a very slow air flow rate from the gas mixer. This helps to prevent unwanted evaporation when the incoming air is passed through a humidifying bottle.
- To prevent gliomasphere displacement during the initial imaging period, reduce the microscopes stage acceleration and speed to 10%, minimizing movement across the ECM surface prior to spheroid adhesion.
- Gently load the multiwell plate without magnetic drive into the microscope. If applicable, ensure that the plate material is selected in the software to ensure the optics are adjusted to match.
- Use a suitable magnification that encompasses the entire invasive field of view. For example, on Cell Discoverer 7 the 5x objective and 0.5x tube lens were selected to yield a 2.5x magnification.
- Locate each gliomasphere, focus and assign a position that includes the x-y-z coordinates. Hardware autofocusing if available should be used to ensuring consistent imaging of the same focal plane throughout the experiment.
- Check in both phase gradient contrast (transmitted light) and fluorescence channels and adjust the exposure time and light intensity to ensure there is no overexposure. Excite propidium iodide (dead cell stain) using a 590 nm LED. Collect emission using a quad bandpass filter, capturing the 618–756 nm wavelength band. This may vary on other microscopes, depending on the filters and light source present.
- Set to take images every hour for the desired number of days.
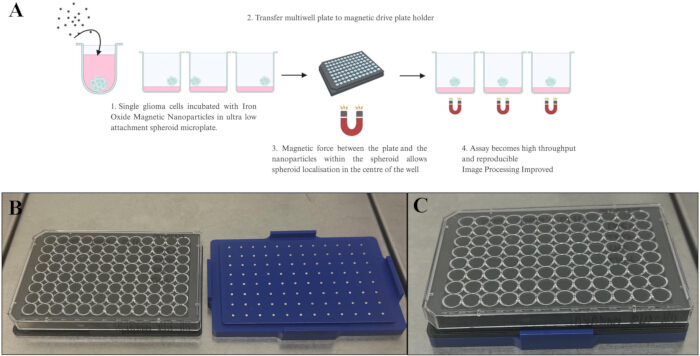
Figure 2: Description of imaging plate set up. (A) Schematic diagram representing the protocol described. (B) Image of multiwell plate adjacent to magnetic plate drive and simple mounting of multiwell plate on top of magnetic drive, with each individual magnet localized in the center of each well, facilitating gliomasphere localization. Schematic made using Biorender.com. Please click here to view a larger version of this figure.
4. Fixation of spheroids following invasion assay for multiplexed protein analysis (Figure 3)
- Following completion of the invasion assay, wash each well with 100 μL of PBS. This will bring the volume to 200 μL/well. Repeat this step by subsequently removing 100 μL of PBS and replacing with an additional 100 μL of PBS.
- Carefully remove 200 μL of medium, then add 100 μL of 4% paraformaldehyde (PFA) to each well and incubate for 10 min at room temperature under a fume hood.
CAUTION: Paraformaldehyde is a toxic chemical, and caution should be taken to minimize risk or exposure. - After fixation, remove the PFA from each well and wash 3x with PBS by removing the PFA and adding 100 mL of PBS each time.
- Add immune staining as per manufacturer’s instructions. Alternatively, for long-term storage, add sodium azide (0.02%) to the PBS to maintain sterility and seal the plate with a transparent film. Store at 4 °C until required.
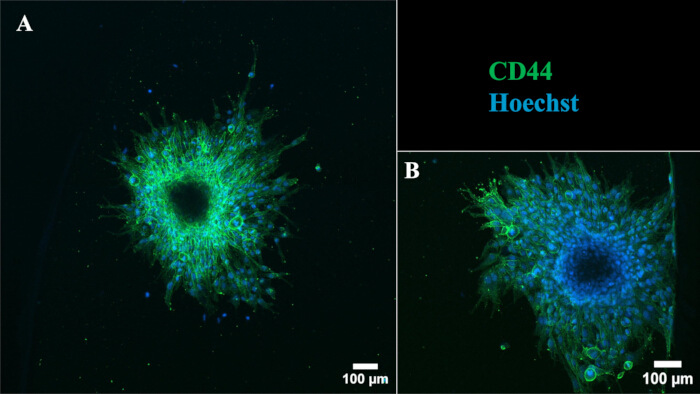
Figure 3: Representative protein analysis following migration assay of gliomaspheres located at the center vs at the edge of the well. Laser scanning confocal microscopy of recurrent gliomaspheres immunostained with an antibody targeting the Glioblastoma stem cell marker CD44 post migration assay. CD44-FITC (green) and Hoechst (nuclei, blue). Scale bar = 100 µm. Arrowheads indicate the edge of the well. Please click here to view a larger version of this figure.
5. Image processing pipeline of patient derived migration dynamics
NOTE: From experience with our dataset, we recommend that the processing computer has a multicore processor with a high base core frequency and a substantial amount of memory as the WEKA processing befits greatly from a high core count and will make use of available memory depending on dataset size. Used and recommended specification as listed below. Note that GPU processing is not used by this workflow.
CPU: >= 6 cores | >= 2 GHz (recommended); 32 cores | 2.1 GHz (used)
Memory: > 32 GB (recommended); 192 GB (used)
- Open Fiji13 [at present the included ImageJ-win64.exe executable is used for analysis]. Open Image by navigating to – File > Open Select multi-channel, multi scene time-lapse image file (.czi) opens on the Fiji Interface (if using the script, this is the Supplementary File 1).
- Select the images required in the GUI. It works best if the most invasive gliomaspheres in the experiment to initially train the classifier (i.e. control well – DMSO), as this image will provide details on each segment of the image, i.e. the appearance of invading/migrating cells vs spheroid vs background.
- Then navigate to Image > Color > Split Channels - this separates the image into two channels – one in this case with Propidium Iodide staining and the other with transmitted light.
- Select the channel for segmentation – in this case, the transmitted light channel which represents the migration dynamics. Navigate to Plugins > Segmentation > Trainable WEKA segmentation14.
- Rename the two default classes as: Class 1: Gliomasphere; Class 2: Invasion/Migration. Add a third class named Background (optional but recommended) by navigating to Settings > New class > Background.
- Using the Freeline tool annotate training regions within each image stack and class by drawing on the representative regions i.e., draw a swirl in the spheroid and click Add to Spheroid repeat this for the invasion area and background until all regions are represented in each class. Train the classifier by clicking Train Classifier. Additional images can be annotated to further train the classifier to improve accuracy if required.
- When satisfied, save the trained classifier model using a file name like CellLine_Treatment_Classifier.model. Close the segmentation window when complete.
- For new images using this saved classifier go to Plugins > Segmentation > Trainable WEKA segmentation >Load Classifier> Open Saved Classifier CellLine_Treatment_Classifier (this saves a .model - file . It is one requirement for Supplementary File 2 to have this prepared before the script is run. When the script is initiated, the appropriate sample file must be selected).
- Navigate to Get probability on the Trainable WEKA segmentation interface - This produces probability maps for each class selected i.e., Gliomasphere, Invasion/Migration, Background indicating the likelihood that each pixel value assigned to the image belongs to the specific class or region of the image. This will generate a file of 3 separate images of probability maps (Gliomasphere, Invasion, Background) with 32 bit dynamic range for each image.
- Select the probability map corresponding to Invasion/Migration. Navigate to Image > Hyperstacks > Reduce Dimensionality. Select Keep Source.
- Untick Channels but keep Frames - this reduces the map to a single channel over time – in this case, the Invasion probability map. Select the probability map corresponding to Gliomasphere.
- Repeat steps 5.10-5.11. There will now be two probability maps corresponding to the original transmitted light time lapse image for one scene of the migration- and the spheroid area. Save both with the following file name convention: ImageName_Scene_Gliomasphere_ProbabilityMap and ImageName_Scene_Invasion_Probability Map in a folder corresponding to the experiment selected i.e., CellLine_Treatment.
- Set threshold to create a binary mask: Go to Image > Adjust > Threshold. Choose a threshold method (e.g., Yen, Otsu). Keep selected method the same across all processed images.
- Navigate to Analyze > Set Measurements. Select the desired measurements; Tick Area, Integrated Density, and Mean then press Ok. Navigate to Analyze > Analyze Particles. For Invasion/Migration, set size: 0 – infinity; circularity: 0.00 – 1.00. For Gliomaspheres, set size: typically, 1500 – Infinity (adjust as needed based on spheroid size in cell line/treatment - control spheres will naturally grow larger); circularity: 0.05 – 1.00. Select pixel units for all.
- Navigate to Analyze>Analyze Pixels> Show: Select Masks. After masks are generated, verify the segmented area of interest across the entire timelapse stack to ensure accurate tracking. Apply binary operations via Process > Binary > … (e.g., selecting Fill Holes when refining the spheroid mask), followed by navigating to Analyze > Analyze Particles > Show > Select Nothing and select Summarise. This will provide a summary window of selected measurements.
- Save the results by clicking File > Save As > Results. Save as a .csv file. Open in spreadsheet or other analysis software.
- Repeat the thresholding and particle analysis for all segmented classes (e.g., gliomaspheres, invasion) to extract respective measurements over time. The output .csv provides area (in pixels or microns depending on calibration) over time.
- Select the fluorescence channel representing PI staining (e.g., channel 2). Apply thresholding and particle analysis as above to identify dead cells. Use the Calculator Plus plugin to multiply masks of PI-positive cells with the gliomasphere mask and separately with the invasion masks to quantify dead cells for the specific regions.
- Export masks, probability maps, and summary tables as TIFF and CSV files with clear, descriptive filenames for documentation and downstream analysis. When using the script provided in the supplement the following naming convention can be found: e.g. FileName_Scene#_(PI-)Invasion_Summary.csv (data for objects over time), FileName_Scene#_(PI-)Invasion.zip (regions defined with analyse particles).
NOTE: Supplementary File 1 will generate single tif files with timelapse images for each scene. Supplementary File 2 will run the WEKA pixel classification based on a predefined classification model file on all scenes and all images in each time lapse providing probability maps for the Gliomasphere and also the invading cells. Supplementary File 3 will segment all images into Gliomaspheres and invading cells and quantify the areas covered as well as the partition of areas covered by dead (PI-positive) cells. Supplementary File 4 to run assumes a specific threshold method and also a specific region to be analyzed while Supplementary File 3 allows the user to set the threshold and adjust the region for each scene. The threshold should not be changed to different methods for each scene but can be set to different methods for each object.
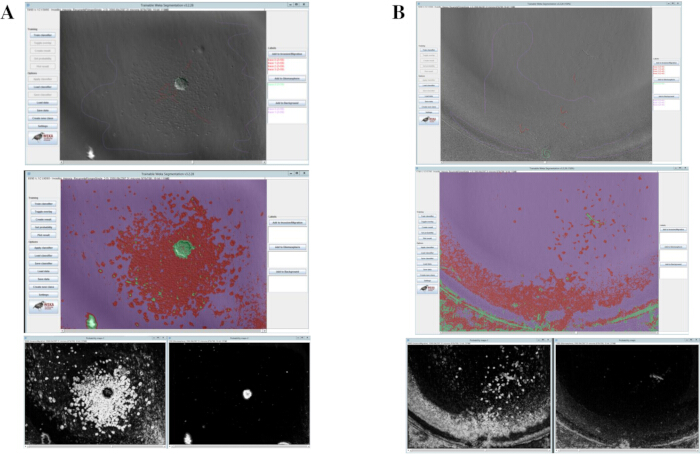
Figure 4: Challenge of reproducible image processing due to poor gliomasphere segmentation. Image processing pipeline using trainable WEKA segmentation plugin on Fiji showing (A) centrally localized gliomasphere with greater segmentation of migration area against background vs (B) gliomasphere localized to rim results in poor image segmentation and unusable replicate. By ensuring consistency in gliomasphere localization, image processing across biological replicates appears as shown in (A), greatly improving assay reproducibility and automation. Please click here to view a larger version of this figure.
Results
Using the described 3D migration assay under hypoxic conditions, gliomaspheres from recurrent patient tumors were treated with either vehicle or Drug X, and invasion dynamics were monitored every h for 72 h. Figure 5 describes the WEKA segmentation analysis of invasion dynamics, revealing that Drug X significantly reduces the invasive potential of recurrent gliomaspheres compared to vehicle controls under clinically relevant hypoxic conditions.
To further assess the impact of Drug X on stem cell characteristics post migration, gliomaspheres were fixed and immunostained for the expression and localization of the glioblastoma stem cell marker CD44, as shown in Figure 6. This multiplexed analysis facilitates visualization of migration dynamics and stem cell marker expression, providing insights into how Drug X modulates both invasive potential and stem-like properties of recurrent glioblastoma models under clinically relevant hypoxic conditions.
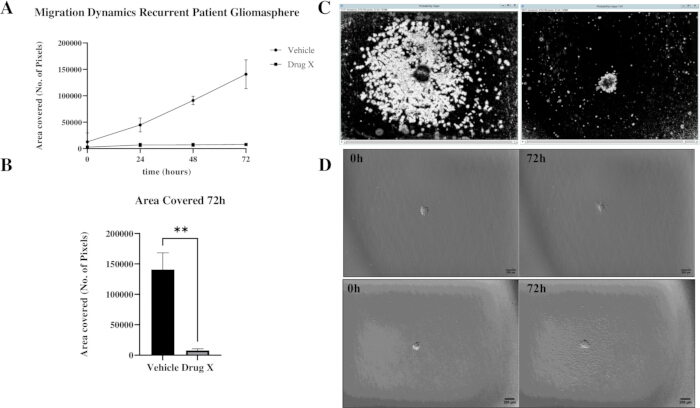
Figure 5: Optimized migration assay highlights the efficacy of novel Drug X in preventing recurrent gliomasphere migration. Patient derived recurrent gliomaspheres treated with vehicle or Drug X for 72 h under hypoxic conditions. Invasion dynamics were captured every h for 72 h. (A) Representative transmitted light images of invasion dynamics at 0 h and 72 h in top panel - Vehicle treated and bottom panel - Drug X treated. (B) Representative probability maps of invasion area used in the segmentation analysis. (C) Recurrent gliomaspheres treated with Drug X displayed significantly less invasive potential vs vehicle treated gliomaspheres. Quantification of the invasive area at 72 h revealed significantly decreased invasion in Drug X treated gliomaspheres, represented as total area covered at the time of fixation. Data represent invasion area over time from n=3 independent replicates. Statistical significance was assessed using an unpaired t-test; p < 0.005 is indicated by **. Please click here to view a larger version of this figure.
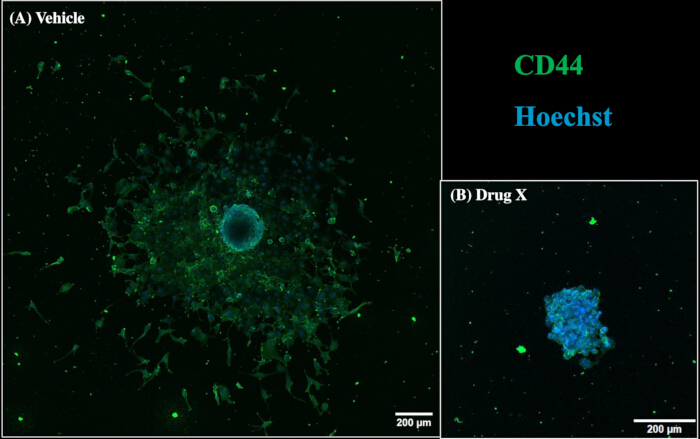
Figure 6: Migration and stem cell marker expression following treatment. Gliomaspheres described in Figure 5 were fixed post migration and immunostained using an antibody targeting the glioblastoma stem cell marker CD44 following treatment with either vehicle or Drug X. This figure demonstrates the type of multiplexed post migration analysis that can be performed using standard immunostaining techniques. Images show CD44-FITC (green) and Hoechst (nuclei, blue). Scale bar = 200 µm. Please click here to view a larger version of this figure.
Supplementary File 1: Resaving multiscene CZI files from the microscope as a single scenes as TIF files.Please click here to download this file.
Supplementary File 2: Generating probability maps using a Weka model.Please click here to download this file.
Supplementary File 3: Segmentation analysis without threshold. Please click here to download this file.
Supplementary File 4: Segmentation analysis with threshold. Please click here to download this file.
Discussion
Modelling the invasive dynamics of highly aggressive tumors such as glioblastoma is critical for improving our understanding of disease processes and identifying more effective treatment strategies. The complex, adaptive, and plastic nature of glioblastoma cell migration necessitates preclinical models that can accurately capture the dynamic behaviors of individual glioma cells as they migrate from the central tumor mass. Importantly, modelling these processes across patient derived samples from different stages of disease enables researchers to better address the challenge of tumor heterogeneity and identify any stage specific changes in invasion dynamics.
Given this complexity, it is reasonable to assume that preclinical models should possess an equivalent level of sophistication. Here, we describe a refined method for generating uniformly sized patient derived gliomaspheres co-cultured with iron oxide nanoparticles. This approach allows controlled localization of gliomaspheres at the center of each well, enabling automated live cell imaging of invasion dynamics. Several studies have highlighted significant variability in spheroid size, shape, and growth kinetics when using conventional 3D culture methods, Sayde and colleagues demonstrated that spheroids can exhibit wide diameter distributions between those derived from unsorted versus sorted cancer stem cell populations, reflecting inherent variability in spheroid formation15,16. This heterogeneity has also been identified as a major source of reproducibility issues in spheroid based drug screening assays, further emphasizing the importance of generating homogeneous spheroid populations12. These findings stress the necessity of standardizing spheroid formation conditions prior to conducting functional analyses, challenges which this method directly addresses. By standardizing both spheroid size and position, this method significantly enhances reproducibility and minimizes variability typically associated with 3D cell culture systems, where uneven spheroid formation can affect downstream analysis.
During the initial development of this assay, we observed substantial variability in spheroid localization across replicates, requiring the use of a large number of wells per experiment but also many biological replicates to obtain statistically significant results. This not only substantially increased workload but also generated a significant amount of unusable data, reduced assay efficiency and reproducibility. The resulting variability therefore reflected loss of quantifiable data rather than differences in invasion behavior. By centralizing gliomaspheres within each well, magnetic localization ensures that images from all replicates can be consistently segmented and analyzed, even where biological differences in invasion dynamics are observed between samples.
The incorporation of iron oxide nanoparticles introduces a gentle magnetic force that consistently centralizes gliomaspheres across all wells, greatly improving the performance of the image processing pipeline, data processing, and post migration analyses, without affecting gliomasphere biology or viability8. A key advantage of this system is its compatibility with post migration multiplexed analysis, for example, Figure 6 represents analysis of the visualization of the glioblastoma stem cell marker CD44, which enables evaluation of stem like cell expression following migration and treatment across patient samples. This capability highlights the platforms potential for integrative studies linking invasive phenotypes to molecular features, an important consideration given the phenotypic plasticity of glioblastoma stem like cells in response to microenvironmental cues and their ability to evade treatment promoting inevitable tumor recurrence.
While this assay greatly improves the reproducibility of visualizing single spheroid invasion dynamics, there remains some critical limitations that must be considered for future assay optimization. Matrigel is a widely used model of basement membrane, however it is a complex, undefined extracellular matrix (ECM) substitute derived from murine sarcomas, which does not fully recapitulate the human brain microenvironment17. Future optimization of the assay could incorporate brain specific ECM models to better mimic the brain tumor microenvironment, which we believe is an imperative optimization step of in vitro brain invasion models18,19. While Matrigel remains a widely adopted model of ECM, it represents a non-brain specific extracellular matrix derived from murine sarcoma. As such, it does not fully recapitulate the biochemical and mechanical properties of the human brain microenvironment. Importantly, the magnetic localization strategy described here is matrix independent and could be readily adapted to brain specific ECM systems in future studies to further enhance physiological relevance.
Other considerations of the assay are the potential requirements of training a new WEKA segmentation model for each cell line due to sample heterogeneity and variability in invasion morphology. Additionally, both seeding density and nanoparticle concentration should be optimized for each cell line and spheroid type to maintain uniformity and viability prior to performing high throughput migration assays. Regardless of these limitations, this platform provides a scalable and adaptable framework for studying patient specific glioblastoma invasion and treatment response. Its compatibility with live cell imaging, automated segmentation pipelines, and multiplexed post assay analysis opens opportunities for high content screening of novel therapeutics, combination therapies, and mechanistic studies of invasion from highly heterogenous samples of patient tumors. Furthermore, extending this assay to co culture systems, such as resident brain cells such as astrocytes, neurons and microglia or models of blood brain barrier interactions yield additional insights into tumor stroma interactions that drive glioblastoma progression and recurrence.
Several technical steps were identified during assay development as critical determinants of reproducibility and overall assay performance. Standardizing the seeding density of cell lines prior to the assay ensures that initial gliomasphere size is consistent, this enables spheroid growth dynamics to be comparable across cell lines, treatments and conditions. Without this standardization step, the initial spheroid sizes will add a significant level of variability, which may then reflect variable responses of gliomaspheres to experimental conditions. Precise central localization of gliomaspheres within each well is a key requirement for accurate automated image acquisition and downstream segmentation. Off center spheroids resulted in substantial imaging noise and prevents the use of the WEKA segmentation as a means to segment the images into clearly defined regions. By ensuring all gliomaspheres are localized in the center, the same WEKA classifier can be used multiple times as noise is substantially reduced and image quality dramatically improves. A representation of this is shown in Figure 1. The incorporation of magnetic iron oxide nanoparticles is therefore a method of ensuring central location of gliomaspheres, minimizing positional variability and substantially improving image processing and comparability across replicates. Lastly, segmentation model training within the WEKA pipeline represents an additional critical standardization step. Due to inter-patient heterogeneity and differences in invasion morphology, a single segmentation model may not generalize across all samples. Retraining or refining classification parameters for each cell line ensures accurate probability maps of invasive areas and prevents quantification errors.
Overall, this assay provides a reproducible and scalable platform for studying the dynamic invasive behaviors of patient derived glioma samples in real time. Its compatibility with multiplexed imaging and downstream molecular analyses makes it a powerful and versatile tool for both basic and translational glioma research which will greatly enhance the translational relevance of pre-clinical glioblastoma models.
Disclosures
Nothing to disclose
Acknowledgements
This work was supported by Research Ireland (Science Foundation Ireland) under grant code 20391A01 and the Health Research Board under grant code ERA-TRANSCAN-2022-002. Cells were kindly provided by our collaborators in the Dirks Lab, SickKids, Toronto and The Erasmus Medical Center (EMC), Rotterdam.
Materials
| Name | Company | Catalog Number | Comments |
|---|---|---|---|
| 96 WELL BIOPRINTING KIT, CLEAR | Greiner | 655840 | |
| Accutase | Invitrogen | 00-4555-56 | n/a |
| B-27 Supplement (50X), serum free without vitamin A | Gibco | 12587010 | 10% |
| Basic Fibroblast Growth Factor, Human (bFGF) | PeproTech | 100-18B | 20 ng/ml |
| Celldiscoverer 7 | Zeiss | - | |
| Corning Spheroid Microplates | Corning | CLS4515 | |
| Corning Matrigel Matrix | Corning | 354234 | 1:100 final dilution |
| Countess Automated Cell Counter | Invitrogen | - | |
| DMEM-F12 (500ml) | Thermofischer | 11320-074 | n/a |
| Epidermal Growth Factor Human (EGF) | PeproTech | AF-100-15 | 20 ng/ml |
| FITC Mouse Anti-Human CD44 | BD Pharmingen | 555478 | 1:100 |
| Greiner CELLSTAR 96 Well Polystyrene Cell Culture Microplates with F-Bottom/Chimney Well, µClear, Black, TC, Sterile, With Lid | Greiner | 655090 | |
| Heparine | Thermofischer | A16198 | 5µg/ml |
| Hoechst 33258 | Sigma Aldrich (Merck) | 861405 | 1µg/ml |
| NanoShuttle-PL | Greiner | 657841 | 1.5 µl/10,000 cells |
| Penicillin - Streptomycin | Merck | P4333 | 1% |
References
- Singh, S., et al. Glioblastoma at the crossroads: Current understanding and future therapeutic horizons. Signal Transduct Target Ther. 10 (1), 213(2025).
- Spitzer, A., et al. Deciphering the longitudinal trajectories of glioblastoma ecosystems by integrative single-cell genomics. Nat Genet. 57 (5), 1168-1178 (2025).
- Dirkse, A., et al. Stem cell-associated heterogeneity in glioblastoma results from intrinsic tumor plasticity shaped by the microenvironment. Nat Commun. 10 (1), 1787(2019).
- Dejaegher, J., De Vleeschouwer, S. Glioblastoma. De Vleeschouwer, S. , Brisbane (AU). (2017).
- Restall, I., Bozek, D. A., Chesnelong, C., Weiss, S., Luchman, H. A. Live-cell imaging assays to study glioblastoma brain tumor stem cell migration and invasion. J Vis Exp. (138), e58152(2018).
- Xie, Y., et al. The human glioblastoma cell culture resource: Validated cell models representing all molecular subtypes. EBioMedicine. 2 (10), 1351-1363 (2015).
- Paolillo, M., Comincini, S., Schinelli, S. In vitro glioblastoma models: A journey into the third dimension. Cancers (Basel). 13 (10), 2449(2021).
- Aye, K. T. N., Ferreira, J. N., Chaweewannakorn, C., Souza, G. R. Advances in the application of iron oxide nanoparticles (ions and spions) in three-dimensional cell culture systems. SLAS Technol. 29 (3), 100132(2024).
- Das, V., Furst, T., Gurska, S., Dzubak, P., Hajduch, M. Reproducibility of uniform spheroid formation in 384-well plates: The effect of medium evaporation. J Biomol Screen. 21 (9), 923-930 (2016).
- Das, V., Furst, T., Gurska, S., Dzubak, P., Hajduch, M. Evaporation-reducing culture condition increases the reproducibility of multicellular spheroid formation in microtiter plates. J Vis Exp. (121), e55403(2017).
- Mansoury, M., Hamed, M., Karmustaji, R., Al Hannan, F., Safrany, S. T. The edge effect: A global problem. The trouble with culturing cells in 96-well plates. Biochem Biophys Rep. 26, 100987(2021).
- Zanoni, M., et al. 3d tumor spheroid models for in vitro therapeutic screening: A systematic approach to enhance the biological relevance of data obtained. Sci Rep. 6, 19103(2016).
- Schindelin, J., et al. Fiji: An open-source platform for biological-image analysis. Nat Methods. 9 (7), 676-682 (2012).
- Arganda-Carreras, I., et al. Trainable weka segmentation: A machine learning tool for microscopy pixel classification. Bioinformatics. 33 (15), 2424-2426 (2017).
- Sayde, T., et al. Reproducible 3d culture of multicellular tumor spheroids in supramolecular hydrogel from cancer stem cells sorted by sedimentation field-flow fractionation. J Chromatogr A. 1736, 465393(2024).
- Lee, S., Lim, J., Kwak, B. Factors of bias in spheroid-based drug screening: Fabrication method, spheroid size, and cell viability. Biomed Pharmacother. 192, 118597(2025).
- Aisenbrey, E. A., Murphy, W. L. Synthetic alternatives to matrigel. Nat Rev Mater. 5 (7), 539-551 (2020).
- Barbugian, F., et al. Bioresponsive hyaluronic acid-based hydrogel inhibits matrix metalloproteinase-2 in glioblastoma microenvironment. ChemMedChem. 20 (15), e202401040(2025).
- Carvalho, E. M., et al. Viscoelastic high-molecular-weight hyaluronic acid hydrogels support rapid glioblastoma cell invasion with leader-follower dynamics. Adv Mater. 36 (50), e2404885(2024).
Reprints and Permissions
