This protocol presents a standard high-throughput screening workflow for industrial microorganisms. It involves constructing a mutant library via ARTP mutagenesis, performing positive droplet screening with automated microfluidics, and subsequently verifying the results. The workflow’s reliability was validated by screening high-yield B. coagulans strains.
A subscription to JoVE is required to view this content. Sign in or start your free trial.
Method Article
High-Throughput Screening of L-Lactic Acid-Hyperproducing Bacillus coagulans Mutants Using an Automated Droplet Microfluidic Platform
* These authors contributed equally
In This Article
Summary
Abstract
Industrial biomanufacturing relies on microorganisms to efficiently synthesize target products under engineered conditions. However, wild-type strains often lack the capability to do so due to their native metabolic networks. Therefore, the rapid and accurate screening of high-performance strains from large-scale mutant libraries is a critical step in industrial microbial breeding. In recent years, droplet microfluidic technology has attracted significant attention for its high throughput, low consumption, and single-cell compartmentalization capabilities, leading to the development of numerous single-cell sorting systems. A high‑throughput screening protocol for industrial microbial strains using an automated droplet microfluidic platform is presented in this study. The integrated workflow comprises four key stages: construction of a mutant library via atmospheric and room-temperature plasma (ARTP) mutagenesis; high‑efficiency single‑cell encapsulation and controlled micro‑cultivation within picoliter‑scale droplets; precise pico‑injection of a fluorescent biosensor, followed by fluorescence‑activated droplet sorting (FADS) to isolate droplets containing high‑producing variants; and validation of the sorted candidate strains through microplate and shake‑flask fermentation. A complete and integrated screening workflow is intended as a standardized template, and its validation is demonstrated through the isolation of high‑yielding L-lactic acid‑producing mutants of B. coagulans as a specific example. This automated, high-throughput screening platform offers a powerful technical solution with significant potential to accelerate industrial breeding of high-performance strains.
Introduction
Industrial biotechnology uses microorganisms and enzymes as biocatalysts to produce valuable products on a large scale. This approach is considered more environmentally friendly and efficient than traditional chemical manufacturing. However, the natural metabolic networks of microorganisms have evolved to prioritize their own survival and reproduction rather than the efficient synthesis of products desired by humans. As a result, high-throughput microbial breeding is often necessary to meet the demands of industrial production environments with strict conditions1,2,3. This process involves rapidly constructing large-scale microbial mutant libraries through physical or chemical mutagenesis, followed by culturing and phenotypic detection of mutants with distinct genotypes. Only a small fraction of superior strains are then selected. However, traditional plate‑based and microplate‑based screening technologies are hindered by cumbersome procedures, low throughput, and high cost. This bottleneck, along with the significant consumption of consumables and reagents, results in low overall efficiency of microbial breeding4,5.
Droplet microfluidics has recently emerged as a transformative solution to this challenge. In contrast to fluorescence-activated cell sorting (FACS), which is ill-suited for screening secreted products due to the rapid diffusion of molecules away from the cell, fluorescence-activated droplet sorting (FADS) encapsulates single cells in picoliter-scale, compartmentalized micro-reactors6,7,8. This physical isolation prevents strain competition, enables the localized accumulation of secreted metabolites, and allows for their quantitative detection via fluorescent biosensors. Consequently, FADS has proven to be an ideal platform for high-throughput screening of various extracellular products, including amino acids, organic acids, and enzymes. A team developed the genetically encoded fluorescent biosensor GECFINDER, and combined with FADS, they successfully screened high-phenylalanine-producing strains and improved the screening efficiency by more than 1000-fold9. Another group established a fluorescence-activated droplet sorting platform coupled with a genetically encoded biosensor for high-throughput screening of 3‑dehydroshikimic acid‑producing strains in E. coli, and the optimized FADS system greatly improved screening efficiency and enabled the isolation of mutant strains with significantly enhanced production10. Some researchers applied FADS technology to the engineering of Bst DNA polymerase, and the acquired mutants with greatly enhanced thermostability and strand displacement activity were further applied to LAMP detection, which reduced the reaction time from 40 min to 10 min11.
However, the translation of these technological advances into routine industrial strain development workflows remains challenging. Many commercial droplet microfluidic systems, despite their sophisticated hardware, lack a complete, intuitive, and reproducible standard operating procedure tailored for microbial phenotypic screening. To address this gap, an automated droplet microfluidic platform integrating modular fluidic control, user-friendly software, and standardized chip design was adopted, laying an ideal technical foundation for the establishment of a fully integrated screening workflow. This study uses the high‑throughput screening of high‑yielding L‑lactic acid‑producing B. coagulans as a validation case. Based on a droplet microfluidic platform, the following workflow was established, comprising four key sequential steps: (1) construction of a diverse mutant library via atmospheric and room‑temperature plasma (ARTP) mutagenesis; (2) high‑efficiency single‑cell encapsulation and controlled micro‑cultivation within droplets under conditions optimized for B. coagulans growth and L‑lactic acid production; (3) precise pico‑injection of an L‑lactate‑specific fluorescent biosensor, followed by high‑speed sorting of droplets encapsulating superior producers; and (4) rigorous validation of sorted candidates through shake‑flask fermentation to confirm enhanced production and genetic stability. This protocol is intended for researchers and engineers engaged in industrial microbial breeding who require high‑throughput screening of extracellular products. It is particularly suitable for culturable bacteria that secrete small‑molecule metabolites or enzymes. The screening platform must be equipped with sensors compatible with the droplet microenvironment to enable specific detection of the target metabolites. For strains with special cultivation requirements (e.g., strict anaerobes), the cultivation parameters can be adapted to optimize and establish a dedicated culturing strategy. By establishing this closed‑loop, standardized screening workflow, this study aims to provide a powerful and transferable solution for accelerating the industrial breeding of strains.
Access restricted. Please log in or start a trial to view this content.
Protocol
Ethical approval was not required for this study. All experiments were conducted using pure microbial cultures, and no human subjects or laboratory animals were involved in this research. See the Table of Materials for details on all materials used in the following protocol.
1. Preparations
CAUTION: Follow biosafety practices. B. coagulans is a Biosafety Level 1 organism. Wear gloves and a lab coat. Perform all open manipulations inside a laminar flow hood. Autoclave all materials that come into contact with live cells at 121 °C for 20 min before disposal.
- Strain source and maintenance
- Purchase B. coagulans ATCC 7050 from a commercial culture collection center as a second‑generation slant culture.
- Streak a loopful of the slant culture onto the seed medium agar and incubate at 50 °C for 24 h. Pick a single colony, inoculate it into liquid seed medium, and grow at 50 °C, 200 rpm for 12 h.
- Mix the resulting culture with sterile 40% glycerol to a final concentration of 25% (v/v) and store as frozen stocks at –80 °C. For each experiment, thaw a fresh aliquot, streak it onto seed medium agar, and incubate at 50 °C for 24 h.
- Then pick a single colony, inoculate it into liquid seed medium, and culture at 50 °C, 200 rpm for 12 h before using for mutagenesis and screening (Supplementary Figure 1).
- Lactic acid sensor
- Express and purify the eLACCO1.1 sensor as described in the Supplementary Materials12 (Supplementary Figure 2).
- Supplement the purified sensor with 5% (v/v) glycerol and store it at –80 °C. For each experiment, thaw one aliquot on ice and dilute it immediately with sterile 10 mM PBS (pH 7.4) to a final working concentration of 0.1 mg/mL.
- Preparation of culture media
- Seed medium (g/L: glucose 20, yeast extract 5, tryptone 10, sodium acetate 2, sodium citrate 2, K2HPO4 2, MgSO4·7H2O 0.2, MnSO4·H2O 0.05, FeSO4·7H2O 0.01). Sterilize glucose separately as a 200 g/L stock at 115 °C for 20 min.
- Autoclave the remaining components at 121 °C for 15 min. After cooling, add sterile glucose stock to a final concentration of 20 g/L, then filter-sterilize trace elements.
- Store the complete medium at 4 °C for up to one week. Use for overnight activation, inoculum preparation.
- Screening medium (g/L: glucose 20, yeast extract 6.66, NaCl 0.333, NH4Cl 0.665, KH2PO4 2, Na2HPO4 4.46, MgSO4 0.12, CaCl2 0.074).
- Sterilize glucose separately at 115 °C for 20 min. Autoclave the salt/yeast extract mixture at 121 °C for 15 min.
- After cooling, add the sterile glucose stock to 20 g/L. Store at 4 °C for up to one week. Use as the aqueous phase for droplet generation and as the culture medium inside droplets during the 10 h incubation.
- Fermentation medium (g/L: glucose 90, tryptone 13.33, yeast extract 13.33, sodium acetate 0.67, NaCl 0.0133, MgSO4·7H₂O 0.0133, MnSO4·H₂O 0.0133, FeSO4·7H2O 0.0133).
- Sterilize glucose as a 500 g/L stock at 115 °C for 20 min. Autoclave the other components at 121 °C for 15 min.
- After cooling, add the sterile glucose stock to 90 g/L. Add sterile CaCO3 powder (4% w/v) just before inoculation to buffer pH. Prepare fresh daily. Use for microplate primary screening and shake‑flask validation.
NOTE: Prepare all media with distilled water to a final volume of 1 L. Adjust pH to 6.5 with 1 M HCl.
- Seed medium (g/L: glucose 20, yeast extract 5, tryptone 10, sodium acetate 2, sodium citrate 2, K2HPO4 2, MgSO4·7H2O 0.2, MnSO4·H2O 0.05, FeSO4·7H2O 0.01). Sterilize glucose separately as a 200 g/L stock at 115 °C for 20 min.
2. Construction of a mutant library using ARTP
CAUTION: ARTP operation involves a high‑frequency plasma and a UV lamp. UV radiation can cause eye and skin injury. Plasma discharge generates ozone and high temperatures. Always keep the chamber door closed while plasma is on. Wear a lab coat and UV‑blocking goggles. Use only 99.999% pure helium; ensure adequate ventilation. After each mutagenesis operation, wipe the workbench and the inner walls of the mutagenesis chamber with a lint-free cloth dipped in 75% (v/v) ethanol. 75% ethanol is highly flammable. Keep away from open flames, sparks, and hot surfaces.
- Establish a standard curve correlating OD600 to viable cell concentration.
- Inoculate a single colony of B. coagulans into seed medium and incubate at 50 °C, 200 rpm for 12 h until the culture reaches the mid‑logarithmic phase.
- Prepare serial dilutions of the bacterial suspension at gradients of 104, 105, and 106.
- Pipette 100 µL of each dilution and spread evenly onto the seed medium agar plates in triplicate.
- Incubate all plated agar plates at 50 °C for 24 h.
- Count the colony‑forming units (CFU) for each dilution.
NOTE: Calibration shows that OD600 = 0.5 corresponds to approximately 1 × 10⁸ CFU/mL. Use this relationship to determine the initial cell density for droplet encapsulation (Supplementary Figure 3).
- Culture B. coagulans to the mid‑ to late‑logarithmic phase, then dilute the fresh seed culture to OD600 = 0.05 in fresh seed medium.
- Inside a laminar flow hood, prepare eight sterile small metal discs and one large metal disc. Flame the eight small discs over an alcohol burner for 1 min, place them on the sterile large disc, and allow them to cool for 10 min.
- Using a micropipette, uniformly spread 10 µL of the diluted bacterial suspension onto each of the eight cooled small discs.
- Transfer the large disc carrying the inoculated small discs into a sterile Petri dish.
- Power on the ARTP instrument and activate the main control screen. Turn on the UV lamp inside the mutagenesis chamber. Start the chiller and pre-cool for 20 min until the temperature stabilizes at 20 °C.
- Quickly open the mutagenesis chamber door and place the small discs inside.
- Using sterile forceps, sequentially transfer each small disc onto the ARTP sample stage.
NOTE: The RF power, helium gas flow rate, nozzle-to-sample distance, and helium purity were fixed at 120 W, 10 SLM, 2 mm, and 99.999%, respectively. The helium irradiation time was set to 5, 10, 15, 20, 25, and 30 s, respectively. - Subject each small disc to ARTP mutagenesis according to the set parameters. After irradiation, transfer all discs into a 50 mL centrifuge tube containing 10 mL of recovery medium. Incubate at 50 °C with shaking at 200 rpm for 4 h to allow cell recovery and outgrowth.
- Determination of the lethality rate.
- Serially dilute the recovered culture to a gradient of 10-2 to 10-6.
- Spread 100 µL of each dilution onto seed medium agar plates, and prepare three replicates for each dilution.
- Incubate all plates at 50 °C for 24 h.
- Count the colonies and calculate the corresponding CFU/mL.
- Calculate the lethality rate using the formula:
 (1)
(1)
NOTE: Perform the experiment in triplicate for each time point. The optimal mutagenesis time for ARTP in this case is 20 s (Supplementary Figure 4).
3. Composition of the automated droplet microfluidic platform and consumables
- Actuation system (Figure 1)
NOTE: It consists of 3 channels of high-precision pressure controllers with a pressure range of 0–1000 mbar and a pressure response time of < 50 ms (Figure 1A). - Imaging system
NOTE: High-speed CMOS microscopic imaging features high-speed image data acquisition of ≥ 2 GB/s, a frame rate of 0–20,000 fps, and a maximum resolution of 1280 x 860. The system features autofocus for real-time observation of droplet movement and supports recording images and videos, which can be exported in multiple formats, including BMP, AVI, MP4, and TIF. - Detection system
NOTE: It enables fluorescent signal detection with 2 lasers: 488 nm and 633 nm, and 2 detection channels. - Host control system
NOTE: Controlled by the automated droplet microfluidic platform software, the system integrates multiple modules, including fluid actuation, microscopic imaging, excitation and detection, droplet generation, pico-injection, and sorting. It also supports the acquisition, recording, storage, display, and export of experimental data. Partial operating units of the automated droplet microfluidic platform are shown (Figure 1B). - Consumables
NOTE: The consumables used in this protocol include: injection tube for oil phase, sample, and reagent (Figure 2A); collection tube for droplet incubation (Figure 2B); droplet generation chip (Figure 2C); droplet pico-injection chip (Figure 2D); and droplet sorting chip (Figure 2E).
4. Droplet generation
CAUTION: Clean the automated droplet microfluidic platform. After each experiment, wipe the stage, chip holder, and any spill areas with 75% ethanol using lint‑free wipes. Remove residual fluorinated oil, cell suspension, or sensor solution.
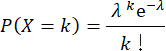
- Single-cell encapsulation. To obtain λ = 0.1 in 14 pL droplets, dilute the bacterial suspension to OD600 ≈ 0.04 (OD600=0.5 corresponds to 1 × 10⁸ CFU/mL). According to the Poisson distribution:
 (2)
(2)
When λ = 0.1, 90.5% of droplets are empty, 9.1% contain a single cell, and 0.4% contain multiple cells.
NOTE: In this case, the measured single‑cell encapsulation efficiency was 11.2% (Supplementary Figure 5). The number of cells per droplet can be determined by DAPI staining. When λ = 0.1 and the multi‑cell encapsulation rate exceeds 1%, the OD₆₀₀ should be reduced to lower the proportion of droplets containing multiple cells. - Pipette 300 µL of fluorinated oil into the oil phase inlet vial. Pipette 500 µL of the bacterial suspension into the aqueous phase inlet vial.
- Peel off the tape covering the droplet generation chip surface. Connect the oil vial, sample vial, and collection vial to the chip's corresponding wells in sequence.
- Place the chip on the stage and secure it. Connect the air tubes to the inlet vials one by one according to the gas path labels.
- Open the automated droplet microfluidic platform software. Adjust the stage movement knob according to the arrow directions on the chip to move the field of view to the droplet generation site.
- Click "Start" in the "Droplet Generation" interface of the automated droplet microfluidic platform software (Figure 3A). In the imaging interface, drag the "Z-axis" and light source brightness sliders to adjust the image clarity and brightness.
- Click the "+" and "-" buttons of "Droplet Speed" and "Droplet Size" to adjust the generation speed and droplet size.
NOTE: In this case, the oil-phase pressure and the sample-phase pressure for droplet generation are automatically set to 300 mbar and 400 mbar, respectively, to achieve a generation rate of 1500 Hz. Under these settings, the droplets are 14 pL in volume, with the CV of droplet diameter maintained below 5%, ensuring consistent droplet size and reliable downstream operations. - Wait for 1 min until the equipment stabilizes and the droplet generation state remains consistent. Quickly replace the collection vial to start droplet collection.
NOTE: Pre-add a small amount of fluorinated oil to the new collection tube to cover the lower port of the Teflon tube, ensuring that droplets do not directly contact the tube wall and cause fusion. - Stop droplet collection after 30 min of operation. Click "Stop" in the pop-up window to confirm stopping droplet generation.
- Gently remove the collection tube from the chip. Place the tube and collection vial vertically and wait for the droplets in the tube to enter the collection vial.
- Remove the chip, oil phase inlet vial, and aqueous phase inlet vial from the stage. Wipe the stage surface with 75% alcohol. The droplet generation stage is then completed.
5. Droplet cultivation
- Add 1 mL of mineral oil to the collection tube.
NOTE: The mineral oil layer covers the droplet suspension to minimize evaporation and reduce oxygen exposure, while still allowing sufficient gas exchange for the facultative anaerobe B. coagulans. - Place the collection tube upright in a 15 mL centrifuge tube containing sterile water. Keep the collection tube loosely capped and incubate at 45 °C for 10 h.
NOTE: After incubation, ensure that the CV of droplet diameter is <10% and that no droplet coalescence is observed. Discard batches if these criteria are not met.
6. Droplet pico-injection
CAUTION: High voltage is applied to the chip electrodes via the instrument connection during pico‑injection. The electric field can cause a severe electric shock. Do not touch the electrodes or the chip surface with metal tools or bare hands while the high voltage is active. Always disable the high voltage output before handling the chip. Wear insulated gloves and use non‑conductive tools.
- Prepare the oil phase inlet vial. In the laminar flow hood, pipette 300 µL of fluorinated oil into the oil phase inlet vial.
- Prepare the sample inlet vial. Remove the inlet vial cap from the collection tube that contains the droplets. Replace it with a new cap.
- Trim the tip of the new inlet vial. Cut a small portion from the front end of the new inlet vial so that the tip reaches below the liquid level of the droplets in the sample vial.
- Tighten the cap. Secure the cap tightly to prevent leakage.
- Prepare the reagent inlet vial. Pipette 500 µL of the lactic acid sensor into the reagent inlet vial.
- Add PBS to the reagent inlet vial. Simultaneously, add 500 µL of sterile PBS buffer to the same reagent inlet vial.
NOTE: PBS buffer is added in this experiment to balance the pH of the droplets. The final working concentration of the lactate sensor was 0.1 mg/mL, and the loading volume of the lactate sensor was 500 µL. - Use a blade to cut through the tape covering the electrode wells to expose the electrodes. Set the multimeter to continuity mode and test the circuit connection and the chip's short-circuit status.
NOTE: If the multimeter shows a normal circuit connection of the chip electrodes, proceed to the next step. If the circuit is open, replace the injection chip and test again. - After confirming normal circuit connection with the multimeter, peel off the tape on the chip surface. Connect the oil vial, sample vial, reagent vial, and collection vial to the corresponding wells of the chip in sequence.
- Place the chip on the stage and secure it. Connect the air tubes to the inlet vials one by one according to the gas path labels.
- Open the automated droplet microfluidic platform software. Adjust the stage movement knob according to the arrow directions on the chip to move the field of view to the electrode area of the droplet chip.
- Click "Start" in the "Droplet Pico-injection" interface of the automated droplet microfluidic platform software (Figure 3B). In the imaging interface, drag the "Z-axis" and light source brightness sliders to adjust the image clarity and brightness.
NOTE: At this point, the instrument automatically adjusts the oil-phase pump pressure to 400 mbar, the sample-phase pump pressure to 420 mbar, and the reagent-injection-phase pump pressure to 450 mbar. - At the initial stage of operation, a segment of air in the catheter will be discharged into the chip, which is a normal phenomenon that lasts several minutes.
- Wait for droplets to enter the field of view. Click "Start Pico-injection". At this point, the equipment's electric field will be activated. Adjust the droplet generation speed, droplet spacing, and injection volume by clicking the "+" and "-" buttons of "Droplet Speed", "Droplet Spacing", and "Injection Volume".
NOTE: The electric field is set to the default maximum gear. If droplets break in the electric-field region during the fusion process, switch to medium or low gear. In this case, the droplet injection rate was 200 Hz. - Observe in the high-speed image display software. If droplets can stably inject into the lactic acid sensor at a 1:1 ratio, wait 5 min for the equipment to stabilize. Quickly replace the collection vial to start droplet collection.
- After stable injection for 2 h, click "Stop" to end the droplet pico-injection.
- Gently remove the collection tube from the chip. Place the tube and collection vial vertically and wait for the droplets in the tube to enter the collection vial.
7. Droplet sorting
CAUTION: The demulsifier is an irritant and can cause skin and eye irritation. It is also harmful if inhaled or swallowed. Always wear appropriate personal protective equipment (gloves, lab coat, safety goggles). Handle the demulsifier in a well‑ventilated area or fume hood. Collect waste demulsifier in a separate, clearly labeled container. Do not pour down the sink.
- In the laminar flow hood, pipette 300 µL of fluorinated oil and add it to the oil phase inlet vial. Replace the inlet vial cap of the collection tube containing microinjected droplets with a new cap.
NOTE: Before performing droplet sorting experiments, take 5 µL of droplets and observe them under a fluorescence microscope. Measure the diameter of at least 200 droplets; proceed only if the CV < 10%. - Use a blade to cut through the tape covering the electrode wells to expose the electrodes. Set the multimeter to continuity mode and test the circuit connection and the chip's short-circuit status.
- After confirming normal circuit connection with the multimeter, peel off the tape on the chip surface. Connect the oil vial, sample vial, and sorting collection vial to the corresponding wells of the chip in sequence.
- Place the chip on the stage and secure it. Connect the air tubes to the inlet vials one by one according to the gas path labels.
- Open the high-speed imaging software. Adjust the stage movement knob according to the arrow directions on the chip to move the field of view to the electrode area of the droplet chip.
- Click "Start" in the "Droplet Sorting" interface of the automated droplet microfluidic platform software. In the imaging interface, drag the "Z-axis" and light source brightness sliders to adjust the image clarity and brightness.
NOTE: After clicking "Start", the instrument automatically adjusts the oil pump pressure to 300 mbar and the sample pump pressure to 190 mbar, resulting in a droplet throughput of 100 Hz. - At the initial stage of operation, a segment of air in the catheter will be discharged into the chip, which will last for several minutes and is a normal phenomenon.
- Click to select the “Laser” and choose the 488 nm detection channel.
NOTE: The experimental personnel may select a 488 nm laser, a 633 nm laser, or a combination of both, depending on the experimental detection design. Laser power: 20 mW. - Click “Data Recording”. The instrument will begin acquiring droplet fluorescence signals (Figure 3C).
NOTE: Collect fluorescence signals from 50,000 to 100,000 droplets; the instrument will automatically sort the signal values and generate a fluorescence signal histogram. - Based on the generated fluorescence signal histogram, set the sorting threshold to the top 0.1% of the total fluorescence signals, and collect droplets with fluorescence signal values above this threshold.
NOTE: In this case, the sorting gate was set to collect droplets with fluorescence intensity > 2750 (a.u.), which corresponded to the top 0.1% of droplets. - Click “Data Recording” again. The instrument will re‑record the fluorescence signals from the remaining droplets and sort the target droplets based on the threshold set in Section 7.10.
NOTE: The remaining droplet signals will also be automatically sorted and plotted as a fluorescence histogram. - After selecting the target droplet region, turn on the "Sorting Switch" and set the "Deflection Force" value. The equipment will start sorting droplets.
NOTE: The instrument provides three selectable electric field strength levels (High, Medium, Low). For droplets larger than 30 µm, select High; for droplets smaller than 25 µm, select Medium or Low. This ensures stable deflection and optimal sorting efficiency. - After the equipment stabilizes for 5 min, replace the collection vial to collect positive droplets.
NOTE: During sorting, the instrument continuously measures each droplet's fluorescence intensity in real time and compares it with the preset threshold. Only droplets with fluorescence intensity above the threshold are deflected and collected into the positive collection tube. A droplet is considered positive if the instrument displays a fluorescence signal exceeding the sorting threshold and, simultaneously, droplet deflection is observed in the imaging interface, confirming that the droplet has been successfully directed into the positive collection channel. - Stop droplet sorting after 4 h of stable operation. Click "Stop" in the "Droplet Sorting" interface.
- Gently remove the collection tube from the chip. Place the tube and collection vial vertically to ensure that the droplets in the tube enter the collection vial.
- After droplet collection is completed, click the scatter plot to save the scatter plot of the experiment, the fluorescence signal values of the sorted positive droplets, and the fluorescence signal values of all droplets.
- Remove the chip, oil phase inlet vial, sample vial, and reagent vial from the stage. Close the software.
- Droplet demulsification. Add 500 µL of 1H, 1H, 2H, 2H‑perfluorooctanol to the droplet collection tube. Wait for 5 min, then add 500 µL of fresh screening medium for recovery.
NOTE: Do not shake the collection tube vigorously after adding the demulsifier; mix gently. After droplet demulsification, a clear interface will form between the aqueous and oil phases. - Take 20 µL of the demulsified bacterial suspension, dilute it 10-fold, and spread it onto two agar plates. Incubate at 50 °C for 2 days.
NOTE: The dilution factor may be adjusted according to the number of collected droplets. In this case, approximately 400 single colonies were obtained from the two plates.
8. Data export
- Click on the fluorescence signal plot in the blank area of the software sorting interface. Select to save the droplet fluorescence signal scatter plot, the fluorescence signal histogram, and the fluorescence signal Excel spreadsheet, which contain the recorded fluorescence intensity values of the total number of droplets, as well as the fluorescence intensity values of the screened positive droplets.
9. Microplate primary screening
- Pick single colonies randomly.
- Inoculate the 24-well deep‑well plate for expansion culture. Pick each selected colony and inoculate it into one well of a 24‑well deep‑well plate containing 2 mL of fermentation medium. Use an inoculation loop.
- Seal the 24‑well deep‑well plate with a non‑breathable membrane.
NOTE: Do not use a breathable membrane. It causes evaporation of the culture medium. - Incubate the expansion culture. Place the sealed 24‑well deep‑well plate in a shaking incubator at 50 °C, 200 rpm for 24 h.
- Subculture for fermentation validation. After 24 h, transfer 200 µL of culture from each well into a fresh 24‑well deep‑well plate containing 1.8 mL of fermentation medium (10% v/v inoculum). Add sterile CaCO3 to a final concentration of 4% (w/v) to each well before inoculation to buffer the pH.
- Include controls. In each fresh 24‑well deep‑well plate, fill three randomly selected wells with the parental strain ATCC 7050 as negative controls. Process them identically to the candidate strains.
- Seal the 24‑well deep‑well plate with a non‑breathable membrane.
- Incubate the 24‑well deep‑well plate. Place the sealed plate in a shaking incubator at 50 °C, 200 rpm for 24 h.
- Prepare samples for lactate detection. Centrifuge the plate at 5,842 × g for 10 min. Transfer 10 µL of the supernatant to a 96‑well black microplate and dilute with 990 µL of ultrapure water. Mix well.
- Add the lactate sensor. Add 100 µL of the diluted sample to each well of a fresh 96‑well black plate. Then add 100 µL of the lactic acid sensor. Mix gently.
- Measure fluorescence. Incubate the plate at room temperature for 5 min (protected from light). Measure fluorescence using a microplate reader with excitation at 485 nm and emission at 515 nm.
- Set the hit‑selection threshold. Calculate the mean fluorescence of the three parental control wells (parent) and the standard deviation (SD_parent). Define the threshold as F_parent + 3 × SD_parent.
- Identify primary hits. A candidate strain is considered a primary hit if its fluorescence signal exceeds the threshold. Record the number of primary hits for downstream validation.
10. Secondary validation of high-yielding strains
CAUTION: The mobile phase contains dilute sulfuric acid (5 mM), which is corrosive. Avoid skin contact and inhalation. Wear appropriate personal protective equipment (gloves, lab coat, safety goggles). Prepare and handle the mobile phase in a well‑ventilated area or fume hood. Collect all acid‑containing waste in a dedicated acid‑waste container for proper disposal. Do not pour down the sink.
- Prepare the seed culture. Streak the primary hit strains onto the seed medium agar plates. Incubate at 50 °C for 24 h. Pick a single colony from each plate and inoculate it into 30 mL of liquid seed medium in a 250 mL shake‑flask. Incubate at 50 °C, 200 rpm for 12 h.
- Set up the fermentation. Prepare the fermentation medium and add sterile CaCO3 powder to a final concentration of 4% (w/v) as a pH-neutralizer. Transfer 5 mL of the seed culture into 45 mL of this medium in a 250 mL Erlenmeyer flask (10% v/v inoculum; final working volume 50 mL).
NOTE: Use three independent flasks for each candidate strain and for the parental strain ATCC 7050 as a control. - Incubate the flasks. Place the flasks in a shaking incubator at 50 °C, 200 rpm. Ferment for 24 h.
- Collect samples. After 24 h, take 1 mL of culture from each flask. Centrifuge at 13,800 × g for 2 min. Dilute the supernatant 100‑fold with ultrapure water and filter through a 0.22 µm syringe filter.
- Set up HPLC conditions. Use an Aminex HPX‑87H column. Prepare mobile phase: 5 mM H₂SO₄ in ultrapure water, filter through 0.22 µm membrane, and degas by sonication. Set column temperature to 40 °C, flow rate to 0.6 mL/min, injection volume to 20 µL, and run time to 20 min per sample (lactic acid elutes at ~12.600 min). Use a refractive index detector (RID).
- Prepare the standard curve. Dissolve calcium L‑lactate in ultrapure water to prepare standard solutions of 0, 0.4, 0.8, 1.2, and 1.6 g/L (expressed as calcium L‑lactate). Inject each standard in triplicate.
NOTE: Plot peak area against concentration and obtain the linear regression equation (R2 > 0.999). Run standards at the beginning and end of each sample batch to correct for drift. - Inject the samples. Inject the filtered fermentation supernatants (20 µL) into the HPLC system. Record the peak area for the calcium L‑lactate peak.
NOTE: Inject a quality control sample (1 g/L calcium L‑lactate) every 10 samples to monitor system stability. Acceptable retention time shift is <0.2 min and peak area variation <5% compared with the initial calibration standard. - Calculate the L‑lactic acid yield. Interpolate the peak area of each sample into the standard curve to obtain the calcium L‑lactate concentration (g/L).
NOTE: Convert to L‑lactic acid concentration using the molecular weight ratio:
 (3)
(3)
Compute the improvement percentage:
 (4)
(4) - Identify the final high‑yielding strains. Select the strains that consistently show higher L‑lactic acid yield than the parental strain as validated mutants. Choose the best performer for further characterization.
11. Genetic stability assessment of high‑yielding strains
- Streak the selected mutant strain onto seed medium agar plates. Incubate at 50 °C for 24 h. This is generation 1.
- Pick a single colony from the generation 1 plate and inoculate it into 5 mL of liquid seed medium in a 50 mL tube. Incubate at 50 °C, 200 rpm for 12 h to obtain the F1 seed culture.
- Transfer 10% (v/v) of the generation 1 seed culture into 50 mL of fermentation medium (containing 4% w/v sterile CaCO₃) in a 250 mL shake‑flask. Incubate at 50 °C, 200 rpm for 24 h.
- Collect 1 mL of culture after fermentation. Centrifuge at 13,800 × g for 2 min, dilute the supernatant 100-fold with ultrapure water, and measure L‑lactic acid concentration by HPLC. Use three independent flasks for each generation.
- To obtain the next generation, streak a loopful of the generation 1 culture onto a fresh seed medium agar plate. Incubate at 50 °C for 24 h. Repeat steps 11.2 and 11.3 for generation 2.
- Repeat the subculturing process to obtain generation 3 and generation 4. For each generation, prepare three shake‑flasks and measure lactic acid production by HPLC.
- Compare the yields of the four generations (1–4) using a one‑way ANOVA or Student’s t‑test. The strain is considered genetically stable if no significant difference (p > 0.05) in lactic acid production is observed among generations.
Access restricted. Please log in or start a trial to view this content.
Results
Based on the automated droplet microfluidic platform, a high‑throughput screening model was established. A mutant library of B. coagulans was constructed by ARTP mutagenesis with an optimal irradiation time of 20 s, which gave a lethality rate of approximately 90% (Figure 4A). The mutant cells were then encapsulated into droplets of 14 pL, approximately 30 µm in diameter, at a generation rate of 1500 Hz (Figure 4B). After incubation at 45 °C for 10 h, the sensor was...
Access restricted. Please log in or start a trial to view this content.
Discussion
This protocol presents a standardized workflow for industrial microbial screening based on an automated droplet microfluidic platform. The integrated workflow encompasses the construction of mutant libraries, droplet generation and single‑cell encapsulation, micro‑reactor cultivation, biosensor injection, fluorescence‑activated droplet sorting, and final validation of target strains. Using high‑throughput screening of a high‑yielding L‑lactic acid‑producing B. coagulans ...
Access restricted. Please log in or start a trial to view this content.
Disclosures
Xiaojie Guo and Liyan Wang are employees of Jiangsu TMAXTREE Biotechnology Co., Ltd., which manufactures the automated droplet microfluidic platform and microfluidic chips used in this study. The company declares that it has no competing interests in relation to this work and had no role in study design, data collection, analysis, interpretation, or manuscript preparation. The other authors declare no competing interests.
Acknowledgements
This work was supported by the Advanced Materials-National Science and Technology Major Project (Grant No. 2024ZD0603600). Additional support was provided by the Guangdong S&T Program (Grant No. 2024B1111130002).
Access restricted. Please log in or start a trial to view this content.
Materials
| Name | Company | Catalog Number | Comments |
|---|---|---|---|
| Agar | Becton, Dickinson and Company | 214030 | For solid plate preparation |
| Anhydrous Ethanol | Sinopharm Chemical Reagent Co., Ltd. | 10009218 | Wipe and disinfect laboratory benches and appliances |
| Atmospheric and Room Temperature Plasma (ARTP) | Jiangsu TMAXTREE Biotechnology Co., Ltd. | CP-002 | ARTP was employed to construct the mutant library for strain mutagenesis. |
| B. coagulans | Beijing Microbial Culture Collection Center, BMCC | 1511C0004000002355 | B. coagulans ATCC 7050 was used as the starting strain for mutagenesis and the target of high-throughput droplet screening. |
| Black microplate (96 well) | Corning | 3925 | The 96-well black microplate was used for lactate sensor assays and determination of lactic acid concentration. |
| Calcium carbonate | Sinopharm Chemical Reagent Co., Ltd. | 20011062 | To isolate L-lactic acid hyper-producers. |
| Calcium chloride | Sinopharm | 10005819 | Calcium chloride is used for the preparation of microbial culture medium, providing essential nutrients for microbial growth. |
| Calcium L-lactate | Sinopharm Chemical Reagent Co., Ltd. | 69027528 | Used as samples for standard curve preparation in the detection process. |
| Centrifuge tube (15 mL) | Beijing Xinhengyan Technology Co., Ltd | HB53397 | Used for bacterial liquid dilution |
| Collection tube | Jiangsu TMAXTREE Biotechnology Co., Ltd. | DREMcell-CL | For collecting droplets and subsequent cultivatio |
| Computer | Lenovo | E450 | Software installation and DREM Cell control. |
| DAPI | Solarbio | c0065 | For cell staining. |
| Deep-well plate (24-well) | BKMAMLAB | 110424008 | For the initial yield verification of B. coagulans mutants using deep-well plates |
| Demulsifier (1H,1H,2H,2H-Perfluorooctanol) | MACKLIN | H817022 | The droplet demulsifier is used to break the water-in-oil microdroplets and release the internal cells, strains or supernatant for subsequent detection and analysis. |
| D-Glucose | Solarbio | G8150-1000 | D-Glucose is used for the preparation of microbial culture medium, providing essential nutrients for microbial growth. |
| Diammonium hydrogen citrate | Solarbio | D9950 | Diammonium hydrogen citrate is used for the preparation of microbial culture medium, providing essential nutrients for microbial growth. |
| Dipotassium hydrogen phosphate anhydrous | Sigma-Aldrich | P8281 | Dipotassium hydrogen phosphate anhydrous is used for the preparation of microbial culture medium, providing essential nutrients for microbial growth. |
| DREM Software version | Jiangsu TMAXTREE Biotechnology Co., Ltd. | DREMcell v02.01.18 | For controlling DREM cell instrument.The DREM Software is a proprietary commercial program exclusively for the DREM Cell instrument by Jiangsu TMAXTREE Biotechnology Co., Ltd. It has no public official access or download URL and is only distributed with the instrument under authorization. |
| Droplet Entrapping Microfluidic Cell-sorter (DREM Cell) | Jiangsu TMAXTREE Biotechnology Co., Ltd. | CP-027 | It was used for high-throughput single-cell encapsulation and sorting to rapidly screen high-yield strains from the mutant library. |
| Droplet generation chip | Jiangsu TMAXTREE Biotechnology Co., Ltd. | HC-03-009 | The droplet generation chip is used to produce monodisperse picoliter (pL)-scale droplets for single-cell encapsulation. |
| Droplet injection chip | Jiangsu TMAXTREE Biotechnology Co., Ltd. | HC-03-003 | The droplet microinjection chip is used to achieve precise and trace reagent injection into preformed droplets for subsequent biochemical reactions. |
| Droplet sorting chip | Jiangsu TMAXTREE Biotechnology Co., Ltd. | HC-03-002 | The droplet sorting chip is used to sort target droplets containing high-yield cells based on fluorescence signals. |
| Erlenmeyer shake flask (250 mL) | Sichuan Shuniu Glass Instrument Co., Ltd. | B-001006 | Used for the scale-up culture verification of B. coagulans mutant strains after primary screening with deep-well plates, so as to confirm the stability and reproducibility of high-yield strains. |
| Filter Membranes (0.22 μm) | Merck | SLGPR33RB | Used for fermentation broth filtration. |
| Fluorescence inverted microscope | Olympus | IX73 | Olympus IX73 fluorescence inverted microscope was used to observe bacterial morphology within droplets |
| Fluorinated Oil | Bio-Rad | 1864006 | Fluorinated oil serves as the continuous phase in droplet microfluidics to generate stable, monodisperse, and non-interfering water-in-oil microdroplets, supporting single-cell culture and screening. |
| High Performance Liquid Chromatography column | Bio-Rad | Bio-Rad Aminex HPX-87 | It is used to separate lactic acid from other components in the fermentation broth according to their different retention properties, so as to realize the accurate quantitative detection of lactic acid. |
| High-Performance Liquid Chromatography | Shimadzu | 228-34001-02 | HPLC is used for the quantitative detection and analysis of L-lactic acid in fermentation samples. |
| Injection tube | Jiangsu TMAXTREE Biotechnology Co., Ltd. | DREMcell-1N | For injecting the oil phase, sample bacterial suspension, and reagent solution |
| Iron(III) sulfate heptahydrate | Iron(III) sulfate heptahydrate | Iron(III) sulfate heptahydrate | Iron(III) sulfate heptahydrate |
| Laminar flow hood | Shanghai SHP Instrument Equipment Co., Ltd | SP20230501 | Used for aseptic operation in the culture and fermentation of B. coagulans. |
| Magnesium sulfate heptahydrate | Sinopharm | 10013018 | Yeast Extract is used for the preparation of microbial culture medium, providing essential nutrients for microbial growth. |
| Manganese sulfate monohydrate | MACKLIN | M813856 | Manganese sulfate monohydrate is used for the preparation of microbial culture medium, providing essential nutrients for microbial growth. |
| Microplate reader | TECAN | TCAT92000001 | For fluorescence detection of lactate sensor-lactic acid mixture in microplates at 485/515 nm. |
| Mineral Oil | Jiangsu TMAXTREE Biotechnology Co., Ltd. | Miss cell-BOS-B | Used for liquid surface sealing to isolate air, prevent sample volatilization, oxidation and microbial contamination. |
| Multimeter | SNAKOL | SK-9205Pro | Its function is to test the electrical continuity of electrodes on the droplet injection chip and droplet sorting chip. |
| pBAD-eLACCO1.1 | Addgene | 167947 | The eLACCO1.1 lactate sensor enables real-time fluorescence-based quantification of L-lactic acid within microdroplets, permitting high-throughput screening of high-yield B. coagulans mutants. |
| Phosphate-Buffered Saline | Vazyme | G101 | Isotonic PBS buffer was injected to maintain a stable pH and osmotic environment within the droplets, thereby ensuring optimal performance of the lactate sensor and improving screening accuracy.PBS composition: 10 mM phosphate buffer, 137 mM NaCl, 2.7 mM KCl, pH 7.4 ± 0.1 (25 °C) |
| Shaker | Shanghai Zhichu Instrument Co., Ltd | 10240211 | Used for the culture and fermentation process of B. coagulans |
| Sodium acetate anhydrous | Solarbio | S5330 | Sodium acetate anhydrous is used for the preparation of microbial culture medium, providing essential nutrients for microbial growth. |
| Sodium chloride | Sinopharm | 10019318 | Sodium chloride is used for the preparation of microbial culture medium, providing essential nutrients for microbial growth. |
| Sulfuric acid | Sinopharm Chemical Reagent Co., Ltd. | 10021618 | Used for the fluidity test of droplets at a concentration of 5 mM. |
| Tryptone | Oxoid | LP0042 | Tryptone is used for the preparation of microbial culture medium, providing essential nutrients for microbial growth. |
| Ultra low temperature refrigerator | SANYO Ultra-low | MDF-U4086S | For strain preservation (-80 °C) |
| Ultrapure Water Purification System | Merck | 17100500 | Used for preparation of laboratory ultrapure water. |
| Yeast Extract | Oxoid | LP0021 | Yeast Extract is used for the preparation of microbial culture medium, providing essential nutrients for microbial growth. |
References
- Zeng W, et al. High-throughput screening technology in industrial biotechnology. Trends Biotechnol. 2020;38(8):888-906.
- Sarnaik A, et al. High-throughput screening for efficient microbial biotechnology. Curr Opin Biotechnol. 2020;64:141-150.
- Li Z-H, et al. The advances of strategies and technologies in high-throughput microbial culturomics. Biotechnol Adv. 2026;87:108783.
- Zhou S, Alper HS. Strategies for directed and adapted evolution as part of microbial strain engineering. J Chem Technol Biotechnol. 2019;94(2):366-376.
- Xu L, Guo M, Jiang D, Jiang J, Lu L. Advances in high-throughput mutation breeding systems integrating atmospheric and room-temperature plasma (ARTP) with droplet-based microfluidics. Microb Cell Fact. 2025;24:253.
- Picot J, et al. Flow cytometry: retrospective, fundamentals and recent instrumentation. Cytotechnology. 2012; 64(2):109-30 .
- Manohar SM, et al. Flow cytometry: principles, applications and recent advances. Bioanalysis. 2021;13(3):181-198.
- Cai Y, et al. Development of droplet-based microfluidics in generation, manipulation, and biomedical applications. Microchem J. 2025;211:113101.
- Wang J, et al. Repurposing conformational changes in ANL superfamily enzymes to rapidly generate biosensors for organic and amino acids. Nat Commun. 2023; 14(1):6680.
- Tu R, et al. Biosensor-enabled droplet microfluidic system for the rapid screening of 3-dehydroshikimic acid produced in Escherichia coli. J Ind Microbiol Biotechnol. 2020; 47(12):1155-1160.
- Li X, et al. FADS-Based Directed Evolution of a Robust Bst DNA Polymerase Adapting High-Temperature Loop-Mediated Isothermal Amplification (HT-LAMP). ACS Catal. 2025; 15(7):5391-5402.
- Nasu Y, et al. A genetically encoded fluorescent biosensor for extracellular L-lactate. Nat Commun. 2021;12:7058.
- Wei L, et al. Ultrahigh-throughput screening of antagonistic bacteria against Erwinia carotovora Ecc15 based on droplet microfluidics. Food Sci Hum Wellness. 2025;14(11):9250263.
- Li S, et al. Establishment of picodroplet-based co-culture system to improve erythritol production in Yarrowia lipolytica. Biochem Eng J. 2023;198:109036.
- Beneyton T, et al. High-throughput screening of filamentous fungi using nanoliter-range droplet-based microfluidics. Sci Rep. 2016;6:27223.
- He RL, et al. Ultra-high-throughput picoliter-droplet microfluidics screening of the industrial cellulase-producing filamentous fungus Trichoderma reesei. J Ind Microbiol Biotechnol. 2019;46(11):1603-1610.
- Zhang X, et al. Electrokinetic gated injection-based microfluidic system for quantitative analysis of hydrogen peroxide in individual HepG2 cells. Lab Chip. 2011;11(6):1144-1150.
- Agresti JJ, et al. Ultrahigh-throughput screening in drop-based microfluidics for directed evolution. Proc Natl Acad Sci USA. 2010;107(9):4004-4009.
- Abalde S, et al. High-throughput detection of ethanol-producing cyanobacteria in a microdroplet platform. J R Soc Interface. 2015; 12(106):20150216.
- Ostafe R, et al. Ultra-high-throughput screening method for the directed evolution of glucose oxidase. Chem Biol. 2014; 21(3):414–421.
- Chen YH, et al. Characterization of sensitivity and specificity in leaky droplet-based assays. Lab Chip. 2012;12(23):5093-5103.
- Greenwald EC, et al. Genetically encoded fluorescent biosensors illuminate the spatiotemporal regulation of signaling networks. Chem Rev.2018; 118(24):11707–11794.
- Li S, et al. Combining genetically encoded biosensors with droplet microfluidic system for enhanced glutaminase production by Bacillus amyloliquefaciens. Biochem Eng J. 2022;186:108586.
- Tellechea-Luzardo J, et al. Transcription factor-based biosensors for screening and dynamic regulation[J]. Front. Bioeng. Biotechnol., 2023, 11: 1118702.
Access restricted. Please log in or start a trial to view this content.
Reprints and Permissions
