This protocol describes stepwise procedures for evaluating whole-organism resistance to heat stress, oxidative stress, ER stress, and mitochondrial stress. It also provides methods to evaluate whether neurons play a role in stress resistance.
Method Article
Methods for Measuring Resistance to Multiple Stressors in Caenorhabditis elegans
In This Article
Summary
Abstract
Organisms are exposed to a variety of environmental and cellular stressors throughout their lives. The capability to resist different stressors closely correlates with organisms’ healthspan and lifespan. Caenorhabditis elegans (C. elegans) is an ideal model organism for stress resistance measurement to facilitate research of conserved molecular mechanisms underlying stress resistance. C. elegans also possesses a simplified nervous system fundamental to understanding the neural basis of stress resistance. Here, we present methods of measuring stress resistance of C. elegans under four different stress conditions: heat stress, endoplasmic reticulum (ER) stress, mitochondrial stress, and oxidative stress. Worm cohorts are placed on solid agar plates, and exposed to challenging temperatures for heat stress, or agar containing different doses of compounds inducing ER, mitochondrial, or oxidative stress. We have set up increasing doses of each stress and titrated the optimal dose to determine stress resistance differences in a RIC neuron-ablated strain compared to wild-type strain, as an example. Under stress conditions, C. elegans survival is monitored hourly or daily, and survival curves are plotted and compared to identify different capabilities of stress resistance in different C. elegans strains. These provide a reproducible approach for evaluating the resistance to multiple stressors over a range of doses and time scales in C. elegans of wild-type, mutants or neuron manipulated strains and also help uncover the molecular and neural mechanisms underlying multiple stressors.
Introduction
Organisms experience a variety of environmental stress throughout their lives. Most stressors, including heat, hypoxia, radiation, oxidative stress, osmotic stress, and pathogenic stress, cause cellular dysfunction and homeostasis imbalances that trigger intracellular stress responses. Organisms develop highly conserved stress response pathways to cope with dynamic environmental challenges and stressors. These conserved stress response pathways include heat shock responses (HSR)1, unfolded protein responses (UPR) in the endoplasmic reticulum (ER) and mitochondria2, and oxidative stress response3. Master regulators of different stress response pathways, usually transcription factors, induce the expression of responsive genes to restore proteostasis and promote cellular survival4. These responses include the synthesis of chaperones that re-fold misfolded proteins and the removal of damaged proteins by protein degradation4. Failure to activate stress responses results in accumulation of damaged proteins in cytoplasm or organelles, which leads to cellular and tissue dysfunction. Imbalanced cellular stress response has been associated with a variety of chronic diseases, ranging from neurodegeneration to metabolic syndrome5,6. In contrast, appropriate activation of stress response pathways leads to improved healthspan and substantial lifespan extension7. Therefore, it is important to investigate the molecular mechanisms of stress resistance to harness the protective stress response for health improvement. Thus, it is necessary to establish reproducible methods and techniques to precisely quantify stress resistance in live animals.
Discoveries in the past 15 years have shown a role of neural signaling in improving stress resistance across multiple species8. Initial findings showed that the HSR and ER UPR in neurons are sufficient to activate stress response in non-neuronal tissues, establishing the concept of cell non-autonomous regulation of stress resistance8,9,10. Since this initial discovery, mounting evidence has shown that multiple stress resistance pathways respond to environmental cues and promote stress resistance through neural signaling. Specifically, the HSR10,11, ER UPR12,13, mitochondrial unfolded protein response (UPRmt) 14,15, and oxidative stress response3, each promotes stress resistance cell non-autonomously through neurons. The mechanism of cell non-autonomous regulation of stress resistance is conserved across organisms including the fruit fly D. melanogaster16,17,18,19 and mice20,21.
To facilitate research studying neurons’ role in stress resistance under multiple stressors, here we present a systematic protocol to test resistance under four neuronally regulated stressors: heat stress, ER stress, mitochondrial stress, and oxidative stress. C. elegans, a tractable model organism, was used to measure stress resistance to these four stressors. Using C. elegans in stress resistance assays not only allows studying the activation of stress responses at the cellular level, but also at the organismal level.
The stress response pathways activated by heat stress, ER stress, mitochondrial stress, and oxidative stress are conserved and functionally important across organisms including humans22,23,24,25. Heat stress leads to protein misfolding and aggregation and activates the heat shock response, which is vital for maintaining protein homeostasis26. C. elegans physiological environmental temperature is 20 °C and warmer temperature above 25 °C induces heat stress in C. elegans27. We induce heat stress under three elevated challenging temperatures 30 °C, 35 °C, and 37 °C.
ER is the primary site for protein synthesis and folding28. The accumulation of unfolded or misfolded proteins within the ER lumen activates unfolded protein responses to restore proteostasis29. ER stress can be induced by a chemical, tunicamycin, which blocks N-linked glycosylation and causes the accumulation of misfolded proteins in the ER lumen30. Increased resistance to the protein misfolding stress in the ER lumen shows an increased survival12. We expose worms to different doses of tunicamycin (25–200 µg/mL) and evaluate their sensitivity by measuring their survival.
Mitochondria are the cellular metabolic center and the "powerhouses" of the cell. Reactive oxygen species (ROS) and unfolded proteins in the mitochondria trigger mitochondrial unfolded protein responses and induce mitochondrial stress31. Mitochondrial stress can be induced by antimycin A, a mitochondrial complex III inhibitor which blocks electron transfer and causes ROS production32. We use different doses of antimycin A (5–80 µg/mL) to identify an optimal dose for the mitochondrial stress resistance assay.
Oxidative stress is usually induced by environmental toxins and metabolism-produced cellular free radicals. Oxidative stress causes damage to proteins, lipids, and DNA across all organisms33. Paraquat, an herbicide chemical which transfers electrons to oxygen and generates excessive amount of superoxide radicals, is a strong inducer of oxidative stress34. We apply four increasing doses of paraquat (2.5–20 mM) and show a range of maximal survival encompassing 3 to 12 days in C. elegans.
These four stress conditions are straightforward to produce highly reproducible results of stress resistance in C. elegans. Stress resistance methods have been reported previously35,36,37,38,39,40. Compared to a previously published review summarizing different stressors and survival analyses35, this article established detailed feasible stepwise protocols to perform reproducible and consistent stress assays. Several previously published protocols focused on one specific stress assay, such as heat shock36 or oxidative stress38; whereas this protocol demonstrates all four different stress assays of heat, ER, mitochondrial, and oxidative stress. Previously reported stress assay protocols also present a different end-point assay of fluorescent reporters, such as pathway-specific fluorescent transcriptional reporters for ER, mitochondrial, and oxidative stress40, or heat shock response39; whereas this protocol uses survival assays to effectively measure the overall health of C. elegans. Importantly, this protocol presented dosage titration of all four assays to provide references of the effective dose range that could be selected for stress assays; this protocol optimized the time scale (from hours to days) in different stress assays; in addition, we presented a novel role of a neuron regulating multiple stress responses, as an example to test whether neurons regulate stress resistance.
Developing a stress resistance assay requires selecting an appropriate stressor and a reliable assessment metric. C. elegans survival assays have been powerful tools for measuring physiological processes, including lifespan, stress resistance, and pathological infections. One key advantage of using C. elegans for survival assays is that synchronized worms of the same age are simple to prepare and assay, due to their self-fertilization, large brood size, and short developmental cycle of three days from eggs to young adults. Males are rare in a natural population of cultured C. elegans and are therefore not generally used for survival assays, including this protocol, and are mostly used for genetic crosses35. Compared to other endpoint evaluation methods (e.g., fluorescent reporters, protein and lipid accumulation), survival assays are effective in measuring the overall health of C. elegans and take a relatively short time to complete, usually from hours to several weeks depending on the dose of stressors. We utilize survival rates as the primary indicator of stress resistance across different strains of C. elegans. Survival is determined by motility and response to gentle mechanical stimulation; a lack of response to stimulation is used to define mortality in C. elegans stress assays. Survival assays in C. elegans can be performed either in solid or liquid media with bacterial food35. However, the liquid media is not the natural habitat of worms, and worms are forced to constantly thrash in the liquid culture which leads to a shorter survival curve41. Here, we use the solid media to assess the effects of different stressor concentrations on the survival of wild-type and neuron-ablated mutant worms. These concentration-titration data may provide guidance for other researchers performing comparable stress-resistance assays.
Protocol
Experiments involving C. elegans were conducted at Kansas State University, Manhattan, KS, USA, in accordance with institutional biosafety and laboratory guidelines. As C. elegans is an invertebrate model organism, vertebrate animal ethics committee approval was not required for this study. The details of all the reagents, equipment, software, and strains used are listed in the Table of Materials.
1. Make NGM (Nematode Growth Medium) plates and prepare Escherichia coli OP50
- Make NGM plates
- Weigh 3 g of NaCl, 17 g of Agar (powdered), and 2.5 g of Peptone, add 900 mL ultrapure deionized (dd) H2O and bring it to 1 L final volume, and sterilize by autoclaving. Cool the medium down to approximately 60 °C in a 60 °C water bath.
- Add 1 mL of 1 M CaCl2 (prepared in ddH2O and filter-sterilized), 1 mL of 5 mg/mL cholesterol (prepared in ethanol and filter-sterilized), 1 mL of 1 M MgSO4 (prepared in ddH2O and filter-sterilized), and 25 mL of 1 M KP Buffer.
To make KP Buffer, combine 130 mL of 1 M K2HPO4 with 870 mL of 1 M KH2PO4 prepared in ddH2O. After mixing thoroughly, adjust pH to 6.0. After preparation, the measured pH is typically close to 6.0 and no additional adjustment is necessary. The acceptable pH range for the KP buffer is 5.8–6.2, with a target pH of 6.0. Verify that the final pH is approximately 6.0 before use. If necessary, adjust to pH 6.0 using 1 M K2HPO4 or 1 M KH2PO4. - Mix thoroughly and pour the medium (NGM) into plates (petri dishes). For 60 mm plates, pour 10 mL of NGM medium per plate; for 35 mm plates, pour 3 mL of NGM medium per plate. Leave the NGM agar plates at room temperature (22–25 °C) on a flat bench for at least 24 h before seeding bacterial food.
CAUTION: When preparing and pouring molten NGM agar, use heat-resistant gloves and appropriate laboratory PPE to prevent burns and exposure to hot liquid.
- Prepare Escherichia coli OP50 bacteria food for Caenorhabditis elegans
- Streak Escherichia coli OP50 bacteria onto a Luria-Bertani (LB) agar plate and incubate at 37 °C overnight (LB agar plates: add 1 g of NaCl, 1 g of tryptone, 0.5 g of yeast extract and 1.5-2.0 g of agar powder to 100 mL of ddH2O, sterilize by autoclaving for 20 min, cool to 50-60 °C and pour the medium into plates. Place on a clean, flat bench and allow to dry).
- Inoculate a single colony into a 100 mL liquid LB medium (LB medium: add 1 g of NaCl, 1 g of tryptone and 0.5 g of yeast extract to 100 mL of ddH2O, sterilize by autoclaving for 20 min. Cool to below 37 °C before inoculation).
- Culture the bacteria in a 37 °C shaking incubator until the bacterial suspension reaches an optical density at 600 nm (OD600) of about 0.3 in a 10-fold dilution of the bacterial suspension (100 µL of bacteria suspension mixing with 900 µL of LB medium). Harvest and store the bacteria suspension at 4 °C. The bacterial food can be stored for up to one week before seeding on an NGM plate40.
- Use a repeat pipettor to seed OP50 bacteria onto the NGM plates. Seed 200 µL for 60 mm agar plates, and 100 µL for 35 mm agar plates. Leave the seeded NGM plates at room temperature (~22–25 °C) on a flat bench for at least 24 h before use. Do not leave the plates at room temperature for longer than 48 h. Arrange the seeded plates in a clean plastic box and store them at 4 °C.
NOTE: If using non-vented plates, the seeded OP50 may need longer to dry.
CAUTION: Handle E. coli OP50 cultures using appropriate microbiological practices and wear a laboratory coat, gloves, and eye protection. Disinfect work surfaces and dispose bacterial waste according to institutional biosafety procedures.
2. Maintenance and synchronization of C. elegans
Workflow of this section is summarized in Figure 1A.
- Maintain worms at 20 °C on NGM plates seeded with OP50 by transferring adults to new OP50-seeded NGM plates twice a week to avoid starvation of the worms. Place 20–40 gravid adult worms onto a fresh OP50-seeded NGM plate using a platinum wire pick, and remove any larvae and eggs that are transferred with the gravid adults from the original plate. Using a known number of gravid worms facilitates accurate record-keeping and ensures complete removal of them in the later step (section 1.2).
NOTE: A total of 20–40 gravid worms is sufficient to produce 80–120 eggs in 2 h, based on the condition of a wild type strain (N2). Egg-lay is in its optimal window when gravid adults are on the first day (day 1) of adulthood. For strains with lower or higher fecundity, adjust the number of gravid worms accordingly. The goal of this step is to obtain sufficient eggs that will develop into synchronized worms for subsequent stress assays. - After approximately 2 h, remove gravid worms from the plate. Count the number of gravid worms that are removed in this step and confirm that all 20–40 gravid worms placed on the plate are removed.
- Incubate plates containing eggs at 20 °C until worms reach the late L4 stage for stress assays. Synchronize worms to the L4 stage to minimize variability introduced by differences in adult age and reproductive status12,35,37,38,40,42,43. At 20 °C, worms reach the uniformly synchronized late L4 stage approximately 54–58 h after eggs are laid on solid agar plates in the wild-type strain (Our observation and 36,40).
NOTE: For developmentally delayed strains, adjust the timing of synchronization to the late L4 stage according to their specific developmental rates.
CAUTION: Handle C. elegans using appropriate microbiological practices and wear a laboratory coat and gloves to minimize exposure to biological material and prevent contamination.
3. Stress condition and data collection
- Heat stress assay
Workflow of this section is summarized in Figure 1B.- Synchronize the worms to the late L4 stage (section 2) and maintain them at 20 °C. Transfer the synchronized L4-stage worms onto 35 mm OP50-seeded NGM plates (section 1), using 4 plates per group as technical replicates, with 30–35 worms per plate. Refer to section 4 for biological replicates setup.
- Place the plates with the late L4 stage worms into a 30, 35 or 37 °C incubator. Ensure that the incubator reaches the set temperature before the plates with assayed worms are placed inside. The mean survival of wild-type worms under 30, 35, or 37 °C ranges from about 4 h to 3 days (Figure 2B–D) compared to a physiologically non-stressed mean survival of about 20 days (Figure 2A).
CRITICAL STEP: Place all assay plates agar-side down as a single layer in the 35 °C incubator to allow rapid and uniform temperature equilibration.
NOTE: During heat stress assays at 30, 35, or 37 °C, most worms do not lay eggs. In the rare cases in which eggs are laid, none of the eggs are observed to hatch. Therefore, transferring worms to fresh plates is not necessary. - Score the number of dead worms at each time point of each technical replicate plate and record the number on a scoring data sheet. Worm survival is scored every hour under 35 °C or 37 °C heat stress and once daily under 30 °C heat stress. Scoring is performed under a dissecting microscope at room temperature. During scoring, remove only the plate being examined from the incubator; all other plates should remain at the designated heat stress temperature to minimize interruption of the heat stress exposure. This practice helps maintain consistent experimental conditions across all samples.
CRITICAL STEP: To minimize interruption of heat stress exposure, keep each plate out of the incubator for no more than 3 min during each scoring session. Depending on worm survival at different time points during the stress assay, scoring a plate at room temperature typically takes approximately 30 s to 3 min. The order of scoring matters considering the time spent on manual scoring. We recommend an order for scoring one technical replicate from each condition until all technical replicates are completed in all conditions. For example, in three conditions/groups (A, B, and C) with 4 technical replicate plates, arrange the scoring order as: A1, B1, C1 → A2, B2, C2 → A3, B3, C3 → A4, B4, C4. - Assess worm survival based on whether any movement response to gentle physical stimulation can be observed. Actively moving worms are scored alive, and no physical stimulation is needed. For worms that do not exhibit spontaneous movement, gently stimulate the worms by touching the posterior body region with a platinum wire pick twice. Lack of a movement response is recorded as death and the dead worm is removed from the plate after being recorded. Approximately 2 s of observation after each touch is sufficient to determine whether a movement response is present. A hand tally counter is recommended to record the number of live and dead worms during counting and to reduce counting errors. To ensure that all worms are counted once and not repeatedly, place a gridded transparent plastic sheet under the plate, or draw a grid on the bottom of the plate to divide the plates into grid sections for counting.
NOTE: Return plates to the heat condition incubator immediately after scoring. - Monitor worm survival at regular intervals until all animals are dead or censored according to the predefined criteria. Compile the recorded survival data and use them to generate survival curves for subsequent analysis.
- ER stress assay
Workflow of this section is summarized in Figure 1C.- Make ER stress assay medium plates. Add tunicamycin stock solution (10 mg/mL in dimethyl sulfoxide (DMSO), stored at –20 °C) into the liquid NGM medium (from section 1.1.2) to a final concentration of 25, 50, 100, or 200 µg/mL. For example, for 1 L ER stress assay medium, add 2.5, 5, 10, or 20 mL tunicamycin stock solution (10 mg/mL in DMSO) to achieve a final concentration of 25, 50, 100, or 200 µg/mL tunicamycin in the medium plates. If non-treated control is included in the assay, add the same amount of DMSO (2.5, 5, 10, or 20 mL) to the corresponding control medium.
CRITICAL STEP: Cool the autoclaved NGM medium to approximately 55 °C while stirring and add tunicamycin to the desired final concentration. Mix thoroughly before pouring 3 mL of the NGM medium with tunicamycin into each 35 mm plate. Seed each 35 mm agar plate with 100 µL OP50 bacteria (section 1.2). OP50-seeded NGM plates with tunicamycin can be stored at 4 °C for up to one week before use.
CAUTION: Tunicamycin is hazardous and must be handled in a chemical fume hood while wearing a laboratory coat, gloves, and eye protection. Avoid inhalation and skin or eye contact. - Synchronize the worms to the late L4 stage (section 2) and maintain them at 20 °C. Transfer the synchronized L4-stage worms onto 35 mm OP50-seeded NGM plates containing tunicamycin, using 4 plates per group as technical replicates, with 30–35 worms per plate. Refer to section 4 for biological replicates setup.
- Incubate all plates at 20 °C. Record the number of dead worms daily. The mean survival of wild-type worms under 25, 50, 100 or 200 µg/mL tunicamycin ranges from about 8 to 11 days (Figure 2E,F) compared to a physiologically non-stressed mean survival of about 20 days (Figure 2A).
NOTE: In tunicamycin-induced ER stress assay, there are eggs laid, but they do not hatch on tunicamycin containing agar plates. Therefore, transferring worms to fresh plates is not necessary. - Score the number of dead worms on each technical replicate plate every day and record the number on a scoring data sheet. Scoring is performed manually under a dissecting microscope on the bench at room temperature. Actively moving worms are scored alive and no physical stimulation is needed. For worms that do not exhibit spontaneous movement, gently stimulate the worms by touching the posterior body region with a platinum wire pick twice. Lack of response is recorded as death and the dead worm is removed from the plate after being recorded. A hand tally counter is recommended to ensure accurate counting. To ensure all worms are counted once and not repeatedly, place a gridded transparent plastic sheet under the plate, or draw a grid on the bottom of the plate to divide the plates into grid sections for counting.
NOTE: Return plates to the incubator immediately after scoring. Keep the worms in the incubator for approximately 24 h before the next scoring. - Monitor worm survival daily until all animals are dead or censored according to the predefined criteria. Compile the recorded survival data and use them to generate survival curves for subsequent analysis.
- Make ER stress assay medium plates. Add tunicamycin stock solution (10 mg/mL in dimethyl sulfoxide (DMSO), stored at –20 °C) into the liquid NGM medium (from section 1.1.2) to a final concentration of 25, 50, 100, or 200 µg/mL. For example, for 1 L ER stress assay medium, add 2.5, 5, 10, or 20 mL tunicamycin stock solution (10 mg/mL in DMSO) to achieve a final concentration of 25, 50, 100, or 200 µg/mL tunicamycin in the medium plates. If non-treated control is included in the assay, add the same amount of DMSO (2.5, 5, 10, or 20 mL) to the corresponding control medium.
- Mitochondrial stress assay
Workflow of this section is summarized in Figure 1D.- Make mitochondrial stress assay medium plates. Add antimycin A stock solution (5 mg/mL in DMSO, stored at –20 °C) into the liquid NGM medium (from section 1.1.2) to a final concentration of 5, 10, 20, 40, or 80 µg/mL. For example, for 1 L mitochondrial stress assay medium, add 1, 2, 4, 8, or 16 mL antimycin A stock solution (5 mg/mL in DMSO) for a final concentration of 5, 10, 20, 40, or 80 µg/mL antimycin A in the medium plates. If non-treated control is included in the assay, add the same amount of DMSO (1, 2, 4, 8, or 16 mL) to the corresponding control medium.
CRITICAL STEP: Cool the autoclaved NGM medium to approximately 55 °C while stirring and add antimycin A to the desired final concentration. Mix thoroughly before pouring 3 mL of the NGM medium with antimycin A into each 35 mm plate. Seed each 35 mm agar plate with 100 µL OP50 bacteria (section 1.2). OP50-seeded NGM plates with antimycin A can be stored at 4 °C for up to one week before use.
CAUTION: Antimycin A is hazardous and must be handled in a chemical fume hood while wearing a laboratory coat, appropriate gloves, and eye protection. Avoid inhalation and skin or eye contact. - Synchronize worms to the late L4 stage (section 2) and maintain them at 20 °C. Transfer the synchronized L4-stage worms onto 35 mm OP50-seeded NGM plates containing antimycin A, using 4 plates per group as technical replicates, with 30–35 worms per plate. Refer to section 4 for biological replicates setup.
- Incubate all plates at 20 °C. Record the number of dead worms daily.
CRITICAL STEP: Due to egg hatching and larvae development issues, transfer worms to fresh plates every two days during the first 10 days. Stop transferring when no new larvae or eggs are further observed on the plate. All the technical replicates should undergo the same number of transfers. For example, when only one plate requires transfer, all plates in this biological replicate need to be transferred at the same time. The mean survival of wild-type worms under 5, 10, 20, 40, or 80 µg/mL antimycin A ranges from about 1.5 to 5 days (Figure 2G,H) compared to a physiologically non-stressed mean survival of about 20 days (Figure 2A).
NOTE: Antimycin A-induced mitochondrial stress assay requires the transferring of worms to fresh plates every two days during the first 10 days. Transferring is performed to prevent crowding and starvation and to distinguish the experimental worms from their progeny. - Score the number of dead worms on each technical replicate plate every day and record the number on a scoring data sheet. Scoring is performed manually under a dissecting microscope on the bench at room temperature. Actively moving worms are scored alive and no physical stimulation is needed. For worms that do not exhibit spontaneous movement, gently stimulate the worms by touching the posterior body region with a platinum wire pick twice. Lack of response is recorded as death and the dead worm is removed from the plate after being recorded. A hand tally counter is recommended to ensure accurate counting. To ensure all worms are counted once and not repeatedly, place a gridded transparent plastic sheet under the plate, or draw a grid on the bottom of the plate to divide the plates into grid sections for counting.
NOTE: Return worms to the incubator immediately after scoring. Keep the worms in the incubator for approximately 24 h before the next scoring. - Monitor worm survival daily until all animals are dead or censored according to the predefined criteria. Compile the recorded survival data and use them to generate survival curves for subsequent analysis.
- Make mitochondrial stress assay medium plates. Add antimycin A stock solution (5 mg/mL in DMSO, stored at –20 °C) into the liquid NGM medium (from section 1.1.2) to a final concentration of 5, 10, 20, 40, or 80 µg/mL. For example, for 1 L mitochondrial stress assay medium, add 1, 2, 4, 8, or 16 mL antimycin A stock solution (5 mg/mL in DMSO) for a final concentration of 5, 10, 20, 40, or 80 µg/mL antimycin A in the medium plates. If non-treated control is included in the assay, add the same amount of DMSO (1, 2, 4, 8, or 16 mL) to the corresponding control medium.
- Oxidative stress assay
Workflow of this section is summarized in Figure 1E.- Make oxidative stress assay medium plates. Add paraquat stock solution (0.5 M in ddH2O, stored at –20 °C) into the liquid NGM medium (from section 1.1.2) to a final concentration of 2.5, 5, 10, or 20 mM.
CRITICAL STEP: Cool the autoclaved NGM medium to approximately 55 °C while stirring and add paraquat to the desired final concentration. Mix thoroughly before pouring 3 mL of the NGM medium with paraquat into 35 mm plates. Seed each 35 mm agar plate with 100 µL OP50 bacteria (section 1.2). OP50 bacteria may be seeded 2–3 days before the assay time. OP50-seeded NGM plates with paraquat can be stored at 4 °C for up to one week before use.
CAUTION: Paraquat is highly toxic and must be handled in a chemical fume hood with appropriate gloves, a laboratory coat, and eye protection. Avoid inhalation, ingestion, and skin or eye contact. - Synchronize worms to the late L4 stage (section 2) and maintain them at 20 °C. Transfer the synchronized L4-stage worms onto 35 mm OP50-seeded NGM plates containing paraquat, using 4 plates per group as technical replicates, with 30–35 worms per plate. Refer to section 4 for biological replicates setup.
- Incubate all plates at 20 °C. Record the number of dead worms daily. The mean survival of wild-type worms under 2.5, 5, 10 or 20 mM paraquat ranges from about 2.5 to 5 days (Figure 2I,J), compared to a physiologically non-stressed mean survival of about 20 days (Figure 2A).
NOTE: In paraquat-induced oxidative stress assay, transferring worms to fresh plates is not necessary. A limited number of larvae are present on the paraquat plates and are arrested at the developmental stage at or before the L2 stage throughout the assay. They do not interfere with the identification of synchronized cohorts or cause starvation. Considering the physical stress that may be introduced by worm transfer, it is not recommended to transfer worms during the assay. - Score the number of dead worms on each technical replicate plate every day and record the number on a scoring data sheet. Scoring is performed manually under a dissecting microscope on the bench at room temperature. Actively moving worms are scored alive and no physical stimulation is needed. For worms that do not exhibit spontaneous movement, gently stimulate the worms by touching the posterior body region with a platinum wire pick twice. Lack of response is recorded as death and the dead worm is removed from the plate after being recorded. A hand tally counter is recommended to ensure accurate counting. To ensure all worms are counted once and not repeatedly, place a gridded transparent plastic sheet under the plate, or draw a grid on the bottom of the plate to divide the plates into grid sections for counting.
NOTE: Return worms to the incubator immediately after scoring. Keep the worms in the incubator for approximately 24 h before the next scoring. - Monitor worm survival daily until all animals are dead or censored according to the predefined criteria. Compile the recorded survival data and use them to generate survival curves for subsequent analysis.
- Make oxidative stress assay medium plates. Add paraquat stock solution (0.5 M in ddH2O, stored at –20 °C) into the liquid NGM medium (from section 1.1.2) to a final concentration of 2.5, 5, 10, or 20 mM.
4. Data analysis
- Record the number of dead worms on each technical replicate plate at each time point. Mortality data are recorded in a scoring sheet organized by time point (hours or days after the initiation of the stress condition), experimental group (different strains or different treatment conditions), and technical replicate (plate 1, 2, 3, or 4). At each scoring interval (hourly or daily, depending on the assay), the number of dead worms is recorded separately for each plate, and cumulative mortality is tracked until the assay is complete.
- Enter the mortality data from each scoring time point into OASIS 2 (online application for survival analysis 2)44 for Kaplan–Meier survival curve generation and log-rank statistical analysis. Alternatively, mortality can be calculated as the percentage of dead worms at individual time points and compared between groups using an unpaired two-tailed Student's t-test (for two groups) or one-way ANOVA followed by Tukey's multiple-comparisons test (for three or more groups).
NOTE: Worms exhibiting rupture or matricidal hatching (bagging) are scored as dead at the time they are observed to reflect overall survival. Ruptured worms and bagged worms were included in the reported survival curves in the representative results below. The numbers of censored worms from different conditions were recorded in Supplementary Table 1. Worms that escape from the assay plate, desiccate on the wall of the plate, or are missing during scoring are treated as censored observations and excluded from subsequent survival analysis. Animals displaying impaired movement but exhibiting a response to gentle touch are scored as alive. Worms exhibiting egg-laying defects before the start of the assay are excluded from the survival analysis. - Perform all stress assays in at least three independent biological replicates conducted on different days. Each biological replicate consists of four technical replicate plates with worms. Data from the technical replicates within a biological replicate are pooled to generate a single survival curve. Independent biological replicates are analyzed separately and presented as individual datasets rather than pooled. Each biological replicate is performed using independently prepared media and fresh batches of stress-inducing compounds. The protocols described above are steps to generate one biological replicate for each stress assay. Males are excluded and only hermaphrodites are included and analyzed in this protocol.
NOTE: Humidity of the incubators in this protocol is not controlled, while incubator temperature is strictly controlled to the experimental temperature. The experiments reported here were not performed under blinded conditions, and the experimenter was aware of the genotype and treatment conditions during scoring. Blinding of genotype and treatment conditions is recommended when feasible to minimize potential scoring bias.
Results
Using the protocols described above, we first used wild-type (WT) N2 worms to examine worm survival under a range of increasing doses of all four stressors: heat, ER, mitochondrial, and oxidative stress. We next used a neuron ablation strain to test the role of an interneuron RIC in stress resistance compared to WT worms.
Titrating heat stress dosage and comparing heat stress resistance in the RIC ablation strain
Under the physiological temperature of 20 °C, WT worms live a mean lifespan of 20.67 days (Figure 2A). Following the heat stress assay steps presented in section 3.1, we measured WT survival under elevated temperatures of 30, 35, and 37 °C as increasing doses of heat stress. The data showed that WT worms live a mean lifespan of 3.11 days at 30 °C (Figure 2B); and WT worms live a mean survival of 5.36 h at 35 °C and 4.89 h at 37 °C (Figure 2C). These results indicated significantly decreased survival under higher temperatures. Statistical analyses and P values are presented in detail in Supplementary Table 2 and figure legends. This data provides reliable information for researchers to choose an optimal stress temperature and time scale in designing a heat stress assay. Researchers may use 30 °C to examine worms’ survival over several days while using 35 °C or 37 °C to achieve a faster assessment of worm survival within several hours.
We next used 35 °C as the heat stress condition to evaluate the effect of RIC neuron ablation on survival compared with WT animals. This temperature provides an intermediate level of heat stress, avoiding the extreme severity of 37 °C while producing a more robust response than 30 °C, and results in a complete survival assay within approximately 12 h.
RIC neurons are a pair of octopaminergic interneurons that are located in the head region of C. elegans9,10. RIC neuron-ablated strain was generated by expressing caspase-3 gene driven by tbh-1 gene promoter and was used previously45. Briefly, tbh-1 promoter was constructed into mec-18p::caspase-3 (p12)::nz and mec-18p cz::caspase-3 (p17) donor plasmids to replace mec-18 promoter. Three constructs tbh-1p::caspase-3(p12)::nz (20 ng/µL), tbh-1p::cz::caspase-3(p17) (20 ng/µL), and tbh-1p::GFP (20 ng/µL, as a marker of RIC neurons to indicate whether RIC neurons are ablated) were co-injected with the fluorescent co-injection marker myo-3p::GFP (5 ng/µL) into the wild-type N2 strain to generate RIC genetic ablation strains. Three independently injected lines were maintained as RIC neuron ablation strain. Transgenic lines were maintained by selecting the worms with the fluorescent myo-3p::GFP marker. Results from each stress assay were validated by two or three independent lines. Successful ablation of the RIC neurons was verified by the absence of tbh-1p::GFP fluorescence in the RIC neuron-ablated strain, whereas GFP expression was observed in the RIC neurons of the tbh-1p::GFP reporter control strain (Supplementary Figure 1).
Using the heat stress assay steps presented in section 3.1, we examined the survival of both WT and RIC neuron-ablated strains under 35 °C heat stress (Figure 2D). Using the steps of Data analysis presented in section 4.1–4.3, the results showed that no significant difference was found between RIC neuron-ablated strain and the wild-type N2 control group under 35 °C heat stress (Figure 2D).
All representative results from heat stress assays were performed with three independent biological replicates conducted on different days (Supplementary Figure 2). Animal number (n value indicated in the figure legends) contributing to the survival curve shown in the representative results and the supplementary figures is the pooled number from the four technical replicates in a single biological replicate.
Titrating ER stress dosage and comparing ER stress resistance in the RIC ablation strain
Using the ER stress assay steps presented in section 3.2, we measured WT survival under 25, 50, 100 or 200 µg/mL tunicamycin as increasing doses of ER stress (Figure 2E). Compared to a physiologically non-stressed mean survival of about 20 days (Figure 2A), the mean survival of wild-type worms is 10.74 days at 25 µg/mL, 9.13 days at 50 µg/mL, 9.3 days at 100 µg/mL, and 8.93 days at 200 µg/mL tunicamycin (Figure 2E). The dose increase of tunicamycin did not change the survival under these doses significantly. Statistical analyses and P values are presented in detail in Supplementary Table 2 and figure legends. This data provides reliable information for researchers to choose an optimal tunicamycin dose in an ER stress assay.
We next used 50 µg/mL tunicamycin, an intermediate dosage among the tested doses, as the ER stress condition to evaluate the effect of RIC neuron ablation on survival compared with WT animals. Using the ER stress assay steps presented in section 3.2, we examined the survival of both WT and RIC neuron-ablated strains under 50 µg/mL tunicamycin-induced ER stress (Figure 2F). Using the steps of Data analysis presented in section 4.1–4.3, the survival curve of the RIC neuron-ablated strain exhibited a significant rightward shift relative to the WT N2 control, indicating prolonged survival under ER stress. This result suggests that ablation of RIC neurons enhances ER stress resistance (Figure 2F).
All representative results from ER stress assays were performed with three independent biological replicates conducted on different days (Supplementary Figure 3). Animal number (n value indicated in the figure legends) contributing to the survival curve shown in the representative results and supplementary figures is the pooled number from the four technical replicates in a single biological replicate.
Titrating mitochondrial stress dosage and comparing mitochondrial stress resistance in the RIC ablation strain
Using the mitochondrial stress assay steps presented in section 3.3, we measured WT survival under 5, 10, 20, 40, or 80 µg/mL antimycin A as increasing doses of mitochondrial stress (Figure 2G). The survival curves of WT worms showed significant changes in a dose-dependent manner. Compared to a physiologically non-stressed mean survival of about 20 days (Figure 2A), the mean survival of wild-type worms is 4.96 days at 5 µg/mL, 3.77 days at 10 µg/mL, 2.68 days at 20 µg/mL, 1.65 days at 40 µg/mL, and 1.4 days at 80 µg/mL antimycin A (Figure 2G). Statistical analyses and P values are presented in detail in Supplementary Table 2 and figure legends. This data provides reliable information for researchers to choose an optimal antimycin A dose and time scale in designing a mitochondrial stress assay. Researchers may choose 5 µg/mL to assess worm survival over approximately 10 days, or use higher antimycin A concentrations to obtain survival outcomes within several days. Note that higher concentrations accelerate mortality, and lower concentrations produce a more gradual decline in survival, allowing subtle differences between strains to be more readily distinguished.
We next used 5 µg/mL antimycin A, which produced a more gradual decline in survival among the tested doses, as the mitochondrial stress condition to evaluate the effect of RIC neuron ablation on survival compared with WT animals. Using the mitochondrial stress assay steps presented in section 3.3, we examined the survival of both WT and RIC ablated strains under 5 µg/mL antimycin A-induced mitochondrial stress (Figure 2H). Using the steps of Data analysis presented in section 4.1–4.3, the survival curve of the RIC neuron-ablated strain exhibited a significant rightward shift relative to the WT N2 control, indicating prolonged survival under mitochondrial stress. This result suggests that ablation of RIC neurons enhances mitochondrial stress resistance (Figure 2H).
All representative results from mitochondrial stress assays were performed with three independent biological replicates conducted on different days (Supplementary Figure 4). Animal number (n value indicated in the figure legends) contributing to the survival curve shown in the representative results and supplementary figures is the pooled number from the four technical replicates in a single biological replicate.
Titrating oxidative stress dosage and comparing oxidative stress resistance in the RIC ablation strain
Using the oxidative stress assay steps presented in section 3.4, we measured WT survival under 2.5, 5, 10 or 20 mM paraquat as increasing doses of oxidative stress (Figure 2I). The survival curves of WT worms showed significant changes in a dose-dependent manner. Compared to a physiologically non-stressed mean survival of about 20 days (Figure 2A), the mean survival of wild-type worms is 4.92 days at 2.5 mM, 3.81 days at 5 mM, 2.93 days at 10 mM, and 2.81 days at 20 mM paraquat (Figure 2I). Statistical analyses and P values are presented in detail in Supplementary Table 2 and figure legends. This data provides reliable information for researchers to choose an optimal paraquat dose and time scale in designing an oxidative stress assay. Researchers may choose 2.5 mM to assess worm survival over approximately 10 days, or use higher paraquat concentrations to obtain survival outcomes within several days. Note that higher concentrations (10 mM and 20 mM) accelerate mortality, and intermediate and lower concentrations (2.5 mM and 5 mM) produce a more gradual decline in survival, allowing subtle differences between strains to be more readily distinguished.
We next used 5 mM paraquat, an intermediate dosage among the tested doses, as the oxidative stress condition to evaluate the effect of RIC neuron ablation on survival compared with WT animals. Using the oxidative stress assay steps presented in section 3.4, we examined the survival of both WT and RIC neuron-ablated strains under 5 mM paraquat-induced oxidative stress (Figure 2J). Using the steps of Data analysis presented in section 4.1–4.3, the results showed that no significant difference was found between RIC neuron-ablated strain and the wild-type N2 control group under 5 mM paraquat-induced oxidative stress (Figure 2J).
All representative results from oxidative stress assays were performed with three independent biological replicates conducted on different days (Supplementary Figure 5). Animal number (n value indicated in the figure legends) contributing to the survival curve shown in the representative results and supplementary figures is the pooled number from the four technical replicates in a single biological replicate.
Troubleshooting
A recurring issue in paraquat-induced oxidative stress assays is that worms escape from the agar plates, leading to animal loss and a reduced number of worms available for analysis. A palmitic acid barrier or other “fence” can be added to the assay plates to partially suppress this escape behavior46,47, although the improvement is modest and does not fully eliminate the problem. No significant difference was observed in the health and lifespan of C. elegans after treatment of palmitic acid48. The palmitic acid barrier acts as an aversive "fence" on NGM plates to prevent C. elegans from fleeing due to stress, starvation, or pathogens. To minimize worm escape, apply 30 µL of 10 mg/mL palmitic acid in ethanol (add 0.5 g of palmitic acid to 50 mL of 100% EtOH) to the edge of the 35 mm assay plate and gently swirl the plate to form a continuous ring. Once ethanol has evaporated, the palmitic acid ring acts as a physical and chemical barrier to reduce worm escape. Worms that die while in contact with the palmitic acid ring are censored and excluded from survival analysis.
CAUTION: Palmitic acid and its solution must be handled with appropriate laboratory PPE, including gloves, a laboratory coat, and eye protection, and care must be taken to avoid skin and eye contact.
DATA AVAILABILITY
The survival data underlying Figure 2 and the supplementary figures, including data for all biological replicates and statistical results, are in the Supplementary Figure 1–5, Supplementary Table 1–2 and Supplementary File 1.
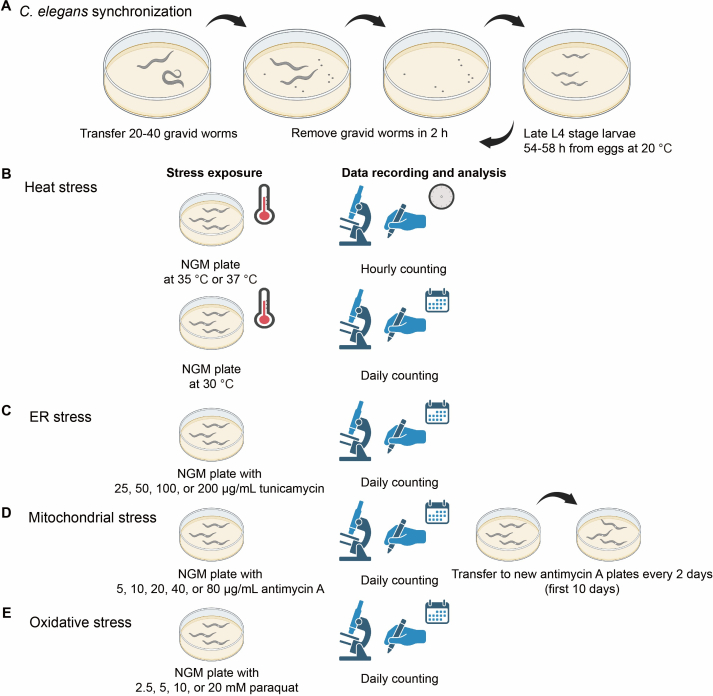
Figure 1: Workflow of stress assays. (A) Synchronized worms are obtained by collecting eggs laid within a 2-h period from gravid worms. Synchronized worms are used for all stress assays and are transferred to stress plates or conditions at the late L4 stage after 54-58 h of development from eggs at 20 °C. (B) In the heat stress assay, synchronized worms are transferred to NGM plates in a 35 °C or 37 °C incubator, and dead worms are scored hourly. For the heat stress assay in a 30 °C incubator, dead worms are scored daily. (C) In the ER stress assay, synchronized worms are transferred to NGM plates containing 25, 50, 100, or 200 µg/mL tunicamycin. Dead worms are scored daily. (D) In the mitochondrial stress assay, synchronized worms are transferred to NGM plates containing 5, 10, 20, 40, or 80 µg/mL antimycin A, and survival is assessed by daily scoring. To prevent interference from progeny, worms are transferred to fresh antimycin A-containing plates every two days during the first 10 days of the assay. (E) In the oxidative stress assay, synchronized worms are transferred onto NGM plates containing 2.5, 5, 10, or 20 mM paraquat, and survival is assessed by daily scoring. Stress resistance is evaluated by comparing Kaplan–Meier survival curves generated from each assay. Please click here to view a larger version of this figure.
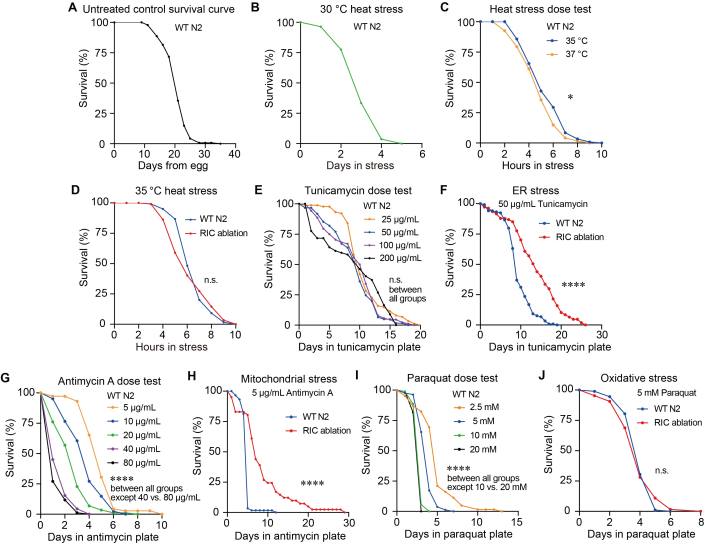
Figure 2: Titrating dosage of heat, ER, mitochondrial, and oxidative stress and comparing stress resistance in the RIC neuron-ablated strain. (A) Representative Kaplan–Meier survival curve of the WT N2 strain under non-stress conditions (n = 141, mean survival = 20.67 days). (B) Representative Kaplan–Meier survival curve of the WT N2 strain under 30 °C heat stress (n = 111, mean survival = 3.11 days). (C) Representative Kaplan–Meier survival curve of WT N2 strain under 35 °C and 37 °C heat stress (n = 119, 121); log-rank test, P = 0.0244, * indicates P < 0.05. (D) Representative Kaplan–Meier survival curve of WT N2 and RIC neuron-ablated strain under 35 °C heat stress (n = 117, 120); log-rank test, P = 0.4972, n.s. indicates no significant difference. WT N2 was used as a control. (E) Dose-response survival curves of the WT N2 strain under increasing concentrations of tunicamycin treatment (n = 88, 61, 88, 67); log-rank test, P = 0.6472 (25 µg/mL v.s. 100 µg/mL), P = 0.1473 (25 µg/mL v.s. 50 µg/mL), P = 0.6581 (50 µg/mL v.s. 200 µg/mL), P = 1 (25 µg/mL v.s. 200 µg/mL; 50 µg/mL v.s. 100 µg/mL; 100 µg/mL v.s. 200 µg/mL), n.s. indicates no significant difference. (F) Representative Kaplan–Meier survival curve of WT N2 and RIC neuron-ablated strain under 50 µg/mL tunicamycin-induced ER stress (n = 119, 107); log-rank test, **** indicates P < 0.0001. (G) Representative Kaplan–Meier survival curves of WT N2 strain treated with increasing concentrations of antimycin A (n =72, 81, 88, 91, 85); log-rank test, P = 0.000038 (5 µg/mL v.s. 10 µg/mL), P = 0.00002 (10 µg/mL v.s. 20 µg/mL), P = 1.60 × 10⁻8 (20 µg/mL v.s. 40 µg/mL), P < 0.0001 (5 µg/mL v.s. 20 µg/mL; 5 µg/mL v.s. 40 µg/mL; 5 µg/mL v.s. 80 µg/mL; 10 µg/mL v.s. 40 µg/mL; 10 µg/mL v.s. 80 µg/mL; or 20 µg/mL v.s. 80 µg/mL), P = 0.189 (40 µg/mL v.s. 80 µg/mL), **** indicates P < 0.0001. (H) Representative Kaplan–Meier survival curve of WT N2 and RIC neuron-ablated strain under 5 µg/mL antimycin A-induced mitochondrial stress (n = 59, 41); log-rank test, P = 3.2 × 10⁻9, **** indicates P < 0.0001. (I) Representative Kaplan–Meier survival curves of WT N2 strain under different doses of paraquat (n = 62, 81, 88, 93); log-rank test, P = 1.80 × 10⁻7 (2.5 mM v.s. 5 mM), P < 0.0001 (2.5 mM v.s. 10 mM; 2.5 mM v.s. 20 mM; 5 mM v.s. 10 mM; 5 mM v.s. 20 mM), P = 0.1445 (10 mM v.s. 20 mM), **** indicates P < 0.0001. (J) Representative Kaplan–Meier survival curves of WT N2 and RIC neuron-ablated strain under 5 mM paraquat-induced oxidative stress (n = 92, 64); log-rank test, P = 0.9817, n.s. indicates no significant difference. All experiments were performed with three independent biological replicates. Representative results from one biological replicate are shown in this figure. Each biological replicate consists of four technical replicate plates with worms. Animal number (n) contributing to the survival curve in this figure is the pooled number from the four technical replicates in a single biological replicate. Independent biological replicates were analyzed separately rather than pooled and presented as individual datasets in Supplementary Figure 2–5. Significance was assessed using a log-rank test comparing survival distributions. Detailed statistical P values, mean survival, and S. E. among technical replicates are included in Supplementary Table 2. Please click here to view a larger version of this figure.
Supplementary Figure 1: Absence of tbh-1p::GFP fluorescence in the RIC neuron-ablated strain, while GFP expression was observed in the RIC neurons of the tbh-1p::GFP reporter control strain. (A) Fluorescent images of the RIC neuron-ablated strain tbh-1p::caspase-3(p12)::nz; tbh-1p::cz::caspase-3(p17); tbh-1p::GFP; myo-3p::GFP and a tbh-1p::GFP reporter control strain OH16150 tbh-1p::GFP; tdc-1p::mCherry. Late L4-stage worms were imaged using 488 nm excitation with an 800 ms exposure time for the GFP channel and a 176 ms exposure time for the bright-field channel. Yellow arrowheads indicate the location of RIC neurons in the control tbh-1p::GFP reporter strain or the expected location of RIC neurons which is absent in the RIC neuron-ablated strain. tbh-1p::GFP signal was not detected at the RIC neuron location in the RIC neuron-ablated strain, while tbh-1p::GFP signal was observed in the RIC neurons of the tbh-1p::GFP reporter control strain OH16150. The body wall muscle fluorescence in the RIC neuron-ablated strain is from myo-3p::GFP, a co-injection marker. (A) n = 14 for OH16150; n = 20 for RIC neuron-ablated strain. (B, C) Representative results from two other biological replicates. Late L4-stage worms were imaged using 488 nm excitation with a 1007 ms (B) or 1998 ms (C) exposure time for the GFP channel and a 176 ms (B and C) exposure time for the bright-field channel. (B) n = 8 for OH16150; n = 17 for RIC neuron-ablated strain. (C) n = 14 for OH16150; n = 13 for RIC neuron-ablated strain. Please click here to download this file.
Supplementary Figure 2: Biological replicates of survival curves under non-stress conditions or heat stress. (A, B) Kaplan-Meier survival curves from two independent biological replicates under non-stress conditions. (A) n = 123, mean survival = 20.52 days; (B) n = 130, mean survival = 22.74 days. (C, D) Kaplan-Meier survival curves of the WT N2 strain under 30 °C heat stress. Data are from two independent biological replicates. (C) n = 130, mean survival = 3.72 days. (D) n = 98, mean survival = 3.77 days. (E, F) Kaplan-Meier survival curves under 35 °C or 37 °C heat stress condition. Data are from two independent biological replicates. (E) n = 118, 121; log-rank test, P = 0.0409, * indicates P < 0.05, (F) n = 122, 120; log-rank test, P = 0.0251, * indicates P < 0.05. (G, H) Kaplan-Meier survival curves of WT N2 and RIC neuron-ablated strains under 35 °C heat stress conditions. Data are from two independent biological replicates. (G) n = 79, 76; log-rank test, P = 0.2217, n.s. indicates no significant difference. (H) n = 77, 81; log-rank test, P = 0.1881, n.s. indicates no significant difference. Significance was assessed using a log-rank test comparing survival distributions. Detailed statistical P values, mean survival, and S. E. among technical replicates are included in Supplemental Table 2. Please click here to download this file.
Supplementary Figure 3: Biological replicates of survival curves under ER stress conditions. (A, B) Kaplan-Meier survival curves of the WT N2 strain under different concentrations of tunicamycin treatment. Data are from two independent biological replicates. (A) n = 110, 102, 100, 96; (B) n = 88, 77, 75, 69. Statistical P values between different groups (A and B) are indicated in Supplemental Table 2. (C, D) Kaplan-Meier survival curves of the WT N2 and RIC neuron-ablated strain under 50 µg/mL tunicamycin-induced ER stress conditions. Data are from two independent biological replicates. (C) n = 104, 55; log-rank test, P = 0.012, * indicates P < 0.05, (D) n = 85, 109; log-rank test, P = 0.0001, *** indicates P < 0.001. Significance was assessed using a log-rank test comparing survival distributions. Detailed statistical P values, mean survival, and S. E. among technical replicates are included in Supplemental Table 2. Please click here to download this file.
Supplementary Figure 4: Biological replicates of survival curves under mitochondrial stress conditions. (A, B) Kaplan-Meier survival curves of the WT N2 strain under different concentrations of antimycin A treatment. Data are from two independent biological replicates. (A) n = 71, 80, 81, 88, 90. (B) n=71, 85, 83, 88, 87. Statistical P values between different groups (A and B) are indicated in Supplemental Table 2. (C, D) Kaplan-Meier survival curves of the WT N2 strain and RIC neuron-ablated strain under antimycin A-induced mitochondrial stress. Data are from two independent biological replicates. (C) n = 105, 78; log-rank test, P = 0.000004, **** indicates P < 0.0001. (D) n = 89, 73; log-rank test, **** indicates P < 0.0001. Significance was assessed using a log-rank test comparing survival distributions. Detailed statistical P values, mean survival, and S. E. among technical replicates are included in Supplemental Table 2. Please click here to download this file.
Supplementary Figure 5: Biological replicates of survival curves under oxidative stress conditions. (A, B) Kaplan-Meier survival curves of WT N2 strain under different concentrations of paraquat treatment. Data are from two independent biological replicates. (A) n = 38, 63, 60, 31. (B) n = 55, 77, 86, 107. Statistical P values between different groups (A and B) are indicated in Supplemental Table 2. (C, D) Kaplan-Meier survival curves of the WT N2 and RIC neuron-ablated strain under 5 mM paraquat-induced oxidative stress conditions. Data are from two independent biological replicates. (C) n = 87, 82; log-rank test, P = 0.2629, n.s. indicates no significant difference. (D) n = 116, 118; log-rank test, P = 0.1184, n.s. indicates no significant difference. Significance was assessed using a log-rank test comparing survival distributions. Detailed statistical P values, mean survival, and S. E. among technical replicates are included in Supplemental Table 2. Please click here to download this file.
Supplementary Table 1: Summary of worm numbers included in all the survival curves. The table summarizes the initial number of worms and the numbers of ruptured, bagged, and censored worms. Please click here to download this file.
Supplementary Table 2: Detailed statistical analyses of all survival curves, including P values, mean survival, and S. E. Please click here to download this file.
Supplementary File 1: Data supporting the findings of this study.
Includes the verification of the successful ablation of the RIC neurons and the results of all biological replicates underlying the data presented in the main figures. Please click here to download this file.
Discussion
Here we have described standardized steps for reproducible stress assays under heat, ER, mitochondrial, and oxidative stress in C. elegans (Figure 1). We examined a range of increasing doses of all four stressors on the survival of WT worms (Figure 2). We also presented an example of investigating the role of an interneuron in stress resistance against all four stressors using a neuron ablation strain (Figure 2).
To successfully employ the stress assay protocol presented here, several key considerations need to be noted in the process. Due to lab-to-lab variability from differences including agar powder, medium, ambient temperature and humidity, it is recommended to titrate each stress or stress-inducing compound concentrations following our titration and steps outlined in the Protocol and Results sections. A suitable stress condition should produce a reproducible, intermediate survival response in wild-type control worms, allowing sufficient dynamic range to detect both increased and decreased stress resistance. Conditions resulting in near-complete survival or near-complete lethality should be avoided. Next, it is essential to ensure worms are synchronized to the same development stage for all biological and technical replicates. Worm synchronization can be achieved by using the procedure outlined in section 2.1–2.3. The late L4 stage synchronization is recommended. Initiating stress assays at the L4 stage is a well-established practice in the C. elegans stress response research field, and numerous studies have employed synchronized L4 animals for oxidative42, heat 40,43, and other stress resistance assays35. Starting at the L4 stage ensures developmental synchronization while minimizing variability introduced by differences in adult age and reproductive status, including the onset of egg production and embryo retention, both of which can influence stress resistance measurements12,37,38,40. Because all experimental groups in our study were synchronized and treated identically, this approach provides a consistent and appropriate basis for comparing stress resistance. Finally, if worms are starved or stressed before the assay starts, their progeny should be recovered for several generations of fed non-stressed conditions before being used as gravid worms to generate synchronized progeny for the stress assays.
Inter-experimental variability among independent biological replicates may arise from differences in plate preparation and storage, including the duration of storage of stress-inducing compound-containing plates at 4 °C and the timing of OP50 bacterial seeding. To improve reproducibility across experiments performed on different days, critical plate preparation steps should be standardized following the outlined protocol for making NGM plates in section 1.1, tunicamycin-induced ER stress plates in section 3.2.1, antimycin A-induced mitochondrial stress plates in section 3.3.1, and paraquat-induced oxidative stress plates in section 3.4.1. Specifically, agar plates should be dried at room temperature for approximately 24 h after pouring and then seeded with OP50 once the agar has completely solidified. The OP50-seeded NGM plates should be allowed to dry at room temperature for an additional 24 h before being stored at 4 °C. The optimal drying time may vary depending on the use of vented or non-vented plates and local environmental conditions, such as temperature and humidity. Therefore, each laboratory should optimize this step for its own conditions and maintain a consistent drying time across all independent biological replicates to ensure reproducibility. Stress assay plates should be used within one week of preparation to minimize degradation of stress-inducing compounds and excessive bacterial growth, both of which may affect assay consistency.
This protocol also showed an example of investigating the role of an interneuron in stress response to all four stressors using a neuron ablation strain (Figure 2). The promoter of a gene specifically expressed in a neuron can be used to drive caspase-3 expression and ablate the target neuron. Here we employed tbh-1 promoter, which drives gene expression specifically in RIC neurons, for RIC neuron ablation. The tbh-1 promoter has been widely validated for RIC-directed genetic manipulation and is routinely used for cell-specific expression, rescue, calcium imaging, and neuronal silencing45,49,50. Consistent with reported characterization of tbh-1, we observed expression of tbh-1p::GFP restricted to the RIC neurons and did not detect fluorescence in other tissues (Supplementary Figure 1). We did not specifically examine brood size or germline morphology in the RIC neuron-ablated strain; however, we did not observe obvious physiological defects in the RIC neuron-ablated strain. The tbh-1 reporter has been reported to exhibit additional expression in somatic gonadal sheath cells, which are somatic cells of the reproductive system51,52. While we cannot completely exclude the possibility of low-level expression outside the RIC neurons, we consider it unlikely that non-RIC expression of tbh-1 accounts for the enhanced stress resistance observed in the RIC neuron-ablated animals. Although this method is well established49,50, it is limited by possible expression in cells outside the target neuron. Other methodologies of confirming a neuron’s role are needed, for example, monitoring neuron activity in response to stressors, or evaluating the role of neurotransmitters released from this neuron in stress assays.
C. elegans survival assays are powerful tools for measuring stress resistance because of the relatively short lifespan of worms (approximately 20 to 30 days, Figure 2) and the rapid mortality induced by multiple stressors, which typically occurs over hours to days (Figure 2). However, a limitation of survival assays is that they use a binary live/dead endpoint and therefore do not capture the progressive physiological decline that occurs during stress exposure. Complementary assays, such as thrashing assays or automated locomotion (velocity) measurements performed at multiple time points, can provide additional information on the gradual loss of neuromuscular function during stress. Another limitation is that death is determined by the absence of a response to gentle physical stimulation, which may underestimate viability in animals with severely impaired locomotion. In addition, manual scoring introduces observer-dependent variability and potential bias. To minimize these effects, all scoring within an independent biological replicate should be performed by the same researcher, who should be blinded to genotype and experimental conditions. Consistent scoring conditions, including the use of the same microscope magnification and illumination settings at each time point, are also important for reducing variability between plates and across experiments. In the representative results, we presented an example in which RIC neuron-ablated strain showed increased stress resistance to ER and mitochondrial stress but not heat and oxidative stress, compared to wild-type worms (Figure 2). A survival difference under two of four stressors does not by itself establish a pathway-specific role for the neuron; the biological conclusion in this manuscript is offered as a demonstration of the method and the observation rather than as a mechanistic claim.
Beyond the stress survival assays described here, several automated platforms have been developed to measure C. elegans survival. Automated scoring substantially increases throughput, enables continuous or high-frequency monitoring, and reduces observer-dependent bias and labor associated with manual scoring53,54,55. These systems are particularly advantageous for large-scale genetic or chemical screens. However, most automated methods infer death from the cessation of movement, which can result in the misclassification of worms that are quiescent or exhibit severely impaired locomotion under stress, depending on the imaging algorithm and detection threshold. Automated detection can also be affected by environmental factors, including temperature, condensation, fungal or bacterial contamination, and variations in culture conditions, all of which may interfere with worm detection and influence survival measurements. In contrast, manual scoring allows the experimenter to identify abnormal phenotypes, such as bagging, internal hatching, or ruptured animals, that may require specific scoring or censoring criteria. Although manual scoring is more labor-intensive and subject to observer-related variability, these limitations can be minimized by blinded scoring, standardized scoring criteria, and consistent scoring by the same researcher. Consequently, manual and automated survival assays each have distinct advantages and limitations, and the choice of method should be guided by the experimental objectives, required throughput, and the nature of the stress paradigm.
Taken together, the methods described here provide a standardized and reproducible framework for evaluating C. elegans responses to multiple environmental stressors, including heat, mitochondrial, ER, and oxidative stress. Assessing resistance to diverse stressors is essential because genetic or physiological perturbations may enhance resistance to one type of stress while increasing susceptibility to another, thereby revealing both stressor-specific and shared mechanisms of stress adaptation. These assays enable quantitative comparisons of stress resistance across different genotypes and experimental conditions and can be readily applied to investigate the roles of genes, neurons, and metabolic pathways in maintaining stress resistance and physiological homeostasis. More broadly, these methods provide a robust platform for identifying mechanisms that promote organismal health and survival under adverse environmental conditions.
Disclosures
The authors have no conflicts of interest to disclose.
Acknowledgements
Research reported in this publication was supported by Kansas Idea Network of Biomedical Research Excellence (K-INBRE, P20 GM103418), Center of Biomedical Research Excellence (COBRE, P20 GM113109), and Johnson Cancer Research Center at Kansas State University (Cancer Research Expansion Award) to S.H. for funding.
Materials
| Name | Company | Catalog Number | Comments |
|---|---|---|---|
| Tunicamycin | Sigma-Aldrich | T7765 | ER stress inducer |
| Antimycin A | Sigma-Aldrich | A8674 | Mitochondrial stress inducer |
| Methyl viologen dichloride hydrate (paraquat) | Sigma-Aldrich | 856177 | Oxidative stress inducer |
| Palmitic acid | MP Biomedicals, LLC | 100905 | Suppress C. elegans escape behavior |
| Cholesterol | MP Biomedicals, LLC | 101382 | For NGM |
| Calcium chloride | Thermo Fisher Scientific Inc. | C79-500 | For NGM |
| Magnesium sulfate anhydrous | Mallinckrodt Pharmaceuticals plc | 6070 | For NGM |
| Agar | Apex Chemicals Co., Ltd | 20-273 | For NGM |
| Peptone | Apex Chemicals Co., Ltd | 20-260 | For NGM |
| Potassium phosphate monobasic | Thermo Fisher Scientific Inc. | P285-3 | For NGM |
| Sodium chloride | Thermo Fisher Scientific Inc. | S640-3 | For NGM |
| Potassium phosphate dibasic | Allied Chemical, General Chemical Division | Code 2131 | For NGM |
| Petri dishes (35 mm) | Genesee Scientific, LLC | 32-103 | Stress assay plates |
| Petri dishes (60 mm) | Genesee Scientific, LLC | 32-105 | Maintain C. elegans |
| mec-18p cz::caspase-3 (p17) | Addgene | TU#814 | |
| mec-18p::caspase-3 (p12)::nz | Addgene | TU#813 | |
| New Brunswick Scientific (Eppendorf) C24KC Refrigerated Incubator Shaker | Eppendorf / New Brunswick Scientific | C24KC | 37 °C incubator |
| DigiTherm® 38-liter Heating/Cooling Incubator | Tritech Research Inc. | DT2-MP-47L | 35 °C incubator |
| Fisher Scientific Isotemp Low Temperature Incubator | Fisher Scientific | 146E | 30 °C incubator |
| SHELab SRI20P Refrigerated Incubator | Sheldon Manufacturing Inc. | SRI20P | 20 °C incubator |
| Leica M165 FC Research Stereo Microscope | Leica Microsystems | M165 FC | Microscope for imaging |
| ACCU-SCOPE 3075-DIA Zoom Stereo Microscope | ACCU-SCOPE Inc. | 3075-DIA | Microscope for handling and scoring worms |
| Microsoft Excel 2019 | Microsoft Corporation | Raw data plotting | |
| GraphPad Prism 8.0.2 | GraphPad Software Inc. | Data visualization | |
| OASIS 2 | POSTECH, PMID: 27528229 | Statistical analysis | |
| BioRender | Science Suite Inc. | Schematic illustration | |
| ImageJ | National Institutes of Health (NIH) | Image processing | |
| Adobe Illustrator 2021 | Adobe Inc. | Figure assembly layout | |
| wild-type | Caenorhabditis Genetics Center, CGC | N2 | |
| tbh-1p::caspase-3(p12)::nz; tbh-1p::cz::caspase-3(p17); tbh-1p::GFP; myo-3p::GFP | home made | RIC ablation | |
| nIs107 [tbh-1::GFP] III. zfIs10 [tdc-1::mCherry] IV. RIC neurons are marked with both GFP and mCherry | Caenorhabditis Genetics Center, CGC | OH16150 |
References
- Morimoto RI, Santoro MG. Stress-inducible responses and heat shock proteins: new pharmacologic targets for cytoprotection. Nat Biotechnol. 1998;16(9):833-838.
- Hetz C, Chevet E, Oakes SA. Proteostasis control by the unfolded protein response. Nat Cell Biol. 2015;17(7):829-838.
- Blackwell TK, et al. SKN-1/Nrf, stress responses, and aging in Caenorhabditis elegans. Free Radic Biol Med. 2015;88(Pt B):290-301.
- Lamech LT, Haynes CM. The unpredictability of prolonged activation of stress response pathways. J Cell Biol. 2015;209(6):781-787.
- Balch WE, Morimoto RI, Dillin A, Kelly JW. Adapting proteostasis for disease intervention. Science. 2008;319(5865):916-919.
- Powers ET, et al. Biological and chemical approaches to diseases of proteostasis deficiency. Annu Rev Biochem. 2009;78:959-991.
- Soo SK, et al. Biological resilience and aging: activation of stress response pathways contributes to lifespan extension. Ageing Res Rev. 2023;88:101941.
- Ma Z, et al. The integrated stress response protects against ER stress but is not required for altered translation and lifespan from dietary restriction in Caenorhabditis elegans. Front Cell Dev Biol. 2023;11:1263344.
- Horikawa M, Sakamoto K. Fatty-acid metabolism is involved in stress-resistance mechanisms of Caenorhabditis elegans. Biochem Biophys Res Commun. 2009;390(4):1402-1407.
- Prahlad V, Cornelius T, Morimoto RI. Regulation of the cellular heat shock response in Caenorhabditis elegans by thermosensory neurons. Science. 2008;320(5877):811-814.
- Prahlad V, Morimoto RI. Neuronal circuitry regulates the response of Caenorhabditis elegans to misfolded proteins. Proc Natl Acad Sci U S A. 2011;108(34):14204-14209.
- Taylor RC, Dillin A. XBP-1 is a cell-nonautonomous regulator of stress resistance and longevity. Cell. 2013;153(7):1435-1447.
- Ozbey NP, et al. Tyramine acts downstream of neuronal XBP-1s to coordinate inter-tissue UPR(ER) activation and behavior in C. elegans. Dev Cell. 2020;55(6):754-770.e6.
- Durieux J, Wolff S, Dillin A. The cell-non-autonomous nature of electron transport chain-mediated longevity. Cell. 2011;144(1):79-91.
- Berendzen KM, et al. Neuroendocrine coordination of mitochondrial stress signaling and proteostasis. Cell. 2016;166(6):1553-1563.e10.
- Shaposhnikov M, et al. Lifespan and stress resistance in Drosophila with overexpressed DNA repair genes. Sci Rep. 2015;5:15299.
- Jia J, et al. A pair of dopamine neurons mediate chronic stress signals to induce learning deficit in Drosophila melanogaster. Proc Natl Acad Sci U S A. 2021;118(42):e2023674118.
- Solovev I, et al. Neuron-specific overexpression of core clock genes improves stress-resistance and extends lifespan of Drosophila melanogaster. Exp Gerontol. 2019;117:61-71.
- Shuai Y, Zhang Y, Gao L, Zhong Y. Stress resistance conferred by neuronal expression of dominant-negative Rac in adult Drosophila melanogaster. J Neurogenet. 2011;25(1-2):35-39.
- Williams KW, et al. Xbp1s in Pomc neurons connects ER stress with energy balance and glucose homeostasis. Cell Metab. 2014;20(3):471-482.
- Kim JG, Ea JY, Yoon BJ. Orexinergic neurons modulate stress coping responses in mice. Front Mol Neurosci. 2023;16:1140672.
- Jovaisaite V, Mouchiroud L, Auwerx J. The mitochondrial unfolded protein response, a conserved stress response pathway with implications in health and disease. J Exp Biol. 2014;217(Pt 1):137-143.
- Richter K, Haslbeck M, Buchner J. The heat shock response: life on the verge of death. Mol Cell. 2010;40(2):253-266.
- Hetz C, Zhang K, Kaufman RJ. Mechanisms, regulation and functions of the unfolded protein response. Nat Rev Mol Cell Biol. 2020;21(8):421-438.
- Finkel T. Signal transduction by reactive oxygen species. J Cell Biol. 2011;194(1):7-15.
- Hu C, et al. Heat shock proteins: biological functions, pathological roles, and therapeutic opportunities. MedComm (2020). 2022;3(3):e161.
- Lithgow GJ, White TM, Hinerfeld DA, Johnson TE. Thermotolerance of a long-lived mutant of Caenorhabditis elegans. J Gerontol. 1994;49(6):B270-6.
- Krshnan L, van de Weijer ML, Carvalho P. Endoplasmic reticulum-associated protein degradation. Cold Spring Harb Perspect Biol. 2022;14(12):a041247.
- Naidoo N. ER and aging-protein folding and the ER stress response. Ageing Res Rev. 2009;8(3):150-159.
- Heifetz A, Keenan RW, Elbein AD. Mechanism of action of tunicamycin on the UDP-GlcNAc:dolichyl-phosphate Glc-NAc-1-phosphate transferase. Biochemistry. 1979;18(11):2186-2192.
- Guo Y, et al. Mitochondrial dysfunction in aging. Ageing Res Rev. 2023;88:101955.
- Murphy MP. How mitochondria produce reactive oxygen species. Biochem J. 2009;417(1):1-13.
- Xu X, Pang Y, Fan X. Mitochondria in oxidative stress, inflammation and aging: from mechanisms to therapeutic advances. Signal Transduct Target Ther. 2025;10(1):190.
- Bus JS, Gibson JE. Paraquat: model for oxidant-initiated toxicity. Environ Health Perspect. 1984;55:37-46.
- Park HH, Jung Y, Lee SV. Survival assays using Caenorhabditis elegans. Mol Cells. 2017;40(2):90-99.
- Zevian SC, Yanowitz JL. Methodological considerations for heat shock of the nematode Caenorhabditis elegans. . 2014;68(3):450-457.
- Keith SA, Amrit FR, Ratnappan R, Ghazi A. The C. elegans healthspan and stress-resistance assay toolkit. . 2014;68(3):476-486.
- Senchuk MM, Dues DJ, Van Raamsdonk JM. Measuring oxidative stress in Caenorhabditis elegans: paraquat and juglone sensitivity assays. Bio Protoc. 2017;7(1):e2086.
- Golden NL, Plagens RN, Kim Guisbert KS, Guisbert E. Standardized for measuring induction of the heat shock response in Caenorhabditis elegans. J Vis Exp. 2020;(161):e61030.
- Bar-Ziv R, et al. Measurements of physiological stress responses in C. elegans. J Vis Exp. 2020;(159):e61001.
- Rahman M, et al. NemaLife chip: a micropillar-based microfluidic culture device optimized for aging studies in crawling C. elegans. Sci Rep. 2020;10(1):16190.
- Rafikova A, Hu Q, Kubiseski TJ. The SEM-4 transcription factor is required for regulation of the oxidative stress response in Caenorhabditis elegans. G3 (Bethesda). 2020;10(9):3379-3385.
- Liang J, et al. Chloride intracellular channel proteins respond to heat stress in Caenorhabditis elegans. PLoS One. 2017;12(9):e0184308.
- Han SK, et al. OASIS 2: online application for survival analysis 2 with features for the analysis of maximal lifespan and healthspan in aging research. Oncotarget. 2016;7(35):56147-56152.
- Kitto ES, et al. The hypoxic response extends lifespan through a bioaminergic and peptidergic neural circuit. eLife. 2025;14:RP107651.
- Miller DL, Roth MB. C. elegans are protected from lethal hypoxia by an embryonic diapause. Curr Biol. 2009;19(14):1233-1237.
- Miller HA, et al. Serotonin and dopamine modulate aging in response to food odor and availability. Nat Commun. 2022;13(1):3271.
- Beydoun S, Sridhar A, Bhandari M, Kitto ES, Leiser SF. Polyethylene glycol as an improved barrier to prevent fleeing in C. elegans. MicroPubl Biol. 2024.
- Sellegounder D, et al. Octopaminergic signaling mediates neural regulation of innate immunity in Caenorhabditis elegans. mBio. 2018;9(5):e01645-18.
- Wang X, et al. Dimorphic neural network architecture prioritizes sexual-related behaviors in male Caenorhabditis elegans. eLife. 2026;14:RP102309.
- Alkema MJ, Hunter-Ensor M, Ringstad N, Horvitz HR. Tyramine functions independently of octopamine in the Caenorhabditis elegans nervous system. Neuron. 2005;46(2):247-260.
- Wang C, et al. A neurotransmitter atlas of C. elegans males and hermaphrodites. eLife. 2024;13:RP95402.
- Stroustrup N, et al. The Caenorhabditis elegans lifespan machine. Nat. 2013;10(7):665-670.
- Felker DP, Robbins CE, McCormick MA. Automation of C. elegans lifespan measurement. Transl Med Aging. 2020;4:1-10.
- Banse SA, et al. Automated lifespan determination across Caenorhabditis strains and species reveals assay-specific effects of chemical interventions. Geroscience. 2019;41(6):945-960.
Reprints and Permissions
This article has been published
Video Coming Soon