We develop a primary rat astrocyte model that provides a physiologically relevant system for studying Alexander disease (AxD), enabling investigation of GFAP aggregation, pathological modification, and astrocyte dysfunction. This system bridges in vitro and in vivo studies, offering a robust platform to explore AxD pathology and identify therapeutic targets for neurodegenerative diseases.
Method Article
Cellular Models for Studying Alexander Disease: Functional Analysis of Primary Rat Astrocytes
In This Article
Summary
Abstract
Astrocytes play a vital role in maintaining central nervous system homeostasis, supporting neuronal function, and responding to injury or disease. Dysfunction in astrocyte activity is increasingly recognized as a key contributor to neurodegenerative disorders, including Alexander disease (AxD), a rare and fatal condition caused by mutations in glial fibrillary acidic protein (GFAP). These mutations result in GFAP aggregation, Rosenthal fiber formation, and progressive astrocyte dysfunction. While in vivo animal models offer a complex cellular environment, both current in vitro and in vivo models face limitations in accurately replicating the intricate cellular context and functions of astrocytes. To address this, we developed a cellular model using primary rat astrocytes derived from wild-type (WT) and AxD model rats to study the functional effects of GFAP mutations. This physiologically relevant system enables detailed investigation of astrocyte-specific mechanisms, including GFAP aggregation, oxidative stress responses, and pathological modifications. For researchers without access to AxD model rats, lentiviral transduction offers an alternative method to introduce AxD-associated GFAP mutations into astrocytes derived from normal rats, thereby broadening the applicability of this approach. Compared with immortalized astrocyte cell lines or in vitro studies using recombinant protein, primary astrocytes better preserve native cellular architecture and molecular profiles, offering a robust platform for studying GFAP dynamics, solubility, and astrocytic responses to stressors such as oxidative damage and pathological modifications. This cellular model bridges the gap between molecular and systemic studies, providing a controlled experimental framework to explore astrocyte dysfunction in AxD. By complementing existing methodologies, primary astrocyte cultures enhance our understanding of AxD pathology and represent a valuable tool for identifying potential therapeutic targets for neurodegenerative diseases.
Introduction
Astrocytes are specialized glial cells that span the entire central nervous system (CNS), playing critical roles in maintaining brain homeostasis, regulating neuronal activity, and responding to injury or disease1. Their functions include neurotransmitter clearance and recycling, extracellular ion and water homeostasis, and support for neural circuit function. Astrocyte-secreted molecules are essential for synapse development and synaptic plasticity in the adult brain2. In response to CNS injury or disease, astrocytes undergo reactive changes that can mediate either pro- or anti-inflammatory signaling, enabling neuroprotective functions but potentially contributing to CNS pathologies depending on the context3. Dysregulation of astrocyte function is increasingly recognized as a key factor in CNS health and disease4,5.
Glial fibrillary acidic protein (GFAP), a type III intermediate filament (IF) protein, is a major cytoskeletal component of astrocytes, expressed by most but not all astrocytes. GFAP is upregulated in response to CNS injury, serving as a marker for tissue damage severity6. Although GFAP is traditionally associated with structural roles7, its functional implications remain underexplored. Mutations in GFAP cause Alexander disease (AxD)8, a rare neurodegenerative disorder characterized by GFAP aggregation, Rosenthal fiber formation, and progressive astrocyte dysfunction. While in vitro biochemical studies9,10,11 and in vivo animal models12,13 have provided insights into AxD pathology, they fail to capture the complex cellular context of astrocyte function14.
To overcome these limitations, we developed a cellular model using primary rat astrocytes derived from wild-type (WT) and AxD model rats13. This system preserves the native cellular architecture and molecular profiles of astrocytes, enabling the study of GFAP aggregation, oxidative stress responses, and pathological modifications associated with AxD. For researchers without access to AxD model rats, lentiviral transduction offers an alternative method to introduce AxD-associated GFAP mutations into astrocytes derived from normal rats10.
Compared with immortalized cell lines, primary astrocytes preserve the heterogeneity and complexity of astrocyte populations in vivo, providing a physiologically relevant platform for investigating astrocyte-specific mechanisms15. Unlike in vitro studies using recombinant protein9, primary astrocytes naturally express GFAP and other astrocyte-specific markers, allowing for the study of disease-associated variants within a native cellular environment10,16,17. Furthermore, primary astrocytes facilitate investigation into functional responses to stress stimuli, such as oxidative damage18 and inflammation19, which are challenging to replicate in simplified in vitro systems.
In AxD research, primary astrocytes complement biochemical and in vivo approaches by bridging the gap between molecular and systemic studies. While biochemical assays focus on the molecular properties of GFAP mutations, they lack cellular complexity, whereas in vivo models capture systemic effects but are less suited for mechanistic cellular studies. Primary astrocytes provide an intermediate system with cellular complexity and experimental control, aligning with current trends in neurodegenerative disease research that emphasize cellular models for understanding disease mechanisms and identifying therapeutic targets20.
This manuscript presents the development and application of primary rat astrocytes as a cellular model for AxD research. By enabling direct comparison between WT and AxD astrocytes, this approach addresses key limitations of alternative techniques and expands accessibility via lentiviral transduction. These findings contribute to a deeper understanding of astrocyte dysfunction in AxD and offer a valuable tool for advancing therapeutic discoveries in neurodegenerative diseases.
Protocol
Animals used in this protocol were approved by the Institutional Animal Care and Use Committee of the College of Life Sciences and Medicine at the National Tsing Hua University (NTHU IACUC Approval No. 109088 and 111060) and in accordance with the guidelines of the Agriculture Guidebook for the Care and Use of Laboratory Animals.
1. Preparation of media, coverslips, dishes, and plates
- Before starting, ensure the following solutions (Table 1) are prepared and ready for use.
- Sterilize scissors and forceps by autoclaving before use to ensure sterility.
- Prepare poly-L-lysine (PLL) solution at 0.02 mg/mL in boric acid buffer.
- Add enough PLL solution to fully cover the surface of the coverslip or the bottom of the culture dish/plate. Ensure the coating is even.
- Leave the PLL-coated coverslips and dishes to incubate overnight at room temperature in a laminar flow hood.
- The next day, carefully remove the PLL solution. Rinse the coated coverslips or dish/plate three times with fresh sterile water to remove any residual PLL.
NOTE: It is critical to thoroughly rinse the PLL-coated flask/plate, or the coverslips, to remove residual PLL that may negatively affect cell viability.
2. Preparation of primary astrocyte culture
NOTE: A schematic overview is shown in Figure 1.
- Following the induction of hypothermia by placing the pups on ice, decapitate the postnatal day 1–3 rat pup and separate the head from the body.
- Place the head in a 60-mm dish and secure the sides with forceps. Using fine scissors, gently dissect the skin on the top of the head.
- Make an incision at the vertex of the head using fine scissors to carefully open the skull. Gently separate and remove the two halves of the skull.
- Using forceps, pinch off the brain from the base and transfer it to a 60-mm dish containing dissection medium.
- Place each hemisphere with the medial surface facing upward to expose the midline structures.
- Under a dissecting microscope, gently remove the midbrain and brainstem tissues, leaving intact hemispheres containing the cortex and hippocampus.
- Use fine forceps to gently peel off the meninges, ideally as a single piece. Carefully check for any remaining meninges hidden in fissures and remove them completely.
- Move the dissected brain tissue to a laminar flow hood. Aspirate the dissection medium using a 1 mL pipette and add fresh dissection medium.
- Finely chop the tissue using a sterile scalpel blade.
- Transfer the chopped tissue into 5 mL of dissociation medium in a 15 mL tube. Incubate the tube in a 37ºC water bath for 15 min, gently shaking the tube every 5 min to ensure proper enzyme-tissue interaction.
- After incubation, allow the tissue to settle at the bottom of the tube. Aspirate the supernatant and add 5 mL of dissection medium.
- Invert the tube 5 times to wash the tissue. Let the tube stand for 3 min to allow the tissue to settle, then repeat the washing process three times using fresh dissection medium.
- After the final wash, remove the supernatant and add 2.5 mL of dissection medium and 2.5 mL of maintenance medium.
- Triturate the tissue by passing the solution up and down 10–15 times using a 10-mL pipette.
- Let the tube stand for 3 min to allow the tissue to settle. Transfer the supernatant (containing cells) to a new 50 mL conical tube.
- Add 5 mL of MEM medium to the original tube containing the settled tissue. Triturate another 10–15 times with a 10-mL pipette until most chunks disappear.
- Pass the cell suspension through a sterile 40 µm cell strainer into a clean 50 mL conical tube containing 5 mL of maintenance medium.
- Centrifuge the filtered cell suspension at 200 × g for 5 min at room temperature.
- Remove the supernatant, then gently loosen the cell pellet by tapping the tube.
- Add 5 mL of MEM medium and pipette up and down 10 times to resuspend the pellet. Keep the cell suspension in a 37ºC water bath during cell counting.
- Dilute 10 μL of the cell suspension with 90 µL of MEM medium. Mix well using a 200 µL pipette tip.
- Add 20 μL of diluted cell suspension to 20 µL of trypan blue. Count the cells using a hemocytometer.
- Plate cells in culture vessels as follows: for a 24-well plate, seed 2 × 10⁵ cells per well; for a 6-well plate, seed 5 × 10⁵ cells per well; for a 6-cm dish, seed 1 × 10⁶ cells per dish.
- Place the plates or dishes in a tissue culture incubator. Avoid leaving the cells at room temperature for extended periods.
- Examine the cells under a microscope to ensure they have adhered to the substrate 4 h after plating.
- At 24 h after plating, replace the culture medium with fresh maintenance medium.
- Feed the culture every 2–3 days by replacing half of the medium with fresh maintenance medium.
- After 7 days, the cells should reach approximately 80% confluency and will be ready for experiments.
NOTE: To ensure optimal conditions for astrocyte cultures, perform all steps in a sterile environment, preferably within a laminar flow hood, to avoid contamination. Additionally, ensure that all reagents are pre-warmed to 37°C where applicable. Be meticulous when removing meninges, as any leftover meningeal tissue can interfere with the cultures. Furthermore, avoid leaving cells at room temperature for extended periods during plating and counting to maintain cell viability and integrity.
3. Production of lentiviral particles and transduction
NOTE: A schematic overview is shown in Figure 2.
- Seed HEK293T cells in a 10 cm2 petri dish containing fresh culture medium (Table 1).
- Grow cells overnight at a 37ºC incubator to reach 50%–60% confluency.
- In 1 mL of Opti-MEM, add 20 µg of lentiviral plasmid encoding GFAP or its variants, 5.6 µg of packaging vector, and 1.8 µg of envelope vector.
- Add 45 µL of transfection reagent to the DNA-containing solution.
- Mix gently and incubate at room temperature for 15 min.
- Add the transfection solution directly to the HEK293T cells and incubate at 37°C cell culture incubator for 4 h.
- Aspirate the transfection solution and replace it with fresh culture medium.
- Continue culturing the cells for 2 days.
- Collect the cell culture supernatant and replace it with fresh culture medium.
- The next day, collect the cell culture supernatant again and replace it with fresh culture medium.
- The following day, collect the final cell culture supernatant.
- Combine the supernatants from steps 3.9–3.11 into a 50-mL conical tube.
- Filter the combined supernatant through a 0.45 µm filter using a 60 mL syringe to remove debris.
- Centrifuge the filtered supernatant at 1,400 × g for 5 min at room temperature to remove dead cells.
- Transfer the cleared supernatant to ultracentrifuge tubes.
- Centrifuge at 100,000 × g for 70 min at 4°C to pellet the lentiviral particles.
- Carefully remove the supernatant without disturbing the pellet at the bottom of the tube.
- Resuspend the pellet in 600 µL of Opti-MEM medium by gently pipetting up and down.
- Divide the resuspended lentiviral particles into 50 μL aliquots and store them at -80°C until needed.
- Seed primary astrocytes in a 6-well plate and allow them to reach the 50%–70% confluency (Section 2).
- Thaw the required amounts of lentiviral particles on ice.
- Add 50 µL of lentiviral particles to each well, supplemented with 8 µg/mL Polybrene.
- Gently swirl the plate to ensure even distribution of the virus and Polybrene. Incubate the cells in a 37ºC cell culture incubator for 4–8 h.
- Aspirate the virus-containing medium carefully to avoid disturbing the cells.
- Replace the medium with fresh culture medium and continual culture for 2–3 days.
- Perform downstream analyses on the transduced cells using immunofluorescence microscopy to visualize intermediate filament network formation, or immunoblotting to assess GFAP expression.
NOTE: When handling lentiviral particles, it is crucial to use appropriate personal protective equipment (PPE) to ensure safety. Additionally, to maintain the integrity of the viral particles, avoid repeated freeze-thaw cycles.
4. Immunofluorescence microscopy
- Gently aspirate the culture medium from the wells containing coverslips with plated cells. Avoid disturbing the cells.
- Fix cells by adding one of the following fixative solutions: For primary astrocytes, use 3.2% (wt/vol) paraformaldehyde; for astrocyte-neuron culture, use 3.2% (wt/vol) paraformaldehyde and 4% (wt/vol) sucrose.
- Incubate the coverslips in the fixative for 15 min at room temperature. Unless otherwise noted, perform all subsequent steps at room temperature.
- Rinse the fixed cells three times with phosphate-buffered saline (PBS) to remove the fixative.
- Permeabilize the cells by incubating them in 0.2% (vol/vol) Triton X-100 prepared in blocking buffer (5% (vol/vol) normal goat serum in PBS) for 15 min.
- Rinse the permeabilized cells three times with PBS.
- Prepare the primary antibody solution by diluting the antibody in blocking buffer according to the manufacturer's recommended concentration.
- Incubate the coverslips in the primary antibody solution for at least 1 h at room temperature.
- Rinse the coverslips three times with PBS to remove unbound primary antibody.
- Prepare the secondary antibody solution by diluting goat anti-mouse and goat anti-rabbit secondary antibodies conjugated fluorophores in blocking buffer at a 1:500 dilution.
- Incubate the coverslips in the secondary antibody solution for 1 h at room temperature.
- Rinse the coverslips three times with PBS to remove unbound secondary antibody.
- Carefully transfer the coverslips onto glass slides using tweezers.
- Mount the coverslips with mounting medium to preserve fluorescence.
- Gently seal the edges of the coverslip with clear nail polish to prevent movement and evaporation.
- Allow the nail polish to dry completely before proceeding to imaging.
- The prepared slides are ready for imaging using an immunofluorescence or confocal microscope.
NOTE: To ensure the success of experiments, prepare all reagents, such as PBS, blocking buffer, and antibodies, fresh and maintain sterility. Handle coverslips with care to avoid damaging the cells or scratching the glass surface. Protect samples from light during antibody incubation and after mounting to prevent photobleaching of fluorescent signals. Additionally, optimize antibody concentrations and incubation times according to the specific experimental setup.
5. Immunoblotting
- Rinse the astrocytes twice with PBS to remove residual medium and debris.
- Place the plate or dish on ice to minimize protein degradation. Working one well at a time, completely aspirate the PBS.
- Add ice-cold radioimmunoprecipitation assay (RIPA) buffer containing protease and phosphatase inhibitors. For a 6-well plate, add 250 µL per well; for a 6-cm dish, add 500 µL per dish.
- Use a cell scraper to thoroughly scrape all astrocytes into the RIPA buffer (50 mM Tris, pH 8.0, 150 mM NaCl, 1% (wt/vol) NP-40, 5 mM ethylenediaminetetraacetic acid (EDTA), 0.5% (wt/vol) sodium deoxycholate, and 0.1% (wt/vol) SDS, 1 mM phenylmethylsulfonyl fluoride [PMSF]).
- Transfer the scraped cells into a 1-mL Dounce homogenizer placed on ice. Homogenize the cells by gently grinding them with the pestle.
- Incubate the homogenized cell lysates on ice for 10 min to ensure complete lysis. Save 20 µL of the total lysates to determine protein concentration by bicinchoninic acid (BCA) assay.
- Centrifuge the cell lysates at 13,500 × g at 4ºC for 10 min to pellet insoluble proteins.
- Carefully transfer the supernatant to a clean tube. Save 20 µL of supernatant to determine protein concentration by BCA assay.
- Concentrate the supernatant by performing methanol/chloroform precipitation.
- Resuspend the resulting precipitate in 0.1 mL of Laemmli sample buffer (25 mM Tris-HCl (pH 6.8), 1% (w/v) SDS, 12.5% (v/v) glycerol, 0.01% (w/v) bromophenol blue, 355 mM β-mercaptoethanol).
- Resuspend the pellet in Laemmli sample buffer and disperse it by sonication.
- Perform three cycles of sonication at 0.5-s pulses at 10% power. Keep the probe tip toward the bottom of the tube to avoid frothing.
- Perform a bicinchoninic acid (BCA) protein assay on both the RIPA supernatant and the total cell lysates.
- Load the protein samples onto a 12% or 15% sodium dodecyl sulfate polyacrylamide gel electrophoresis (SDS-PAGE) gel. Run the gel at a constant voltage of 200 V for 45 min.
- Transfer the proteins from the gel to a nitrocellulose membrane using a wet transfer system. Follow the manufacturer's instructions and transfer at 100 V for 70 min.
- Place the membrane in 5% (wt/vol) bovine serum albumin (BSA) dissolved in Tris-buffered saline with 0.1% (wt/vol) Tween-20 (TBST). Block for at least 1 h at room temperature with gentle shaking.
- Dilute the primary antibodies in TBST according to the manufacturer’s instructions. Incubate the membrane in the primary antibody solution overnight at 4ºC with gentle shaking.
- Rinse the membrane three times with TBST, each wash lasting 5 min.
- Dilute fluorophore- or horseradish peroxidase (HRP)-conjugated secondary antibodies in TBST at a 1:500 dilution (or as specified by the manufacturer).
- Incubate the membrane in the secondary antibody solution for 1 h at room temperature with gentle shaking.
- Rinse the membrane three times with TBST, each wash lasting 5 min.
- Develop the membrane using fluorescence or enhanced chemiluminescence (ECL) according to the manufacturer’s instructions.
- Visualize the protein bands using an imaging system.
NOTE: To prevent protein degradation, perform all steps on ice or at 4ºC, except for antibody incubation and blocking steps. Ensure that all buffers, reagents, and equipment are pre-chilled before use to maintain low temperatures throughout the process. Avoid overloading the gel to prevent smearing, and optimize antibody concentrations and incubation times to suit the specific experiment.
6. Preparation of primary neurons for coculture
- Euthanize the pregnant rat using carbon dioxide as an inhalant anesthetic. Dissect out the uterus and place it in a sterile Petri dish.
- Remove the brains from the fetuses and place them in a 6-cm dish containing dissection solution. Ensure the tissue remains submerged in the solution at all times to prevent drying.
- Dissect the cortices and remove meninges as described (step 2.7).
- Transfer the dissected tissue to a laminar flow hood.
- Aspirate the dissection solution using a 1 mL pipette and add fresh dissection solution to the dish.
- Mince the brain tissue into small pieces using a sterile scalpel blade.
- Transfer the minced tissue into 5 mL of neuronal dissociation medium (Table 1) pre-warmed to 37 ºC in a 15 mL tube.
- Incubate the tube in a 37 ºC water bath for 30 min, gently shaking the tube every 5 min to ensure proper enzyme-tissue interaction.
- Remove the tube from the water bath and allow the tissue to settle at the bottom of the tube. Carefully aspirate the supernatant using a 1 mL pipette tip without disturbing the tissue.
- Add 5 mL of pre-warmed dissection solution to the tube and invert it 5 times to rinse the tissue. Let the tube stand for 3 min to allow the tissue to settle, then repeat the washing process three times, each time using fresh dissection solution.
- After the final wash, remove the supernatant and add 2.5 mL of dissection solution and 2.5 mL of plating medium.
- Triturate the tissue by pipetting the solution up and down 10–15 times using a 10-mL pipette.
- Allow the tube to stand for 3 min to let the tissue settle. Transfer the supernatant (containing cells) to a new 50 mL conical tube.
- Add 5 mL of plating medium to the original tube containing the settled tissue.
- Triturate the tissue again 10–15 times using a 10-mL pipette until most chunks disappear.
- Pass the cell suspension through a sterile 40 µm cell strainer into a clean 50 mL conical tube containing 5 mL of plating medium.
- Centrifuge the filtered cell suspension at 200 × g for 5 min at room temperature.
- Remove the supernatant, then gently loosen the cell pellet by tapping the tube. Add 5 mL of pre-warmed plating medium and pipette up and down 10 times to resuspend the pellet.
- Count the cells as described previously (steps 2.21 and 2.22). Keep the cell suspension in a 37°C water bath during cell counting.
- Plate the neurons directly on top of the primary astrocytes in culture vessels as follows: for a 24-well plate, seed 1.45 × 10⁵ cells per well; for a 6-well plate, seed 5 × 10⁵ cells per well; for a 6-cm dish, seed 1 × 10⁶ cells per well.
- Place the plates or dishes in a tissue culture incubator set to 37ºC with 5% CO₂. Avoid leaving the cells at room temperature for extended periods to maintain viability.
- Replace the plating medium with neuronal maintenance medium 4 h after plating.
- Replace half of the medium with fresh neuronal maintenance medium every 3–4 days.
NOTE: The cocultured neurons will be ready for experiments at 7–10 days in vitro (DIV).
Results
A morphological overview of primary astrocyte cultures at various time points after isolation is presented in Figure 3. Following the plating of the cortical cell suspension, some astrocytes adhere to the surface of the culture dish within the first 24 h (Figure 3A). During the initial 3 to 5 days, the cultures contain cell debris and dying neurons (Figure 3B), as the culture medium is optimized to support the survival and growth of astrocytes. By 7 days post-plating, a monolayer of astrocytes begins to form, indicating successful establishment of the culture (Figure 3C). Dissociated neurons maintained in culture progress through distinct stages of differentiation, eventually developing well-defined neurites (Figure 3D–F). These neurons can be cultured as monolayers on glass coverslips or plated atop primary astrocytes for co-culture experiments, providing a versatile platform for studying astrocyte-neuron interactions.
Using primary astrocytes prepared from normal rats following this protocol, we examined the effects of AxD-associated GFAP mutations on IF network formation. To facilitate this study, WT GFAP (Figure 4A) and various forms of mutant GFAP, including E373K (Figure 4B), R376W (Figure 4C), D395Y (Figure 4D), D417A (Figure 4E), and Q426L (Figure 4F) GFAP were generated by site-directed mutagenesis with the use of the WT GFAP in pLEX-MCS lentiviral vector as a template (Supplementary File 1 and Supplementary Figure 1). Subsequently, the GFAP expression constructs were transduced into primary astrocytes via lentiviral infection. This infection process involved incubating the cells with lentiviruses at a multiplicity of infection (MOI) of 10, in the presence of 8 μg/mL polybrene. Under these conditions, immunofluorescence microscopy revealed that approximately 70%–80% of the astrocytes were successfully infected. The distribution of transduced GFAP in relation to endogenous rat GFAP was analyzed using double-label immunofluorescence microscopy. An anti-human GFAP monoclonal antibody was used to detect transduced human GFAP (Figure 4A–F, green channel), while a polyclonal anti-panGFAP antibody, which recognizes both rat GFAP and transduced human GFAP, was used to visualize the overall GFAP distribution (Figure 4A–F, red channel). In astrocytes expressing WT GFAP, filamentous networks were distributed throughout the cytoplasm (Figure 4A). In contrast, GFAP mutants (Figure 4B–F, green channel) predominantly formed cytoplasmic aggregates, which often disrupted and collapsed the endogenous IF networks (Figure 4B–F, red channel). The relative expression levels of the WT and mutant GFAP were determined by immunoblotting of the total cell lysates (Figure 4G). Transduction of either WT (Figure 4G, lane 2) or mutant (Figure 4G, lanes 3–7) GFAP generated proteins of the expected size at comparable levels. To assess whether the cytoplasmic aggregates formed by mutant GFAP exhibited altered solubility properties compared to WT protein, transduced astrocytes were extracted using radioimmunoprecipitation assay (RIPA) buffer16. Immunoblot analysis of the supernatant (Figure 4H) and pellet (Figure 4I) fractions revealed distinct differences in solubility. In cells expressing WT GFAP, most of the protein was readily extracted into the supernatant (Figure 4H, lane 2). In contrast, the mutant GFAPs demonstrated increased resistance to extraction, with the majority of the protein remaining in the pellet fraction (Figure 4I, lanes 3–7). These findings suggest that AxD-associated GFAP mutations promote the formation of insoluble aggregates, altering the solubility properties of GFAP in primary astrocytes.
To understand how the R237H GFAP mutation and overexpression affect filament organization and IF network formation, we analyzed the network-forming ability of GFAP in primary astrocytes derived from either WT rats or AxD model rats13 with a homozygous R237H knock-in mutation. Immunofluorescence confocal microscopy revealed that in WT astrocytes, GFAP formed well-organized filamentous networks distributed throughout the cytoplasm, which colocalized with vimentin IFs (Figure 5A). In contrast, approximately 70% of GFAP-positive cells contained prominent cytoplasmic aggregates in homozygous mutant astrocytes (Figure 5B). These aggregates frequently disrupted the vimentin IF networks, causing them to collapse into large perinuclear aggregates. Quantification of GFAP-positive cells containing aggregates is shown in Figure 5C. To assess GFAP expression at the protein level, total cell lysates were prepared from WT and homozygous mutant astrocytes. Immunoblotting using an anti-panGFAP antibody revealed a modest increase in total GFAP in homozygous mutant astrocytes (Figure 5D, lane 2), showing a 1.3-fold increase (Figure 5E) compared to WT astrocytes (Figure 5D, lane 1). To determine whether overexpression of mutant GFAP alters dynamic equilibrium between soluble and insoluble pools, supernatant, and pellet fractions were separated and analyzed by immunoblotting (Figure 5F). Quantification of GFAP distribution between the supernatant and pellet fractions is shown in Figure 5G. In WT astrocytes (Figure 5F, lanes 1 and 2), GFAP was roughly even distributed between the supernatant and pellet fractions. However, homozygous mutant astrocytes exhibited an increase in GFAP levels in the pellet fraction (Figure 5F, lane 4), indicating enhanced sequestration of GFAP into cytoplasmic aggregates. Notably, the accumulation of GFAP aggregates in homozygous mutant astrocytes also correlated with the detection of ubiquitinated GFAP species in the pellet fraction (Figure 5F, lane 4), further supporting the presence of pathologically modified GFAP in cytoplasmic aggregates in these cells.
Astrocytes play a critical role in supporting neuronal health and function. To determine whether the accumulation of the R237H GFAP mutant in astrocytes impacts neurons through non-cell-autonomous mechanisms, we utilized astrocyte–neuron cocultures. Rat embryonic day 18 (E18) primary neurons were seeded onto primary astrocyte cultured for 10–12 DIV and allowed to mature for an additional 10 days. The cocultures were then fixed and immunostained with antibodies against βIII tubulin to evaluate neuronal morphology. Neurons (Figure 6A) cocultured with WT astrocytes (Figure 6B) showed significantly longer neurite outgrowth (Figure 6C) compared to neurons (Figure 6D) cocultured with homozygous mutant astrocytes (Figure 6E). Quantitative analysis revealed that the neurite lengths of neurons cocultured with homozygous mutant astrocytes were reduced by 76% compared to neurons cocultured with WT astrocytes (Figure 6G). These findings indicate that the accumulation of mutant GFAP in astrocytes severely impairs their ability to support normal neuronal development and morphology. This disruption may contribute to the neurodegenerative phenotype characteristic of AxD.
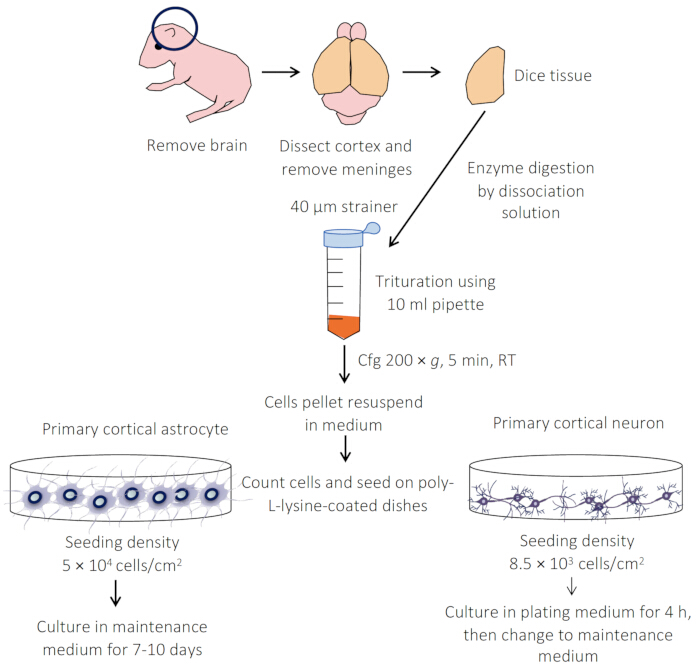
Figure 1: Overview of the protocols for preparing primary cultures of astrocytes and neurons. Cortices are carefully dissected, and the tissues are enzymatically digested using trypsin or papain. The dissociated cells are then plated onto the prepared coverslips, dishes, or plates. Both astrocytes and neurons are cultured in maintenance medium and can be sustained for up to 28 days. Please click here to view a larger version of this figure.
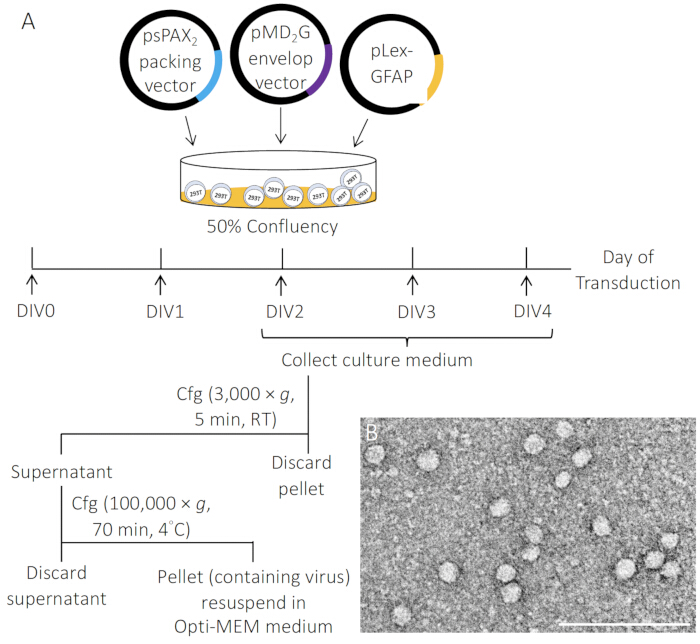
Figure 2: Schematic representation of lentiviral particle production. (A) Lentiviruses were generated by transient cotransfection of 293T cells with the pLEX-MCS–GFAP vector, psPAX2 packaging vector, and pMD2.G envelope vector at a 4:3:1 ratio, using transfection reagent. Culture supernatants containing lentiviral particles were harvested at 2–4 days in vitro (DIV), filtered through a 0.45-μm filter to remove debris, and concentrated via high-speed centrifugation. (B) Electron micrograph of lentiviral particles. Scale bar, 500 nm. Please click here to view a larger version of this figure.
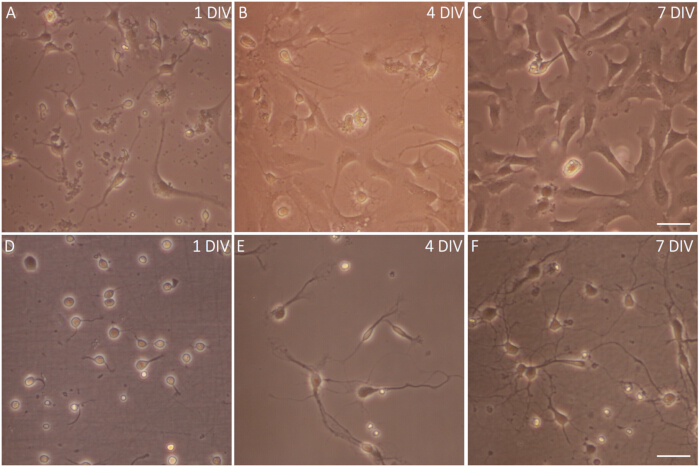
Figure 3: Phase contrast images of primary astrocytes and neurons. (A–C) Morphological overview of primary astrocyte cultures at different time points following isolation. (A) One day after plating, a portion of astrocytes have adhered to the bottom of the flask. (B) Four days after plating, an astrocyte layer begins to form. (C) By seven days after plating, the astrocyte layer has nearly reached confluency. Note that neurons are almost completely absent under these culture conditions. (D–F) Shortly after plating, (D) cortical neurons begin to extend a lamellar structure surrounding the cell body. (E) Over the subsequent days in culture, (F) neuronal differentiation progresses, and some neurons develop branched processes, indicating the formation of a more complex neuronal network. Scale bar, 20 μm. Please click here to view a larger version of this figure.
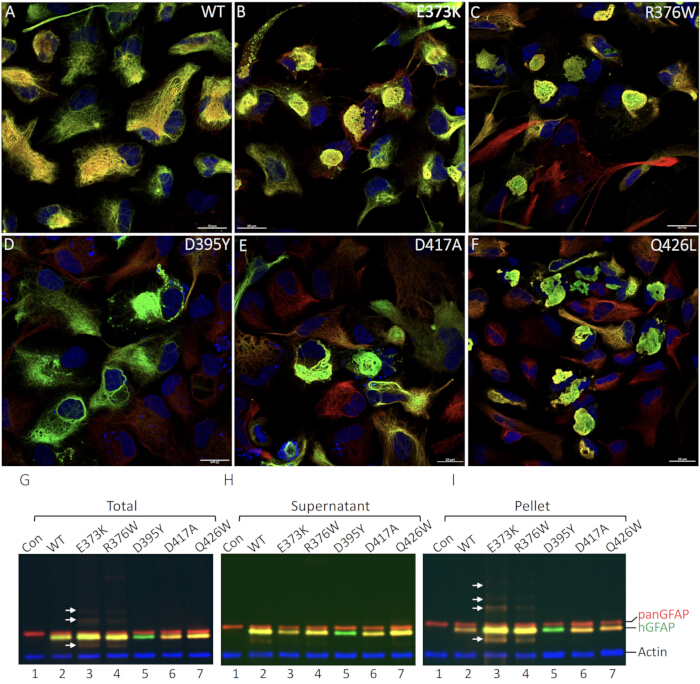
Figure 4: Filament organization and solubility properties of WT and mutant GFAP in primary astrocytes. (A–F) Primary rat astrocytes were transduced with either WT (A), or AxD-associated mutants, including E373K (B), R376W (C), D395Y (D), D417A (E), and Q426L (F) GFAP. Cells were fixed and immunostained with anti-human GFAP (green channel) and anti-panGFAP (red channel) antibodies. Merged images are shown, with nuclei visualized by staining with DAPI (blue channel). While WT GFAP assembled mainly into filamentous networks (A), the mutant GFAP proteins formed cytoplasmic aggregates in most transduced cells (B–F). Scale bar, 20 μm. (G–I) Analysis of expression levels and solubility properties of mutant GFAP. Primary astrocytes were either left untransduced (G–I, lane 1) or transduced with indicated GFAP constructs (G–I, lanes 2–7). At 72 h post-transduction, cells were lysed in radioimmunoprecipitation assay (RIPA) buffer, and the resulting total lysates (G), as well as the supernatant (H) and pellet (I) fractions were analyzed by immunoblotting using anti- human GFAP (green channel) and anti-panGFAP (red channel) antibodies. Blots probed with an anti-actin antibody (blue channel) were used as a loading control. The positions of human GFAP (hGFAP), total GFAP (panGFAP), and actin are indicated on the right. Note that astrocytes transduced with the D395Y GFAP mutation showed no staining in the red channel with the anti-panGFAP antibody, likely due to the disruption of the antibody's target epitope caused by the mutation. When astrocytes were transduced with E373K GFAP, immunoblot analysis revealed additional immunopositive bands (arrows) above and below the monomeric GFAP band. The lower bands are likely degradation products, while the upper bands correspond to GFAP modified by ubiquitination. Please click here to view a larger version of this figure.
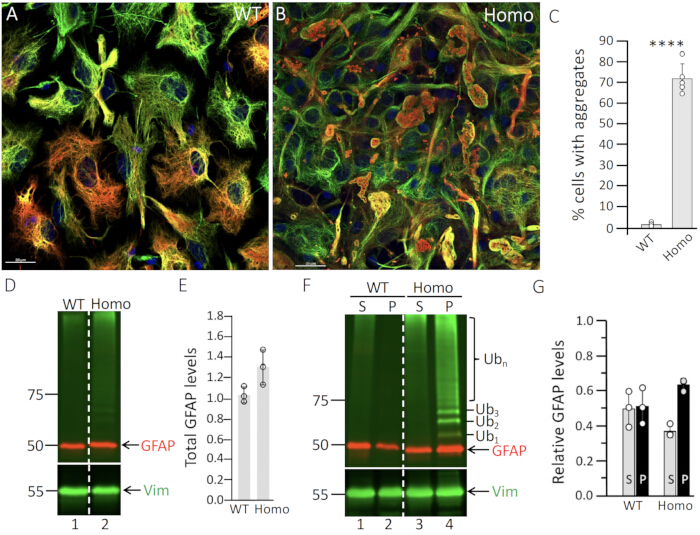
Figure 5: GFAP aggregation in astrocytes derived from homozygous mutant rats. Primary astrocytes derived from either (A) WT or (B) homozygous mutant rats were cultured for 14 DIV and subsequently processed for double-label immunofluorescence microscopy using antibodies against GFAP (red channel) and vimentin (green channel). Merged images are shown, with nuclei visualized by staining with DAPI (blue channel). Scale bar, 20 μm. In WT astrocytes (A), GFAP formed filamentous IF networks that colocalized with vimentin. In contrast, most homozygous mutant astrocytes contained GFAP aggregates that were double-positive for GFAP and vimentin (B). (C) Quantification of aggregate-bearing cells in WT and homozygous mutant astrocytes. Data represent the mean ± standard error (SE) from three independent experiments, presented as bar charts. Statistical analysis was performed using a two-tailed t-test; ****p < 0.0001. (D–G) Expression levels and solubility properties of GFAP in WT and homozygous mutant astrocytes. Primary astrocytes were extracted with RIPA buffer at 14 DIV. Total cell lysates (D), as well as supernatant (S) and pellet (P) fractions (F) were analyzed by immunoblotting using antibodies against GFAP (red channel), ubiquitin (green channel), and vimentin (green channel). Molecular mass markers (in kDa) are shown on the left, while the positions of GFAP, vimentin (Vim), and ubiquitin (Ub) are indicated on the right. Ub1–3 represent mono-, di-, and tri-ubiquitinated GFAP species, while Ubn indicates polyubiquitinated GFAP species. The dashed line in (D and F) indicates that lanes were run on the same gel but were noncontiguous. Note that ubiquitinated GFAP species were detected exclusively in the pellet fraction of homozygous mutant astrocytes (F, lane 4). Quantification of GFAP levels is shown in (E,G). Each white dot represents a biological replicate (n = 3). Data are presented as the mean ± SD. Please click here to view a larger version of this figure.
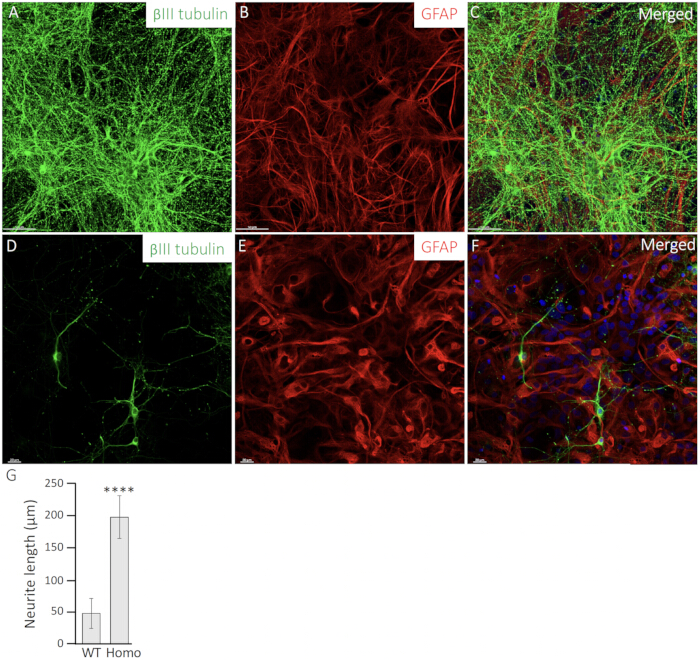
Figure 6: Mutant GFAP expression in homozygous mutant astrocytes alters neurite morphology. Primary neurons (A,D) were cocultured with either WT astrocytes (B) or homozygous mutant astrocytes (E). Neurons were immunostained with antibodies against βIII tubulin (green channel) to visualize neuronal morphology (A,D) while astrocytes (B,E) were labeled with antibodies against GFAP (red channel). Merged images are shown (C,F), with nuclei stained with DAPI (blue channel). Scale bar, 20 μm. (G) Neurite length of neurons co-cultured with either WT or Homo astrocytes was quantified and presented as bar charts. Data are expressed as mean ± SD. Statistical significance was assessed using a two-tailed t-test, with a significant difference between WT and R237H astrocytes denoted by ****P < 0.0001. Please click here to view a larger version of this figure.
| Component | Final concentration | |
| Dissection medium | 10× HBSS | 10% |
| 1 M HEPES , pH 7.4 | 10 mM | |
| 100× penicillin-streptomycin | 1× | |
| Dissociation medium | 2.5% Trypsin | 0.25% |
| 1 M HEPES , pH 7.4 | 10 mM | |
| 150 mM CaCl2 | 1.5 mM | |
| DNase I (15,000U) | 80 U | |
| 10× HBSS | 10% | |
| Maintenance medium | Fetal bovine serum | 10% |
| 100× penicillin-streptomycin | 1× | |
| MEM | 97% | |
| Neuronal dissociation medium | 100 mM sodium pyruvate | 1 mM |
| 10% Glucose | 0.10% | |
| 1 M HEPES, pH 7.4 | 10 mM | |
| 0.5 M EDTA | 5 mM | |
| 2 mg/mL Cysteine | 0.2 mg | |
| Papain | 67 U | |
| 150 mM CaCl2 | 1.5 mM | |
| DNase I (15,000U) | 80 U | |
| Neuronal plating medium | Fetal bovine serum | 5% |
| GlutaMax-1 | 1% | |
| 10% Glucose | 0.06% | |
| 100× penicillin-streptomycin | 1× | |
| Neuronal maintenance medium | Neurobasal medium | 97% |
| B27 | 1/50 | |
| GlutaMax-1 | 0.5 mM | |
| 100× penicillin-streptomycin | 1% | |
| 293T cell culture medium | DMEM with 10% | 90% |
| Fetal calf serum | 10% | |
| Glutamine | 2 mM | |
| 100× Penicillin-streptomycin | 1% |
Table 1: Composition of media.
Supplementary File 1: GFAP mutant lentiviral constructs. GFAP mutations were generated through site-directed mutagenesis. Please click here to download this file.
Supplementary Figure 1: A schematic of GFAP mutations generated by site-directed mutagenesis.Please click here to download this file.
Discussion
Primary astrocyte cultures have significantly advanced our understanding of astrocytes' roles in health and disease. Building on foundational work by McCarthy and de Vellis21, these cultures are critical for studying AxD as they allow for detailed exploration of astrocyte-specific processes, particularly the effects of AxD mutations on GFAP assembly and aggregate formation.
The successful isolation and culture of primary astrocytes depend on several key steps that influence cell viability, purity, and reproducibility. Rapid and precise dissection of brain tissue, coupled with careful optimization of trypsin concentration and digestion duration, is essential to prevent tissue degradation and ensure complete dissociation into a single-cell suspension. Gentle trituration and the use of a sterile cell strainer further enhance cell purity by removing debris and aggregates. These steps, followed by low-speed centrifugation and careful resuspension in fresh culture medium, help maintain high cell viability and growth, minimizing variability and contamination. Once isolated, the choice of surface coating is crucial for ensuring robust cell attachment and achieving experimental objectives. Poly-L-lysine (PLL) is often used for its cost-effectiveness and ability to promote strong cell adhesion, but other coatings like laminin22,23and collagen24 may better mimic in vivo conditions or facilitate specific cellular studies. Understanding these effects allows researchers to design experiments that yield relevant and reproducible results.
Despite its technical challenges, this protocol remains indispensable, offering a physiologically relevant model superior to immortalized cell lines. However, it is important to acknowledge several limitations: 1) The isolation and culturing process is technically demanding and requires specialized skills and equipment. Compared to established cell lines, this method is more time-intensive and prone to variability, which can impact experimental reproducibility. 2) Astrocytes exhibit significant regional heterogeneity in vivo25,26, with distinct populations found in different areas of the CNS. Primary astrocyte cultures are typically derived from specific brain regions, such as the cortex or hippocampus, and may not fully capture the diversity of astrocyte populations across the CNS. 3) The isolation and culture process often induce a reactive state in astrocytes due to traumatized procedure, enzymatic digestion, and exposure to artificial culture conditions. While this reactive state is useful for studying reactive astrogliosis, it may not accurately represent the physiological responses of astrocytes to injury or disease in vivo. This can lead to non-physiological artifacts that may skew experimental results. 4) Primary astrocyte cultures lack the complex brain microenvironment present in vivo, including interactions with neurons, microglia, endothelial cells, and extracellular matrix components. These interactions are critical for astrocyte function and their response to stressors, and their absence limits the ability to fully replicate in vivo behavior. 5) Primary astrocytes derived from rodents, such as rats or mice, may differ significantly in their molecular and functional characteristics compared to human astrocytes27,28. These factors can introduce non-physiological artifacts, highlighting the need for careful experimental design and interpretation. To address these challenges, additional purification steps, such as magnetic cell sorting29 or FACS-based isolation30, could yield purer astrocyte populations. While these methods increase protocol complexity, they allow for more accurate studies of astrocyte-specific functions.
Unlike some of these advanced protocols, the method described here relies on commonly available cell culture materials and avoids the need for expensive equipment. In addition, this protocol simplifies the preparation of primary cultures by directly plating cells post-isolation, without additional shaking or subculturing31. This approach may better preserve GFAP expression and the reactive states of astrocytes. It is easy to execute, reproducible, and applicable to cells from any CNS region, providing a versatile tool for researchers. Primary astrocytes enriched from this protocol retain their native cellular architecture, signaling pathways, and functional properties, making them suitable for a wide range of cell biological and biochemical studies16,17,32. With moderate technical expertise and careful handling, these cultures can be maintained with high viability and provide valuable insights into astrocyte morphology, function, and behavior. Although the protocol is specifically designed for isolating astrocytes from the cortices of postnatal rats, it can be easily adapted to isolate astrocytes from mice or other brain regions, such as the hippocampus or spinal cord. This flexibility makes the method highly versatile for addressing diverse research questions in neuroscience. For disease modeling, astrocytes derived from AxD model rats can replicate disease-associated GFAP mutations, Rosenthal fiber formation, and pathological responses to stress33, providing a powerful platform for studying AxD mechanisms.
Primary astrocytes derived from normal rats can be genetically manipulated through lentiviral transduction to explore the effects of AxD mutations on GFAP assembly and aggregate formation9,33. A critical step in this process is the selection of an appropriate extraction buffer, as it significantly impacts the assessment of the solubility properties of mutant GFAP in transduced astrocytes34. Radioimmunoprecipitation assay (RIPA) buffer, with its combination of ionic and non-ionic detergents, effectively solubilizes GFAP filaments while preserving aggregates10, facilitating comprehensive biochemical analyses central to the research objectives of this study.
Overall, primary astrocyte cultures provide a versatile and powerful platform for studying astrocyte biology and disease mechanisms, particularly in AxD. By optimizing protocols and addressing limitations, researchers can enhance reproducibility and reliability, making this method essential for advancing our understanding of astrocyte function and identifying therapeutic targets for GFAP-related astrocytopathy.
Disclosures
The authors have nothing to disclose.
Acknowledgements
We thank Dr. Tracy Hagemann (Waisman Center, University of Wisconsin-Madison) for providing the R237H knock-in rats. This work was supported by grants from the National Science and Technology Council (111-2320-B-007-008 and 112-2320-B-007-006 to N.-H. L. and M.-D.P.). The authors are grateful for the support from the confocal imaging core in National Tsing Hua University, Taiwan, which is supported by the National Science and Technology Council (NSTC-114-2740-M-007-001). We also thank the Instrument Center in the National Tsing Hua University for access to the electron microscope.
Materials
| Name | Company | Catalog Number | Comments |
|---|---|---|---|
| 1 M HEPES , pH 7.4 | Gibco | 15630-080 | |
| 100× penicillin-streptomycin | Gibco | 15140-122 | |
| 10× Hank's Balanced Salt Solution (HBSS) | Gibco | 14180-046 | |
| 2.5% Trypsin | Gibco | 15090046 | |
| 30% Acrylamide/Bis solution 37.5:1 | Biorad | 1610158 | |
| anti-GFAP antibody | Cell Signaling Technology | 12389 | |
| anti-human GFAP antibody | Biolegend | 837202 | Clone SMI21 |
| anti-panGFAP antibody | Agilent | GA524 | |
| anti-ubiquitin antibody | Millipore | ST 1200 | Clone FK2 |
| anti-vimentin antibody | Sigma-Aldrich | V6389 | Clone V9 |
| anti-β III tubulin antibody | Biolegend | 801201 | |
| B27 supplement | Gibco | 17504044 | |
| Cacium chloride (CaCl2) | Arcos | 34961 | |
| Cell culture-related reagents | |||
| ChemiDoc Imaging System | BioRad | NA | |
| Coomassie blue dye | USB | 32826 | |
| Cysteine | Sigma-Aldrich | C1276 | |
| Dithiothreitol (DTT) | UR | DTT | |
| DNase I | Sigma-Aldrich | D5025 | |
| Dounce homogenizer | Wheaton | ||
| Dulbecco's modified Eagle Medium (DMEM) | Corning | 10-013-CM | |
| Endotoxin-free plasmid DNA preparation kit | Qiagen | 12943 | |
| Enhanced chemiluminescent (ECL) reagent | PerkinElmer | NEL 105001 | |
| Ethylenediaminetetraacetic acid (EDTA) | USB | 15699 | |
| Fetal bovine serum | Gibco | A5209401 | |
| Glucose | Sigma-Aldrich | G8270 | |
| GlutaMax | Gibco | 35050-061 | |
| Minimal essential medium (MEM) | Corning | 10-010-CVR | |
| NaCl | Honeywell | 31434S | |
| Neurobasal medium | Gibco | 21103049 | |
| Optima XE-90 Ultracentrifuge | Beckman | NA | |
| Papain | Worthington | LS003126 | |
| Pnenylmethylsulfonyl fluoride (PMSF) | ACROS ORGANICS | 215740050 | |
| Polyehtyleneimine | Sigma-Aldrich | P3143 | |
| Poly-L-lysine | Sigma-Aldrich | P6516 | |
| Potassium chloride (KCl) | Honeywell | 12636 | |
| Rhodamine anti-actin antibody | BioRad | 12004164 | |
| Sodium dodecyl sulfate (SDS) | USB | 75819 | |
| Sodium pyruvate | Gibco | 11360070 | |
| StarBright Blue 520 goat anti-mouse IgG | Biorad | 12005867 | |
| StarBright Blue 700 goat anti-rabbit IgG | BioRad | 12004161 | |
| Sucrose | Sigma-Aldrich | S5391 | |
| SW-28 Rotor | Beckman | NA | |
| TansIT-LT1 Transfection reagent | Mirus | MR-MIR-2300 | |
| TEMED | USB | 76320 | |
| Tris(hydroxymrthyl)aminomethane (Tris) | USB | 75825 | |
| Triton X-100 | Sigma-Aldrich | T9284 | |
| β-mercaptoethanol | Sigma-Aldrich | M3148 |
References
- Verkhratsky A, Nedergaard M. Physiology of astroglia. Physiol Rev. 2018;98(1):239-389.
- Eroglu C, Barres BA. Regulation of synaptic connectivity by glia. Nature. 2010;468(7321):223-31.
- Sofroniew MV. Astrogliosis. Cold Spring Harb Perspect Biol. 2014;7(2):a020420.
- Sofroniew MV, Vinters HV. Astrocytes: biology and pathology. Acta Neuropathol. 2010;119(1):7-35.
- Brandebura AN, Paumier A, Onur TS, Allen NJ. Astrocyte contribution to dysfunction, risk and progression in neurodegenerative disorders. Nat Rev Neurosci. 2023;24(1):23-39.
- Sofroniew MV. Molecular dissection of reactive astrogliosis and glial scar formation. Trends Neurosci. 2009;32(12):638-47.
- Hol EM, Pekny M. Glial fibrillary acidic protein (GFAP) and the astrocyte intermediate filament system in diseases of the central nervous system. Curr Opin Cell Biol. 2015;32:121-30.
- Brenner M, et al. Mutations in GFAP, encoding glial fibrillary acidic protein, are associated with Alexander disease. Nat Genet. 2001;27(1):117-20.
- Lin NH, Jian WS, Perng MD. Deletions in glial fibrillary acidic protein leading to alterations in intermediate filament assembly and network formation. Int J Mol Sci. 2025;26(5):1913.
- Yang AW, et al. Effects of Alexander disease-associated mutations on the assembly and organization of GFAP intermediate filaments. Mol Biol Cell. 2022;33(8):ar69.
- Lin NH, Perng MD. Experimental approaches for biochemical analysis of glial fibrillary acidic protein and its disease-associated variants. J Vis Exp. 2025;(225).
- Hagemann TL, Connor JX, Messing A. Alexander disease-associated glial fibrillary acidic protein mutations in mice induce Rosenthal fiber formation and a white matter stress response. J Neurosci. 2006;26(43):11162-73.
- Hagemann TL, et al. Antisense therapy in a rat model of Alexander disease reverses GFAP pathology, white matter deficits, and motor impairment. Sci Transl Med. 2021;13(620):eabg4711.
- Hagemann TL. Alexander disease: models, mechanisms, and medicine. Curr Opin Neurobiol. 2022;72:140-7.
- Lange SC, et al. Primary cultures of astrocytes: their value in understanding astrocytes in health and disease. Neurochem Res. 2012;37(11):2569-88.
- Lin NH, Yang AW, Chang CH, Perng MD. Elevated GFAP isoform expression promotes protein aggregation and compromises astrocyte function. FASEB J. 2021;35(5):e21614.
- Lin NH, Jian WS, Snider N, Perng MD. Glial fibrillary acidic protein is pathologically modified in Alexander disease. J Biol Chem. 2024;300(7):107402.
- Goya-Iglesias N, et al. Alexander disease mutations differentially sensitize glial fibrillary acidic protein (GFAP) to posttranslational modifications and network disruption by oxidants. Redox Biol. 2026;92:104103.
- Olabarria M, Putilina M, Riemer EC, Goldman JE. Astrocyte pathology in Alexander disease causes a marked inflammatory environment. Acta Neuropathol. 2015;130(4):469-86.
- Lee HG, Wheeler MA, Quintana FJ. Function and therapeutic value of astrocytes in neurological diseases. Nat Rev Drug Discov. 2022;21(5):339-58.
- McCarthy KD, de Vellis J. Preparation of separate astroglial and oligodendroglial cell cultures from rat cerebral tissue. J Cell Biol. 1980;85(3):890-902.
- Olsen ML, et al. Functional expression of Kir4.1 channels in spinal cord astrocytes. Glia. 2006;53(5):516-28.
- Strack A, et al. Chemokines are differentially expressed by astrocytes, microglia and inflammatory leukocytes in Toxoplasma encephalitis and critically regulated by interferon-gamma. Acta Neuropathol. 2002;103(5):458-68.
- East E, Golding JP, Phillips JB. A versatile 3D culture model facilitates monitoring of astrocytes undergoing reactive gliosis. J Tissue Eng Regen Med. 2009;3(8):634-46.
- Zhang Y, Barres BA. Astrocyte heterogeneity: an underappreciated topic in neurobiology. Curr Opin Neurobiol. 2010;20(5):588-94.
- Oberheim NA, Goldman SA, Nedergaard M. Heterogeneity of astrocytic form and function. Methods Mol Biol. 2012;814:23-45.
- Vasile F, Dossi E, Rouach N. Human astrocytes: structure and functions in the healthy brain. Brain Struct Funct. 2017;222(5):2017-29.
- Oberheim NA, et al. Uniquely hominid features of adult human astrocytes. J Neurosci. 2009;29(10):3276-87.
- Peterson IL, et al. Isolation and monoculture of functional primary astrocytes from the adult mouse spinal cord. Front Neurosci. 2024;18:1367473.
- Agalave NM, et al. Isolation, culture, and downstream characterization of primary microglia and astrocytes from adult rodent brain and spinal cord. J Neurosci Methods. 2020;340:108742.
- Du F, et al. Purity, cell viability, expression of GFAP and bystin in astrocytes cultured by different procedures. J Cell Biochem. 2010;109(1):30-7.
- Lin NH, et al. The role of gigaxonin in the degradation of the glial-specific intermediate filament protein GFAP. Mol Biol Cell. 2016;27(25):3980-90.
- Lin NH, Perng MD. Synergistic effects of glial fibrillary acidic protein mutation and overexpression in the pathogenesis of Alexander disease. Int J Mol Sci. 2026;27(10).
- Perng M, et al. The Alexander disease-causing glial fibrillary acidic protein mutant, R416W, accumulates into Rosenthal fibers by a pathway that involves filament aggregation and the association of alpha B-crystallin and HSP27. Am J Hum Genet. 2006;79(2):197-213.
Reprints and Permissions
This article has been published
Video Coming Soon