Exercise frequency and consistency, but not duration, were associated with cognitive flexibility through Perceived Exercise-Related Cognitive Benefits (PECB) and psychological well-being. Exercise duration was not directly associated with cognitive flexibility but showed an indirect association through psychological well-being.
Research Article
Exercise, Perceived Exercise-Related Cognitive Benefits, and Cognitive Flexibility: A Cross-Sectional Study Among Chinese University Students
In This Article
Summary
Abstract
This cross-sectional study examined the associations between exercise frequency, duration, consistency, and cognitive flexibility among students at one Chinese university. Guided by a psychological perspective, the study evaluated the parallel mediating roles of Perceived Exercise-Related Cognitive Benefits (PECB), a self-reported psychological construct reflecting perceived cognitive benefits associated with exercise, and psychological well-being, together with the moderating role of exercise intensity. A total of 398 university students were recruited through purposive sampling and completed self-report questionnaires assessing exercise behavior, PECB, psychological well-being, cognitive flexibility, and exercise intensity. Data were analyzed using Partial Least Squares Structural Equation Modeling (PLS-SEM). Exercise frequency (β = 0.18, p < 0.001) and exercise consistency (β = 0.15, p = 0.002) were positively associated with cognitive flexibility, whereas exercise duration was not significantly associated (β = 0.06, p = 0.312). Significant indirect associations through PECB linked exercise frequency (β = 0.102) and consistency (β = 0.125), but not duration, to cognitive flexibility. Psychological well-being showed significant indirect associations with all three exercise dimensions, including exercise duration (indirect β = 0.092). Exercise intensity significantly moderated the associations of PECB (β = 0.22) and psychological well-being (β = 0.19) with cognitive flexibility. These findings suggest that greater exercise frequency and consistency, rather than exercise duration, were associated with greater self-reported cognitive flexibility. Future longitudinal and experimental studies are needed to further examine these associations and clarify the psychological processes underlying the relationships among exercise, perceived cognitive benefits, psychological well-being, and cognitive flexibility.
Introduction
Physical exercise has been consistently associated with cognitive health and psychological well-being. Regular physical activity has been positively associated with mood, attention, memory, and other cognitive processes and negatively associated with stress and depressive symptoms1. Cognitive flexibility refers to the ability to adapt thinking and behavior in response to changing demands, stimuli, and situations, including generating alternative plans, evaluating available evidence, and selecting appropriate actions2. However, the relationship between exercise and cognitive functioning may depend on how exercise is performed. Exercise frequency, duration, consistency, and intensity represent distinct characteristics that may show different associations with cognitive and psychological outcomes. Irregular or excessive exercise may also be associated with less favorable physical and psychological outcomes3. Activities such as walking, jogging, cycling, hiking, and exposure to new environments have been associated with cognitive functioning and personality development4.
Several physiological and psychological mechanisms have been proposed to explain associations between exercise and cognitive functioning. Perceived Exercise-Related Cognitive Benefits (PECB) is a self-reported psychological construct reflecting an individual's subjective perception of cognitive benefits associated with exercise, including perceived improvements in mental clarity, cognitive energy, adaptability, and cognitive efficiency5. In the present study, PECB was assessed using a psychological questionnaire and was examined as a perceived cognitive benefit of exercise, rather than as a physiological or biological measure. Previous research has examined associations between exercise, cognitive functioning, and perceived cognitive benefits, providing a basis for considering PECB as a potential psychological pathway linking exercise with cognitive outcomes6. Psychological well-being is another potentially relevant pathway because physical activity and psychological well-being have been associated with stress, anxiety, depressive symptoms, and cognitive functioning7. Accordingly, the present study examines PECB as a perceived psychological construct that may help explain the relationship between exercise and cognitive functioning8.
Despite growing interest in exercise and cognitive flexibility, several gaps remain. First, previous research has produced mixed findings regarding the association between physical activity and cognitive flexibility9. Second, demographic characteristics may contribute to differences in these associations10. Third, much previous research has focused on exercise as general or single-dimensional behavior, whereas frequency, duration, consistency, and intensity may represent distinct aspects of exercise behaviour11. In addition, the potential roles of self-reported PECB and psychological well-being as parallel mediating variables, together with exercise intensity as a moderating factor, remain insufficiently examined within an integrated model. Although PECB-related processes have been proposed as potentially relevant to exercise cognition relationships, empirical evidence remains limited and indirect12.
The present study addresses these gaps by examining the associations between exercise frequency, duration, and consistency with cognitive flexibility among university students, while simultaneously evaluating the statistical mediating roles of PECB and psychological well-being and the moderating role of exercise intensity. The study therefore contributes an integrated framework for examining behavioral, perceived neurocognitive, and psychological pathways associated with cognitive flexibility. Importantly, exercise behavior was assessed through self-reported recall rather than objective monitoring such as accelerometry; therefore, the study examines perceived patterns of exercise behavior rather than objectively verified long-term adherence.
The model is informed by a behavioural–psychological perspective, which views human functioning as an interaction between behavioral and psychological factors. In the present study, the focus is on exercise, psychological well-being, Perceived Exercise-Related Cognitive Benefits (PECB), and cognitive flexibility13. Within this framework, exercise characteristics represent behavioral factors, PECB represents a perceived psychological construct, psychological well-being represents a psychological pathway, and cognitive flexibility represents the cognitive outcome. Exercise intensity is examined as a potential moderator of the associations between these internal states and cognitive flexibility14,15. Accordingly, the study tests whether exercise characteristics are associated with cognitive flexibility, both directly and indirectly through PECB and psychological well-being, and whether these associations differ by exercise intensity.
Regular physical activity has been consistently associated with cognitive health, particularly cognitive flexibility, defined as the ability to adapt thinking and behavior in response to changing environmental demands16. Repeated exercise may support cognitive functioning by promoting neural adaptability and strengthening the cognitive processes involved in flexible thinking17. From the perspective of Hebbian learning, repeated activation of neural circuits may strengthen neural connections, suggesting that greater exercise frequency can contribute to more sustained improvements in cognitive functioning. This provides a theoretical basis for examining the relationship between regular exercise and Perceived Exercise-Related Cognitive Benefits (PECB). Previous research has examined the association between exercise and perceived cognitive benefits, with empirical evidence suggesting that PECB may increase following repeated exercise sessions18. Regular exercise may therefore contribute to more sustained perceived cognitive benefits and improvements in cognitive functioning, whereas occasional exercise may produce more temporary effects19. Exercise dose may also influence these outcomes, as longer and more frequent exercise may provide greater opportunities for cognitive and psychological benefits to develop and become established over time20. Exercise consistency, defined as maintaining regular exercise over time, is also consistent with principles of habit formation, whereby repeated and stable behaviors may promote more sustained exercise-related benefits than inconsistent exercise patterns21.
The relationship between PECB and cognitive flexibility can further be understood through perspectives on neuroplasticity and executive functioning. Higher perceived cognitive benefits from exercise may be associated with greater cognitive flexibility, learning, and memory, providing a basis for examining PECB as a potential explanatory factor in the relationship between exercise and cognitive flexibility22.
The current study does not directly measure objective changes in cognitive or neurobiological functioning. Rather, PECB is assessed as a self-reported psychological construct using a validated scale administered in relation to exercise23. Individuals may develop perceptions of cognitive functioning through subjective experiences following exercise, such as feeling more mentally clear, alert, focused, or cognitively capable, as well as through learned associations between exercise and perceived cognitive benefits24. Accordingly, PECB in the present study refers to individuals’ perceived cognitive benefits or perceived availability of cognitive resources following exercise, rather than to objectively measured cognitive or physiological changes. This distinction is important because perceived cognitive benefits and actual cognitive changes represent related but conceptually different constructs25. The PECB literature is therefore used to provide a theoretical basis for understanding how exercise-related experiences may shape individuals’ perceptions of their cognitive functioning, rather than as evidence that the present study directly measures objective neurocognitive or biological changes. In this study, PECB is treated specifically as a psychological construct that may help explain the relationship between exercise and cognitive flexibility26.
Psychological pathways, specifically exercise frequency based on the self‑determination theory and affect-regulation approaches, have been studied. Regular exercise can meet basic psychological needs (autonomy, competence, relatedness) and there are links between regular exercise and decreased levels of anxiety and depression, but also increased mood and life satisfaction27. Duration of exercise as per stress reduction theory, facilitates longer dissociation from stressors, moderate to longer shows an increase in mood benefits, and a decrease in stress28. Consistency, based on routine activity theory, can offer structure and predictability, enhancing the mental health and emotional stability of a person over time. The broaden-and-build theory29 posits that positive emotional experiences expand cognitive processes and lead to increased flexibility, and that people who experience these positive emotions have greater cognitive flexibility and problem-solving skills30. The embodied cognition theory also suggests that exercise has a direct effect on cognition by stimulating body and brain systems, improving blood flow, neural activation, and executive functioning31. However, some studies have found positive relationships between all three exercise dimensions (frequency, duration, and consistency) and cognitive flexibility, both directly and indirectly via psychological mediators32. Interestingly, the evidence for exercise duration is inconsistent as some studies have reported no direct link to cognitive flexibility when controlling for frequency or consistency, meaning that duration may be associated with cognitive flexibility indirectly through psychological well-being33. The present study, therefore, examines duration as a potential indirect predictor rather than assuming a direct effect. Exercise intensity has been explained by arousal theory and the Yerkes–Dodson law, with moderate‑to‑high intensity exercise typically producing stronger cognitive and neurological effects than low intensity34. Intensity may amplify PECB and psychological well‑being responses, potentially strengthening their associations with cognitive flexibility35. However, the moderating role of intensity on the pathways from PECB and psychological well‑being to cognitive flexibility remains underexplored36. Based on the above arguments, the following hypotheses are proposed:
Direct effects
- H1: Exercise frequency (H1a), duration (H1b), and consistency (H1c) are positively associated with PECB.
- H2: Exercise frequency (H2a), duration (H2b), and consistency (H2c) are positively associated with psychological well-being.
- H3–H4: PECB (H3) and psychological well-being (H4) are positively associated with cognitive flexibility.
- H5: Exercise frequency (H5a), duration (H5b), and consistency (H5c) are positively associated with cognitive flexibility.
Mediation effects
- H6: PECB mediates the association between exercise characteristics—frequency (H6a), duration (H6b), and consistency (H6c)—and cognitive flexibility.
- H7: Psychological well-being mediates the association between exercise characteristics—frequency (H7a), duration (H7b), and consistency (H7c)—and cognitive flexibility.
Moderation effects
- H8: Exercise intensity moderates the positive associations of PECB (H8a) and psychological well-being (H8b) with cognitive flexibility, such that these associations are stronger at higher levels of intensity.
Figure 1 presents the research model of the present study, showing all study variables and their hypothesized relationships.
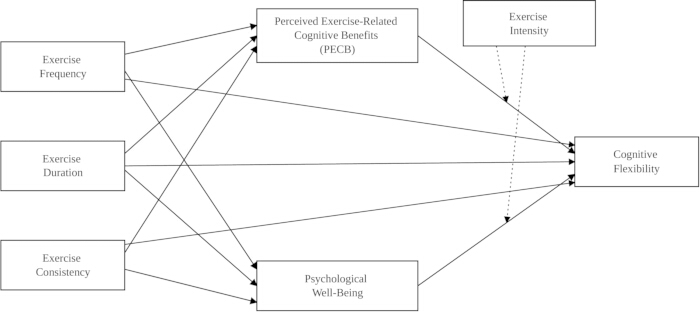
Figure 1: Research framework. This figure presents the proposed research framework, showing the study variables and the hypothesized relationships among exercise characteristics, perceived exercise-related cognitive benefits (PECB), psychological well-being, exercise intensity, and cognitive flexibility. Please click here to view a larger version of this figure.
Protocol
Ethical approval was granted by the Institutional Review Board (IRB) of Yunnan University of Finance and Economics, China (Approval No. YNUFE-IRB-2025-0074; Supplementary File 1). The IRB approved an oral informed-consent procedure rather than requiring written consent. Before participation, eligible students were informed about the purpose and procedures of the study, the voluntary nature of participation, their right to decline or discontinue participation without academic consequences, and the measures used to protect the confidentiality of their information. Oral consent was obtained from all participants before questionnaire completion. No personally identifying information was collected for analysis. Questionnaire responses were assigned identification codes, and the dataset was stored in a password-protected file accessible only to the research team. Results were reported in aggregate form, preventing individual participants from being identified. Participation or non-participation had no effect on students' academic standing or their relationship with the School of Marxism.
Research design
This study employed a quantitative, cross-sectional survey design informed by a positivist research philosophy to examine associations among exercise characteristics, PECB, psychological well-being, and cognitive flexibility among university students in China. Data were collected at a single time point; therefore, the findings represent associations rather than causal relationships. The individual student was the unit of analysis. A survey methodology was selected because it enabled standardized collection of self-reported information from a relatively large sample of university students.
Participants and recruitment
Participants were recruited from participating universities in China during March–May 2025. Recruitment was conducted in person on participating university campuses.
Inclusion criteria
Students were eligible if they were currently enrolled at a participating Chinese university, regularly participated in exercise, were able to understand and complete the questionnaire, and provided informed oral consent before participation. For this study, regular exercise was operationally defined as engaging in planned physical activity at least 3 times per week for a minimum of 30 minutes per session over the past 3 months. This criterion was applied consistently during participant recruitment
Exclusion criteria
Students were excluded if they did not meet the eligibility criteria, declined oral consent, submitted substantially incomplete questionnaires (> 5% missing data), demonstrated invalid or patterned responses, or submitted duplicate responses. The recruitment and screening process resulted in 402 initial responses, of which 4 participants were excluded (2 for incomplete responses, 1 for patterned responding, and 1 for submitting duplicate responses). The final analytical sample consisted of 398 valid responses.
Questionnaire development and measurement
A structured questionnaire was adapted for Chinese university students. The original English measures were translated into simplified Chinese using forward and back translation by two independent bilingual researchers. Translation discrepancies were resolved through discussion. Four academicians and three sport-industry professionals subsequently reviewed the questionnaire for content relevance, clarity, and contextual suitability. Except for exercise-behaviour questions requiring numerical or categorical responses, psychometric items were rated on a 7-point Likert scale from 1 = strongly disagree to 7 = strongly agree. Higher composite scores indicated higher levels of the construct. Exercise characteristics, including frequency, duration, consistency, and intensity, were assessed using adapted IPAQ Short Form items. PECB was measured using five study-developed items informed by Dinoff et al.37 and Loprinzi38. Items assessed perceived mental clarity, cognitive energy, focus, and adaptability following exercise. Responses were averaged, with higher scores indicating greater perceived benefits. No items were reverse-scored. Psychological well-being was assessed using a study-adapted 14-item selection from Ryff’s Scales of Psychological Well-Being39, covering self-acceptance, environmental mastery, and personal growth. Cognitive flexibility was assessed using the original 20-item Cognitive Flexibility Inventory developed by Dennis and Vander Wal40, which measures Control (13 items) and Alternatives (7 items).
Perceived neurocognitive resource availability
PECB was assessed using a five-item measure developed specifically for this study and informed by the literature on exercise-related cognitive outcomes, including Dinoff et al.37 and Loprinzi38 . The items measured perceived cognitive clarity, energy, focus, and adaptability following exercise. Responses were averaged, with higher scores indicating greater perceived benefits. The measure underwent expert review and pilot testing with 40 students.
Exercise characteristics
Study-adapted items informed by the International Physical Activity Questionnaire–Short Form (IPAQ-SF)41 and related exercise research42,43 assessed frequency (5 items), duration (4 items), consistency (5 items), and intensity (5 items). Frequency and duration used a 7-day recall period, while consistency covered the preceding three months. Items were averaged and analysed separately; MET-min/week was not calculated. The measurement model included five frequency indicators, four duration indicators, five consistency indicators, and five intensity indicators. Frequency and duration referred to exercise undertaken during the preceding seven days, while consistency assessed exercise regularity over the preceding three months. Intensity items assessed perceived exercise exertion.
Pilot testing
A preliminary pilot test was conducted with 40 university students who met the eligibility criteria but were excluded from the final sample. Following pilot feedback, two revisions were made: ambiguous item wording was simplified to improve comprehension, and a redundant item was rephrased to distinguish it from a conceptually similar item.
Survey administration
The final questionnaire was administered in person at Yunnan University of Finance and Economics, Kunming, Yunnan Province, China, using a paper-based format. Only currently enrolled students aged 18 years or older were eligible. No minors participated; therefore, parental consent and minor assent were not required. Participants provided oral informed consent before completing the questionnaire. Questionnaire completion required approximately 20 minutes. Researchers provided standardized instructions, and participants completed the survey independently to minimize researcher or peer influence.
Data screening and quality control
Responses were screened for missing data, duplicates, inconsistent responses, rapid completion, straight-line patterns, and outliers. Questionnaires with more than 5% missing responses were excluded. For retained questionnaires with 5% or less missing data, missing values were replaced using the participant’s mean for the completed items within the corresponding construct. Two incomplete responses, one duplicate response, and one invalid response were excluded, resulting in 398 valid cases. Table 1 summarizes the response-screening process and final analytical sample.
| Screening stage | Number |
| Initial responses | 402 |
| Removed for incomplete data | 2 |
| Removed for duplicate responses | 1 |
| Removed for invalid/inattentive response patterns | 1 |
| Final valid sample | 398 |
Table 1: Response screening and final analytical sample. Summary of the initial responses, exclusions, and final valid sample (N = 398).
The screening process was documented as follows:
Sample-size determination
The required sample size was determined a priori using statistical power analysis software (see Table of Materials). The calculation included seven predictor terms: Exercise Frequency, Exercise Duration, Exercise Consistency, PECB, Psychological Well-Being, PECB × Exercise Intensity, and Psychological Well-Being × Exercise Intensity. With α = 0.05, statistical power of 0.80, and a medium effect size of f2= 0.15, the minimum required sample size was 103 participants. The final analytical sample of 398 participants exceeded this requirement.
Statistical analysis
The complete dataset used for the statistical analyses is provided in Supplementary File 2. Data were analysed using partial least squares structural equation modelling (PLS-SEM) software (see Table of Materials). The analysis used a two-stage approach comprising assessment of the measurement model followed by assessment of the structural model44.
Measurement model
Reliability and convergent validity were assessed using outer loadings, Cronbach’s alpha, composite reliability (CR), and average variance extracted. The average variance extracted value ≥ 0.50 was considered evidence of adequate convergent validity. Discriminant validity was assessed using the heterotrait–monotrait ratio, with values below 0.85 considered conservative evidence of discriminant validity and values below 0.90 considered acceptable where theoretically justified.
Structural model
The structural model was evaluated using standardized path coefficients (β), bootstrap standard errors, t-statistics, 95% confidence intervals, and p-values. Bootstrapping was performed using 5,000 resamples. A two-tailed α = 0.05 significance threshold was used consistently throughout the analysis. Effect sizes were evaluated using f2, and explained variance was assessed using R2.
Collinearity was assessed using VIF values, with values below 5 considered acceptable. Predictive performance was evaluated using PLS-Predict through Q2_predict, RMSE, and MAE comparisons with the linear-model benchmark
Mediation analysis
Indirect associations were evaluated using bootstrapping. A mediation association was considered statistically supported when the 95% bootstrap confidence interval for the indirect effect did not include zero.
Moderation analysis
Moderation was assessed using the PECB × Exercise Intensity and Psychological Well-Being × Exercise Intensity interaction terms. An interaction was considered significant when its 95% bootstrap confidence interval excluded zero.
Common-method bias
As the study relied on self-reported questionnaire data collected using a common survey instrument, potential common-method bias was assessed using Harman's single-factor test and full-collinearity VIFs.
Results
Demographic characteristics
A total of 398 valid responses were included in the analysis. As shown in Table 2, 54.8% of participants were male and 45.2% were female, with 67.3% aged between 18 and 23 years. Most participants were undergraduates (90.5%), with 55.7% in their second or third year. Regarding exercise frequency, 47.2% reported exercising 3–4 days per week, whereas 31.7% reported exercising 5 or more days per week.
| Demographic Variable | Category | Frequency (n) | Percentage (%) |
| Gender | Male | 218 | 54.8 |
| Female | 180 | 45.2 | |
| Other / Prefer not to say | 0 | 0 | |
| Age | 18 – 20 years | 112 | 28.1 |
| 21 – 23 years | 156 | 39.2 | |
| 24 – 26 years | 86 | 21.6 | |
| 27 years and above | 44 | 11.1 | |
| Year of Study | First year | 62 | 15.6 |
| Second year | 108 | 27.1 | |
| Third year | 114 | 28.6 | |
| Fourth year / Final year | 76 | 19.1 | |
| Postgraduate | 38 | 9.5 | |
| Exercise Days per Week | 1 – 2 days | 84 | 21.1 |
| 3 – 4 days | 188 | 47.2 | |
| 5 – 6 days | 96 | 24.1 | |
| Daily (7 days) | 30 | 7.5 | |
| Exercise Session Duration | < 30 minutes | 46 | 11.6 |
| 30 – 60 minutes | 204 | 51.3 | |
| 61 – 90 minutes | 108 | 27.1 | |
| > 90 minutes | 40 | 10.1 |
Table 2: Demographic characteristics of respondents. Distribution of respondents by sex, age, academic standing, exercise frequency, and exercise duration.
Descriptive statistics
Table 3 presents the descriptive statistics for the study variables. The mean values ranged from 3.29 to 3.81, while standard deviations ranged from 0.78 to 1.02. Skewness and kurtosis values were within the ranges observed in the dataset, with no substantial departures from the distributional characteristics required for the subsequent analyses.
| Variable | Mean (M) | Standard Deviation (SD) | Skewness | Kurtosis |
| Exercise Frequency | 3.72 | 0.94 | -0.32 | -0.21 |
| Exercise Duration | 3.58 | 0.89 | -0.18 | -0.35 |
| Exercise Consistency | 3.45 | 1.02 | -0.1 | -0.48 |
| PECB | 3.38 | 0.85 | -0.05 | -0.12 |
| Psychological Well‑being | 3.81 | 0.78 | -0.41 | 0.15 |
| Cognitive Flexibility | 3.64 | 0.82 | -0.28 | -0.05 |
| Exercise Intensity | 3.29 | 0.96 | 0.02 | -0.54 |
Table 3: Descriptive statistics. Means, standard deviations, skewness, and kurtosis for the study variables.
Measurement model assessment
The reliability and convergent validity results are presented in Table 4. Factor loadings ranged from 0.74 to 0.92. Cronbach's α values ranged from 0.84 to 0.91, while composite reliability (CR) values ranged from 0.86 to 0.92. Average variance extracted values ranged from 0.59 to 0.70. These results indicate satisfactory internal consistency and convergent validity of the measurement model.
| Construct | Cronbach’s α | Composite Reliability (CR) | AVE | Factor Loadings |
| Exercise Frequency | 0.87 | 0.89 | 0.62 | 0.90 – 0.92 |
| Exercise Duration | 0.85 | 0.87 | 0.59 | 0.87 – 0.92 |
| Exercise Consistency | 0.89 | 0.91 | 0.66 | 0.75 – 0.79 |
| PECB | 0.84 | 0.86 | 0.61 | 0.77 – 0.80 |
| Psychological Well‑being | 0.91 | 0.92 | 0.7 | 0.87 – 0.92 |
| Cognitive Flexibility (DV) | 0.88 | 0.9 | 0.65 | 0.83 – 0.89 |
| Exercise Intensity (Moderator) | 0.86 | 0.88 | 0.63 | 0.74 – 0.84 |
Table 4: Measurement-model reliability and convergent validity. Outer loadings, Cronbach’s alpha, composite reliability, and average variance extracted for each construct.
Figure 2 presents the measurement model, including the standardized factor loadings for the indicators of Exercise Frequency, Exercise Duration, Exercise Consistency, Exercise Intensity, PECB, Psychological Well-Being, and Cognitive Flexibility.
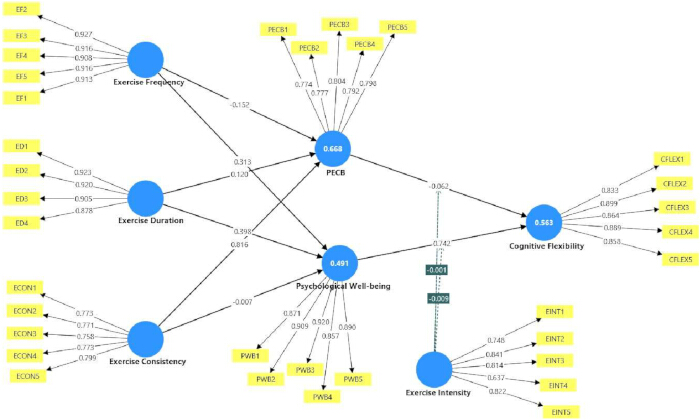
Figure 2: Measurement model using PLS-SEM. Standardized outer loadings for the indicators of Exercise Frequency, Exercise Duration, Exercise Consistency, Exercise Intensity, PECB, Psychological Well-Being, and Cognitive Flexibility. Please click here to view a larger version of this figure.
Discriminant validity was assessed using the heterotrait-monotrait ratio and the Fornell-Larcker criterion. As shown in Table 5, all the values were below 0.85, with the highest value being 0.71, observed between Psychological Well-being and Cognitive Flexibility. Table 6 further shows that the square root of the Average variance extracted values for each construct exceeded its corresponding inter-construct correlations. For Cognitive Flexibility, the square root of Average variance extracted values was 0.81, exceeding its correlations with the other constructs (maximum = 0.60). These results provide evidence of discriminant validity among the study constructs.
| Construct | -1 | -2 | -3 | -4 | -5 | -6 | -7 |
| (1) Exercise Frequency | – | ||||||
| (2) Exercise Duration | 0.62 | – | |||||
| (3) Exercise Consistency | 0.58 | 0.6 | – | ||||
| (4) PECB | 0.48 | 0.46 | 0.52 | – | |||
| (5) Psychological Well‑being | 0.54 | 0.52 | 0.58 | 0.61 | – | ||
| (6) Cognitive Flexibility | 0.51 | 0.47 | 0.53 | 0.64 | 0.71 | – | |
| (7) Exercise Intensity | 0.23 | 0.19 | 0.22 | 0.18 | 0.16 | 0.13 | – |
Table 5: Discriminant validity—heterotrait–monotrait ratio. Heterotrait–monotrait ratios among the study constructs.
| Construct | -1 | -2 | -3 | -4 | -5 | -6 | -7 |
| (1) Exercise Frequency | 0.79 | ||||||
| (2) Exercise Duration | 0.53 | 0.77 | |||||
| (3) Exercise Consistency | 0.48 | 0.51 | 0.81 | ||||
| (4) PECB | 0.41 | 0.39 | 0.45 | 0.78 | |||
| (5) Psychological Well‑being | 0.47 | 0.44 | 0.5 | 0.52 | 0.84 | ||
| (6) Cognitive Flexibility | 0.44 | 0.4 | 0.46 | 0.54 | 0.6 | 0.81 | |
| (7) Exercise Intensity | 0.19 | 0.15 | 0.14 | 0.14 | 0.13 | 0.11 | 0.79 |
Table 6: Discriminant validity—Fornell–Larcker criterion. Square roots of average variance extracted and inter-construct correlations.
Structural model and direct effects
The structural model results are presented in Table 7. Exercise Frequency was positively associated with PECB (β = 0.31, p < .001), whereas Exercise Duration was not significantly associated with PECB (β = 0.09, p = .186). Exercise Consistency was positively associated with PECB (β = 0.38, p < .001). Exercise Frequency, Exercise Duration, and Exercise Consistency were all positively associated with Psychological Well-being. Exercise Consistency showed the strongest association with Psychological Well-being (β = 0.35, p < .001). PECB (β = 0.33, p < .001) and Psychological Well-being (β = 0.44, p < .001) were also positively associated with Cognitive Flexibility. For the direct associations between exercise characteristics and Cognitive Flexibility, Exercise Frequency was positively associated with Cognitive Flexibility (β = 0.18, p < .001), supporting H5a. Exercise Consistency was also positively associated with Cognitive Flexibility (β = 0.15, p = .002), supporting H5c. In contrast, Exercise Duration was not significantly associated with Cognitive Flexibility (β = 0.06, p = .312); therefore, H5b was not supported. The reported f2 values ranged from small to medium, with the largest effect size observed for the association between Psychological Well-being and Cognitive Flexibility (f2 = 0.24).
| Hypothesis | Path | β (Std.) | SE | p-value | 95% CI (LLCI–ULCI) | f2 | Decision |
| H1a | Exercise Frequency → PECB | 0.31 | 0.06 | <.001 | [0.20, 0.42] | 0.12 | Supported |
| H1b | Exercise Duration → PECB | 0.09 | 0.07 | 0.186 | [-0.04, 0.22] | 0.01 | Rejected |
| H1c | Exercise Consistency → PECB | 0.38 | 0.05 | <.001 | [0.28, 0.48] | 0.18 | Supported |
| H2a | Exercise Frequency → Psych. Well‑being | 0.27 | 0.05 | <.001 | [0.17, 0.37] | 0.1 | Supported |
| H2b | Exercise Duration → Psych. Well‑being | 0.21 | 0.06 | <.001 | [0.10, 0.32] | 0.06 | Supported |
| H2c | Exercise Consistency → Psych. Well‑being | 0.35 | 0.05 | <.001 | [0.25, 0.45] | 0.16 | Supported |
| H3 | PECB → Cognitive Flexibility | 0.33 | 0.05 | <.001 | [0.23, 0.43] | 0.15 | Supported |
| H4 | Psych. Well‑being → Cognitive Flexibility | 0.44 | 0.06 | <.001 | [0.32, 0.56] | 0.24 | Supported |
| H5a | Exercise Frequency → Cognitive Flexibility (direct) | 0.18 | 0.05 | <.001 | [0.08, 0.28] | 0.05 | Supported |
| H5b | Exercise Duration → Cognitive Flexibility (direct) | 0.06 | 0.06 | 0.312 | [-0.05, 0.17] | 0.01 | Rejected |
| H5c | Exercise Consistency → Cognitive Flexibility (direct) | 0.15 | 0.05 | 0.002 | [0.06, 0.24] | 0.04 | Supported |
Table 7: Structural model and direct effects. Standardized path coefficients, bootstrap standard errors, p-values, 95% confidence intervals, effect sizes, and hypothesis decisions.
Mediation and moderation analysis
Table 8 presents the indirect and interaction effects. PECB significantly mediated the associations between Exercise Frequency and Cognitive Flexibility (indirect β = 0.102, CI [0.058, 0.152]) and between Exercise Consistency and Cognitive Flexibility (indirect β = 0.125, CI [0.073, 0.183]). Because the confidence intervals did not include zero, H6a and H6c were supported. The indirect association between Exercise Duration and Cognitive Flexibility through PECB was not statistically supported (indirect β = 0.030, CI included zero); therefore, H6b was not supported.
Psychological Well-being showed significant indirect associations for Exercise Frequency (β = 0.119), Exercise Duration (β = 0.092, CI [0.044, 0.146]), and Exercise Consistency (β = 0.154). The corresponding bootstrapped confidence intervals excluded zero, supporting H7a, H7b, and H7c. These results indicate statistical mediation of the associations between the three exercise characteristics and Cognitive Flexibility through Psychological Well-being.
Exercise Intensity significantly moderated the association between PECB and Cognitive Flexibility (interaction β = 0.22, f2 = 0.08) and the association between Psychological Well-being and Cognitive Flexibility (interaction β = 0.19, f2 = 0.06). Thus, H8a and H8b were supported. The interaction coefficients indicate that the strength of these associations differed according to reported Exercise Intensity.
| Hypothesis | Path (IV → Mediator → DV) | Indirect Effect (β) | SE | 95% BC CI (LLCI–ULCI) | f2 (mediation / moderation) | Decision |
| Mediation via PECB | ||||||
| H6a | Frequency → PECB → CogFlex | 0.102 | 0.024 | [0.058, 0.152] | 0.09 | Supported |
| H6b | Duration → PECB → CogFlex | 0.03 | 0.023 | [-0.012, 0.078] | 0.01 | Rejected (CI includes 0) |
| H6c | Consistency → PECB → CogFlex | 0.125 | 0.028 | [0.073, 0.183] | 0.11 | Supported |
| Mediation via Psychological Well‑being | ||||||
| H7a | Frequency → Well‑being → CogFlex | 0.119 | 0.027 | [0.069, 0.175] | 0.1 | Supported |
| H7b | Duration → Well‑being → CogFlex | 0.092 | 0.026 | [0.044, 0.146] | 0.07 | Supported |
| H7c | Consistency → Well‑being → CogFlex | 0.154 | 0.03 | [0.098, 0.215] | 0.14 | Supported |
| Moderation | Interaction β | SE | 95% CI | f² (interaction) | Decision | |
| H8a | PECB × Intensity → CogFlex | 0.22 | 0.06 | [0.11, 0.33] | 0.08 | Supported – intensity strengthens PECB → CogFlex |
| H8b | Well‑being × Intensity → CogFlex | 0.19 | 0.05 | [0.09, 0.29] | 0.06 | Supported – intensity strengthens well‑being → CogFlex |
Table 8: Mediation and moderation effects. Indirect effects through perceived exercise-related cognitive benefits (PECB) and psychological well-being, and the moderating effects of exercise Intensity.
PLS-predict analysis
PLS-Predict was used to assess out-of-sample predictive performance. As shown in Table 9, Q2_predict values were positive for CF1–CF4. The PLS-SEM model produced lower RMSE and MAE values than the linear-model benchmark for CF1–CF3. For CF4, RMSE values were equal (0.79), while the PLS-SEM MAE was slightly lower (0.62 vs. 0.63). These results indicate predictive relevance for the four indicators.
| Indicator | PLS‑SEM (RMSE) | PLS‑SEM (MAE) | LM (RMSE) | LM (MAE) | Q2_predict | PLS‑SEM vs. LM (RMSE) | Decision |
| CF1 | 0.82 | 0.64 | 0.92 | 0.71 | 0.27 | Lower | High predictive power |
| CF2 | 0.78 | 0.61 | 0.87 | 0.68 | 0.31 | Lower | High predictive power |
| CF3 | 0.85 | 0.67 | 0.88 | 0.69 | 0.24 | Lower | Medium predictive power |
| CF4 | 0.79 | 0.62 | 0.79 | 0.63 | 0.19 | Equal | Medium predictive power |
Table 9: PLS-Predict assessment of cognitive flexibility indicators. Prediction errors from the PLS-SEM and linear models and Q2_predict values for CF1–CF4.
Common method variance assessment
Because the study data were collected using a single survey-based method, common method variance (CMV) was assessed using Harman's single-factor test, the common latent factor (CLF) approach, and the full collinearity assessment. As reported in Table 10, the first unrotated factor accounted for 29.40% of the total variance. The CLF analysis showed a maximum difference in path coefficients (Δβ) of 0.04. Full collinearity VIF values ranged from 1.27 to 3.14.
Taken together, these results did not indicate a substantial common method variance concern in the present dataset. However, these statistical assessments do not establish the complete absence of common method variance; rather, they suggest that CMV was unlikely to represent a substantial threat to the reported associations.
| Method | Test / Criterion | Result | Threshold / Interpretation | CMV Concern |
| Harman’s single‑factor test | Total variance explained by one unrotated factor (PCA) | 29.40% | < 50% indicates no substantial CMV | No |
| Common Latent Factor (CLF) | Difference in standardised path coefficients (with vs. without CLF) | Largest Δβ = 0.04 | Δβ < 0.10 → no significant bias | No |
| Full collinearity test (VIF) | Variance Inflation Factor (VIF) for each latent variable | Range = 1.27 – 3.14 | All VIFs < 3.3 → model free of CMV | No |
Table 10: Common method variance assessment. Results of Harman’s single-factor test, common latent factor analysis, and full-collinearity variance inflation factor assessment.
Overall, the results supported the hypothesized positive associations of Exercise Frequency and Exercise Consistency with Cognitive Flexibility, whereas the direct association involving Exercise Duration was not statistically supported. PECB significantly mediated the associations involving Exercise Frequency and Exercise Consistency but not Exercise Duration. Psychological Well-being showed significant indirect associations across all three exercise characteristics. Exercise Intensity significantly moderated the associations of PECB and Psychological Well-being with Cognitive Flexibility. The PLS-Predict analysis indicated positive predictive relevance for the Cognitive Flexibility indicators, while the CMV assessments did not indicate a substantial common method variance concern.
DATA AVAILABILITY:
The raw, de-identified data supporting the findings of this study are available from the corresponding author upon reasonable request. The data will be provided by the authors in accordance with applicable ethical and institutional requirements. The ethical approval documentation for this study is provided in Supplementary File 1. The source data set used for the statistical analyses is provided in Supplementary File 2.
Supplementary File 1: Ethical approval documentation. Institutional Review Board approval documentation for the study. Please click here to download this file.
Supplementary File 2: Source data used for the statistical analyses. The file contains the data used for the analyses reported in this study. Please click here to download this file.
Discussion
This cross-sectional study examined the associations between exercise characteristics and cognitive flexibility among university students, with PECB and psychological well-being examined as mediators and exercise intensity as a moderator. Exercise frequency (β = 0.18, p < .001) and consistency (β = 0.15, p = .002) were positively associated with cognitive flexibility, whereas duration was not (β = 0.06, p = .312). These findings align with previous cross-sectional evidence22,27 but should not be interpreted causally. PECB significantly mediated the associations of exercise frequency (H6a: indirect β = 0.102, CI [0.058, 0.152]) and exercise consistency (H6c: indirect β = 0.125, CI [0.073, 0.183]) with cognitive flexibility, whereas the indirect association involving exercise duration was not significant (H6b: β = 0.030, CI included zero). These findings indicate that students who reported exercising more frequently or consistently also tended to report higher PECB, which, in turn, was associated with greater cognitive flexibility. Importantly, PECB in the present study represents a self-reported self-perceived exercise-related cognitive benefit rather than an objectively measured neurocognitive resource. Future studies should distinguish clearly between perceived and objectively assessed neurocognitive resources by incorporating validated cognitive tasks, neurophysiological measures, or other objective indicators to determine whether similar indirect associations are observed.
Psychological well-being showed significant indirect associations between all three exercise characteristics and cognitive flexibility (H7a: frequency → well-being → flexibility, β = 0.119; H7b: duration → well-being → flexibility, β = 0.092; H7c: consistency → well-being → flexibility, β = 0.154), with bootstrapped confidence intervals excluding zero. Of particular interest, exercise duration was not significantly associated directly with cognitive flexibility and was not significantly mediated through PECB, but it showed a significant indirect association through psychological well-being. This pattern suggests that the association between exercise duration and cognitive flexibility may be more closely linked to psychological well-being than to perceived neurocognitive functioning.
Exercise intensity significantly moderates the associations between PECB and cognitive flexibility (H8a: interaction β = 0.22) and between psychological well-being and cognitive flexibility (H8b: interaction β = 0.19). Thus, the positive associations of PECB and psychological well-being with cognitive flexibility appeared stronger among students reporting higher exercise intensity. These findings are compatible with arousal-based explanations, including the Yerkes–Dodson framework, which may provide one possible theoretical interpretation of differences in the strength of these associations. However, such biological or psychological mechanisms were not directly tested in the present study. An alternative explanation is equally plausible: students with greater cognitive flexibility or better psychological well-being may be more likely to select, tolerate, or maintain higher-intensity exercise. Because all variables were measured at the same time, the direction of these relationships cannot be determined. Accordingly, the moderation findings should be regarded as preliminary evidence of an interaction rather than evidence that exercise intensity strengthens the effects of PECB or psychological well-being on cognitive flexibility. Overall, the findings suggest a pattern of associations in which exercise frequency and consistency were directly associated with cognitive flexibility, PECB was an indirect correlate for frequency and consistency, and psychological well-being was an indirect correlate across all three exercise characteristics.
Given the cross‑sectional, self‑report design and the use of an unvalidated perceptual measure PECB, no practical recommendations for exercise prescription or policy can be made from this study alone. The finding that exercise frequency and consistency show positive associations with cognitive flexibility provides a rationale for future longitudinal or experimental research to test whether increasing exercise frequency and consistency causes improvements in cognitive flexibility. Until such causal evidence is available, any suggestion that students should exercise more often or more consistently to enhance cognitive flexibility remains speculative. The following suggestions are offered solely as hypotheses to be tested in future intervention studies, not as actionable guidelines: (a) interventions designed to increase exercise frequency and consistency (rather than solely focusing on session duration) may yield cognitive benefits; (b) psychological well‑being should be considered as a potential mechanism; (c) higher intensity may amplify associations, but this should be tested experimentally. The limitations (described below) provide a detailed accounting of why immediate practical recommendations are not warranted.
This study examined the associations among exercise characteristics, cognitive flexibility, Perceived Exercise-Related Cognitive Benefits (PECB), and psychological well-being among university students. The findings indicated that exercise frequency and consistency were positively associated with cognitive flexibility, both directly and indirectly through PECB and psychological well-being. In contrast, exercise duration was not directly associated with cognitive flexibility and showed no significant indirect association through PECB, although a significant indirect association through psychological well-being was observed. Positive interaction coefficients indicated that these associations were stronger at higher reported exercise intensity. Overall, these findings highlight the importance of considering different dimensions of exercise and psychological factors when understanding individual differences in cognitive flexibility. However, the findings should be interpreted with caution because the cross-sectional design and reliance on self-reported measures preclude causal inference. Longitudinal and experimental research is needed to further examine the temporal and causal relationships among exercise, PECB, psychological well-being, and cognitive flexibility. The cross-sectional design prevents causal inference, while reliance on self-reported measures may have introduced recall, social desirability, and common method bias. The study-developed PECB measure has not undergone independent external validation. Furthermore, recruiting only regular exercisers from one Chinese university may have introduced selection bias and limited the generalizability of the findings.
Disclosures
All authors declare no conflicts of interest. The authors declare that no generative AI or AI-assisted technologies were used in the design, data collection, statistical analysis, interpretation of data, or drafting and revision of this manuscript.
Acknowledgements
This work was funded by the Yunnan Provincial Department of Education, China (Grant No. 2024JY005), the National Natural Science Foundation of China (Grant No. U25A2054), and Yunnan University of Finance and Economics (Grant No. 2021C09). The authors would like to thank all the participants who took part in this study and contributed their time and valuable information. The authors also acknowledge the support and assistance provided by the relevant institution and research staff during the study.
Materials
| Name | Company | Catalog Number | Comments |
|---|---|---|---|
| 7-point Likert scale response format | N/A (scale design) | N/A | Range from 1 (strongly disagree) to 7 (strongly agree); used uniformly across all constructs |
| Cognitive Flexibility Inventory | Adapted from original authors (e.g., Dennis & Vander Wal, 2010) | N/A | Measures tendency to perceive difficult situations as controllable and ability to generate multiple alternative solutions |
| Expert panel evaluation form | N/A | N/A | Form used by four academicians and three sport industry professionals to assess content and face validity (clarity, relevance, operational suitability) of adapted scales |
| International Physical Activity Questionnaire (IPAQ) – short form | IPAQ group (www.ipaq.ki.se) | N/A | Self-report items adapted to assess exercise frequency, duration, and intensity |
| G*Power (version 3.1) | Heinrich Heine University Düsseldorf | Used for a priori statistical power analysis to determine the minimum required sample size | |
| Paper-based survey forms (or digital equivalent) | N/A | N/A | Physical or electronic medium for in-person data collection at participating universities |
| Perceived Neurocognitive Resource Availability (PNRA) scale | Adapted from Dinoff et al. (2017) and Loprinzi (2019) | N/A | 6-item self-report scale measuring subjective beliefs about mental clarity, cognitive energy, and neurocognitive adaptability following exercise; uses 7-point Likert scale |
| Pilot test survey set | Same as above | N/A | Administered to a subset of university students prior to full data collection to identify redundancies, anomalies, and duplications |
| Ryff's Psychological Well-Being Scale (14-item short version) | Ryff (1989); adapted | N/A | 14-item scale measuring psychological well-being, shortened and adapted for university student context |
| SmartPLS (version 4) | SmartPLS GmbH | N/A | Software for partial least squares structural equation modeling (PLS-SEM); used for measurement model assessment, structural model evaluation, bootstrapping (5,000 resamples), and mediation/moderation analyses RRID: SCR_036637 |
| Statistical analysis add-ons (PLS predict, bootstrapping) | SmartPLS GmbH | N/A | Built-in procedures within SmartPLS for predictive relevance (Q²), effect sizes (f²), and common method bias tests (e.g., Harman's single-factor test, CLF) |
| Structured questionnaire (full survey) | N/A (self-assembled) | N/A | Combined instrument including all adapted scales (PNRA, exercise characteristics, psychological well-being, cognitive flexibility) administered to university students |
References
- Farrukh S, et al. Association of exercise, brain-derived neurotrophic factor, and cognition among older women: a systematic review and meta-analysis. Archives of Gerontology and Geriatrics. 2023;114:105068.
- Numssen O, van der Burght CL, Hartwigsen G. Revisiting the focality of non-invasive brain stimulation: implications for studies of human cognition. Neuroscience & Biobehavioral Reviews. 2023;149:105154.
- Suwabe K, Yassa MA, Suzuki K, Sankai Y, Soya H. Exercise benefits dentate gyrus function: bridging from animal models to human high-resolution functional MRI of pattern separation. In: Soya H, editor. Exercise Brain Stimulation for Cognitive Function and Mental Health. Springer Singapore; Singapore. 2025;95–111.
- Teixeira PJ, Carraça EV, Markland D, Silva MN, Ryan RM. Exercise, physical activity, and self-determination theory: a systematic review. International Journal of Behavioral Nutrition and Physical Activity. 2012;9:78.
- Tian S, et al. Comparison of the sustainability effects of high-intensity interval exercise and moderate-intensity continuous exercise on cognitive flexibility. International Journal of Environmental Research and Public Health. 2021;18(18):9631.
- Vasilopoulos F, Jeffrey H, Wu Y, Dumontheil I. Multi-level meta-analysis of physical activity interventions during childhood: effects of physical activity on cognition and academic achievement. Educational Psychology Review. 2023;35(2):59.
- Gao R, Laophuangsak P. The social web of happiness: how family and local support shape wellbeing of Chinese students in Thailand. Journal of Advances in Humanities Research. 2025;4(1):42–60.
- Zhu W, et al. Effects of pre-class acute exercise on executive function in university students. International Journal of Mental Health Promotion. 2025;27(10):1439–1455.
- Baune BT, Eyre H. Novel perspectives on the role of immune biomarkers in exercise and depression. Brain, Behavior, and Immunity. 2012;26:512–513.
- Best JR. Effects of physical activity on children's executive function: contributions of experimental research on aerobic exercise. Developmental Review. 2010;30(4):331–351.
- Blackman LM. What is doing history? The use of history to understand the constitution of contemporary psychological objects. Theory & Psychology. 1994;4(4):485–504.
- Hill AP, Hall HK, Appleton PR, Kozub SA. Perfectionism and burnout in junior elite soccer players: the mediating influence of unconditional self-acceptance. Psychology of Sport and Exercise. 2008;9(5):630–644.
- Hillman CH, Erickson KI, Kramer AF. Be smart, exercise your heart: exercise effects on brain and cognition. Nature Reviews Neuroscience. 2008;9:58–65.
- Huang T, Larsen KT, Ried-Larsen M, Møller NC, Andersen LB. The effects of physical activity and exercise on brain-derived neurotrophic factor in healthy humans: a review. Scandinavian Journal of Medicine & Science in Sports. 2014;24:1–10.
- Masley S, Roetzheim R, Gualtieri T. Aerobic exercise enhances cognitive flexibility. Journal of Clinical Psychology in Medical Settings. 2009;16(2):186–193.
- Mavilidi MF, et al. How physical activity context relates to cognition across the lifespan: a systematic review and meta-analysis. Psychological Bulletin. 2025;151(5):544–579.
- McEwen BS, Gianaros PJ. Stress- and allostasis-induced brain plasticity. Annual Review of Medicine. 2011;62:431–445.
- Yerkes RM, Dodson JD. The relation of strength of stimulus to rapidity of habit-formation. Journal of Comparative Neurology and Psychology. 1908;18(5):459–482.
- Yu DJ, et al. Effects of exercise intensity and frequency on improving cognitive performance in middle-aged and older adults with mild cognitive impairment: a pilot randomized controlled trial on the minimum physical activity recommendation from WHO. Frontiers in Physiology. 2022;13:1021428.
- Nikolić D, Fries P, Singer W. Gamma oscillations: precise temporal coordination without a metronome. Trends in Cognitive Sciences. 2013;17(2):54–55.
- Oberste M, et al. Effects and moderators of acute aerobic exercise on subsequent interference control: a systematic review and meta-analysis. Frontiers in Psychology. 2019;10:2616.
- Colcombe S, Kramer AF. Fitness effects on the cognitive function of older adults: a meta-analytic study. Psychological Science. 2003;14(2):125–130.
- Cotman CW, Berchtold NC, Christie LA. Exercise builds brain health: key roles of growth factor cascades and inflammation. Trends in Neurosciences. 2007;30(9):464–472.
- McMorris T, Hale BJ. Differential effects of differing intensities of acute exercise on speed and accuracy of cognition: a meta-analytical investigation. Brain and Cognition. 2012;80(3):338–351.
- Dupuy O, et al. Effect of acute intermittent exercise on cognitive flexibility: the role of exercise intensity. Journal of Cognitive Enhancement. 2018;2:146–156.
- Raichlen DA, Alexander GE. Adaptive capacity: an evolutionary neuroscience model linking exercise, cognition, and brain health. Trends in Neurosciences. 2017;40(7):408–421.
- Shukla D, Al-Shamil Z, Belfry G, Heath M. A single bout of moderate intensity exercise improves cognitive flexibility: evidence from task-switching. Experimental Brain Research. 2020;238(10):2333–2346.
- Reed J, Buck S. The effect of regular aerobic exercise on positive-activated affect: a meta-analysis. Psychology of Sport and Exercise. 2009;10(6):581–594.
- Fredrickson BL. The role of positive emotions in positive psychology: the broaden-and-build theory of positive emotions. American Psychologist. 2001;56(3):218–226.
- Yang Z, et al. The relationship between acute aerobic exercise and inhibitory control in college students: the impact of physical and cognitive engagement. Physiology & Behavior. 2025;290:114779.
- Diamond A. Effects of physical exercise on executive functions: going beyond simply moving to moving with thought. Annals of Sports Medicine and Research. 2015;2(1):1011.
- Yazıcı Çelebi G, Güngör S, Kaya F. The role of cognitive flexibility and psychological well-being in the effect of mindfulness on problematic internet use. Scientific Reports. 2025;15(1):31373.
- Yu Q, et al. Effects of physical exercise breaks on executive function in a simulated classroom setting: uncovering a window into the brain. Advanced Science. 2025;12(3):2406631.
- Rudnik A, Sobczak K, Sawicki A, Zdun-Ryżewska A. Exploring the interplay of stress, fatigue, and empathy: the mediating role of cognitive flexibility in enhancing the well-being of university students in medical and social disciplines. PLoS ONE. 2025;20(4):e0321946.
- Zheng X, et al. Association among cognitive emotion regulation strategies, psychological flexibility and subjective well-being in patients with breast cancer: a cross-sectional latent profile and mediation analysis. Supportive Care in Cancer. 2025;33(3):174.
- Yi Z, Wei L, Xu L, Pang W, Liu Y. Chain-mediation effect of cognitive flexibility and depression on the relationship between physical activity and insomnia in adolescents. BMC Psychology. 2025;13(1):587.
- Dinoff A, Herrmann N, Swardfager W, Lanctôt KL. The effect of acute exercise on blood concentrations of brain-derived neurotrophic factor in healthy adults: a meta-analysis. European Journal of Neuroscience. 2017;46(1):1635–1646.
- Loprinzi PD, et al. The temporal effects of acute exercise on episodic memory function: systematic review with meta-analysis. Brain Sciences. 2019;9(4):87.
- Ryff CD, Keyes CL. The structure of psychological well-being revisited. Journal of Personality and Social Psychology. 1995;69(4):719–727.
- Dennis JP, Vander Wal JS. The cognitive flexibility inventory: instrument development and estimates of reliability and validity. Cognitive Therapy and Research. 2010;34(3):241–253.
- Craig CL, et al. International physical activity questionnaire: 12-country reliability and validity. Medicine & Science in Sports & Exercise. 2003;35(8):1381–1395.
- Rebar AL, et al. A meta-meta-analysis of the effect of physical activity on depression and anxiety in non-clinical adult populations. Health Psychology Review. 2015;9(3):366–378.
- Loprinzi PD, Herod SM, Cardinal BJ, Noakes TD. Physical activity and the brain: a review of this dynamic, bi-directional relationship. Brain Research. 2013;1539:95–104.
- Hair J, Alamer A. Partial least squares structural equation modeling (PLS-SEM) in second language and education research: guidelines using an applied example. Research Methods in Applied Linguistics. 2022;1(3):100027.