Serum miR-1271-5p combined with transvaginal ultrasound (TVUS) demonstrates significant diagnostic value for endometriosis (EMs). MiR-1271-5p promotes cell proliferation, migration, and invasion by negatively regulating IGF1R, thereby facilitating EMs progression and identifying a potential target for subsequent therapeutic investigation.
Research Article
The Diagnostic Value and Molecular Mechanism of miR-1271-5p Combined with Ultrasound in Endometriosis
* These authors contributed equally
In This Article
Summary
Abstract
Endometriosis (EMs) is a systemic inflammatory disease characterized by the growth of endometrial tissue outside the uterus. Its underlying mechanisms remain unclear, contributing to limitations in diagnosis and treatment. This study evaluated the diagnostic value of serum miR-1271-5p combined with transvaginal ultrasound (TVUS) and examined the regulatory relationship between miR-1271-5p and insulin-like growth factor 1 receptor (IGF1R). The study included 115 patients with EMs and 90 healthy volunteers. MiR-1271-5p and IGF1R expression levels were measured using real-time quantitative polymerase chain reaction (RT-qPCR). Receiver operating characteristic (ROC) analysis was used to assess the diagnostic performance of miR-1271-5p and TVUS individually and in combination. A dual-luciferase reporter assay was used to verify the interaction between miR-1271-5p and IGF1R, and in vitro experiments were conducted using hEM15A and 12Z cells. The combined use of miR-1271-5p and TVUS demonstrated high diagnostic performance for EMs. MiR-1271-5p negatively regulated IGF1R, and inhibition of miR-1271-5p significantly reduced cell proliferation, migration, and invasion. Silencing IGF1R reversed these effects. Serum IGF1R mRNA expression was reduced in patients with EMs and was inversely correlated with miR-1271-5p expression. These findings support the diagnostic value of serum miR-1271-5p combined with TVUS and indicate that miR-1271-5p regulates EMs-associated cellular behavior through IGF1R.
Introduction
Endometriosis (EMs) is a prevalent and heterogeneous systemic disease affecting approximately 10% of women1. Genetic and environmental factors contribute to its pathogenesis. The condition is characterized by chronic inflammation and commonly presents with pelvic pain and infertility2. The specific etiology of EMs remains unclear, creating challenges for clinical diagnosis and treatment3. Early diagnostic methods and timely interventions, including surgery and hormone therapy, are therefore needed4. However, the heterogeneous clinical presentation of EMs frequently contributes to delayed diagnosis5. Ultrasound is widely used as a first-line imaging modality for EMs6,7. Transvaginal ultrasound (TVUS) is commonly used in patients with gynecological symptoms8, while both TVUS and transabdominal ultrasound are used for diagnosis and assessment of postoperative recurrence9. Diagnostic performance varies according to lesion type and location10. TVUS has high diagnostic accuracy for rectosigmoid EMs11, whereas its detection rate for superficial EMs is lower than that for deep EMs10. These limitations support the evaluation of combined diagnostic approaches to improve the detection of EMs.
MicroRNAs (miRNAs) regulate gene expression and are involved in the development and progression of multiple pathological processes12. In EMs, miRNAs participate in processes including inflammatory responses, cell proliferation, and angiogenesis12,13. Their stability in blood supports their potential use as non-invasive biomarkers14. Salivary miRNAs have also been investigated for EMs diagnosis, providing an accessible biological sample for analysis15. MiRNA expression profiles have shown potential for distinguishing normal ovarian tissue from EMs and other gynecological diseases16,17. Small extracellular vesicle-associated miRNAs, including miR-22-3p and miR-320a-3p, have also demonstrated diagnostic potential for EMs18. In addition, miR-1271-5p has been reported to be significantly upregulated in EMs19,20. These findings support the evaluation of miR-1271-5p as a potential diagnostic biomarker for EMs.
Insulin-like growth factor 1 receptor (IGF1R) is a transmembrane receptor tyrosine kinase that mediates the biological effects of insulin-like growth factors and regulates cellular processes21. In the endometrium, insulin signaling, including IGF1R, plays an important role in endometrial proliferation and implantation22. Dysregulation of the insulin-like growth factor axis has also been implicated in gynecological disorders, including EMs23. Recent evidence indicates that IGF1R expression is reduced in ovarian EMs and that this reduction may contribute to disease progression24. However, the upstream mechanisms associated with IGF1R suppression in EMs remain poorly understood. Because miRNAs are established post-transcriptional regulators of gene expression and miR-1271-5p has been predicted to target IGF1R, miR-1271-5p was hypothesized to promote EMs progression through negative regulation of IGF1R.
This study evaluates the diagnostic value of serum miR-1271-5p in combination with TVUS for EMs and examines the regulatory relationship between miR-1271-5p and IGF1R in EM-associated cellular processes.
Protocol
The study was conducted in accordance with the Declaration of Helsinki and institutional guidelines. The research protocol was approved by the Ethics Committee of the Central Hospital of Shangrao (approval number: 2022-058). All participants provided signed informed consent. The research tools used in the protocol are listed in the Table of Materials.
1. Object of study
This study included 115 patients from the Central Hospital of Shangrao, all of whom were clinically diagnosed with EMs and underwent laparoscopic surgery and pathological examination. Additionally, 90 healthy controls who underwent physical examinations during the pregnancy preparation period were included. Baseline data and results from TVUS examinations were collected, with the TVUS results jointly interpreted by at least two ultrasound technicians to ensure accuracy.
The exclusion criteria were recent use of hormone drugs, autoimmune disease or cancer, and pregnancy or lactation. Serum samples were collected from each patient during the proliferative phase of the menstrual cycle (days 6–12) to minimize cycle-related variability, then centrifuged and stored at −80 °C for subsequent experiments. Furthermore, endometrial tissues were collected from 30 patients with ovarian EMs and 30 patients without EMs who underwent surgery for uterine fibroids.
2. TVUS examination
TVUS was performed using an ultrasound system equipped with a 5–9 MHz endovaginal probe. All examinations were conducted during the proliferative phase of the menstrual cycle (days 6–12) to minimize cycle-related variability. Each examination was performed and jointly interpreted by at least two experienced ultrasound technicians, each with more than 5 years of specialized gynecological ultrasound experience, who were blinded to the clinical diagnosis and laboratory results.
The diagnostic criteria for EMs on TVUS followed the International Deep Endometriosis Analysis (IDEA) group consensus25. Ovarian endometriomas were defined as unilocular or multilocular cystic masses with homogeneous low-level “ground-glass” echogenicity, no papillary projections, and detectable blood flow. Deep infiltrating endometriosis (DIE) nodules were identified as hypoechoic thickening or nodular lesions, with or without cystic areas, located in the retrocervical region, uterosacral ligaments, rectovaginal septum, or bowel wall. Typical peritoneal lesions were suggested by the presence of adhesions or a fixed retroverted uterus. A patient was classified as TVUS-positive for EMs if any of these criteria were met.
3. Real-time quantitative polymerase chain reaction
Total RNA was extracted from serum, tissue, and cell samples using an RNA extraction reagent according to the manufacturer’s instructions. RNA concentration and purity were measured using a spectrophotometer. cDNA was synthesized from 500 ng of total RNA using a reverse transcription reagent kit with the primer sequences of miR-1271-5p and IGF1R. RT-qPCR was performed using a fluorescent qPCR master mix and a real-time PCR system.
The primer sequences were as follows: miR-1271-5p forward, 5′-CTTGGCACCTAGCAAGCACTCA-3′ and reverse, 5′-GCGAGCACAGAATTAATACGAC-3′; U6 forward, 5′-CGCTTCGGCAGCACATATACTA-3′ and reverse, 5′-ATGGAACGCTTCACGAATTTGC-3′; IGF1R forward, 5′-GCCGACGAGTGGAGAAATCTG-3′ and reverse, 5′-TGGAGGTAGCCCTCGATCAC-3′; GAPDH forward, 5′-GTCTCCTCTGACTTCAACAGCG-3′ and reverse, 5′-ACCACCCTGTTGCTGTAGCCAA-3′.
The PCR conditions were 95 °C for 10 min, followed by 40 cycles of 95 °C for 15 s and 60 °C for 60 s. U6 and GAPDH were used as internal references for miR-1271-5p and IGF1R, respectively. Relative expression levels were calculated using the 2−ΔΔCt method.
4. Cell culture and transfection
hEM15A cells, human ectopic endometrial stromal cells, were maintained in DMEM/F12 medium supplemented with 15% fetal bovine serum (FBS) and 1% penicillin-streptomycin. 12Z cells, immortalized human endometriotic epithelial cells, and hEECs, immortalized normal human endometrial epithelial cells, were cultured in DMEM/F12 medium containing 10% FBS and 1% penicillin-streptomycin. All cells were maintained in a humidified incubator at 37 °C with 5% CO₂.
For transfection, cells were seeded in 6-well plates at a density of 2 × 10⁵ cells per well and cultured overnight to reach 70%–80% confluence. MiR-1271-5p mimic, inhibitor, si-IGF1R, and their corresponding negative controls, NC-mimic, NC-inhibitor, and si-NC, were used. Transfection was performed using a lipid-based transfection reagent at a final oligonucleotide concentration of 50 nM according to the manufacturer’s protocol. Cells were harvested for further experiments 48 h after transfection.
5. Cell migration and invasion
For migration assays, transfected cells were starved in serum-free medium for 6 h, then trypsinized and resuspended in serum-free medium at a density of 5 × 10⁴ cells/mL. A volume of 200 µL of cell suspension was added to the upper chamber of 24-well cell culture inserts with an 8 µm pore size, while 600 µL of complete medium containing 10% FBS was added to the lower chamber as a chemoattractant.
After 48 h of incubation at 37 °C, cells remaining on the upper surface were gently removed with a cotton swab. Cells that migrated to the lower surface were fixed with 4% paraformaldehyde for 20 min, stained with 0.1% crystal violet for 15 min, washed with phosphate-buffered saline (PBS), and imaged under an inverted microscope. Five random fields at 200× magnification per well were counted, and the average number was calculated.
For invasion assays, the upper chamber was precoated with an extracellular matrix preparation diluted to 1 mg/mL in serum-free medium. A volume of 50 µL of the diluted matrix preparation was added to each upper chamber and incubated at 37 °C for 2 h to solidify. The remaining steps were identical to the migration assay. Each experiment was performed in triplicate and repeated at least three times independently.
6. Cell proliferation
After transfection, hEM15A and 12Z cells were seeded into 96-well plates at a density of 3 × 10³ cells per well in 100 µL of complete medium and cultured for 0, 24, 48, or 72 h. NC-mimic- and NC-inhibitor-transfected cells were used as negative controls. All cells were treated under identical conditions.
At each time point, 10 µL of cell counting kit-8 (CCK-8) solution was added to each well, and the plates were incubated for 2 h at 37 °C in the dark. Absorbance was measured at 450 nm using a microplate reader. The experiment was performed in triplicate and repeated independently three times.
7. In vitro stimulus challenge
To investigate whether miR-1271-5p expression is regulated by inflammatory stimuli, hEECs, hEM15A, and 12Z cells were seeded in 6-well plates at 2 × 10⁵ cells per well and cultured overnight. Cells were then treated with 17β-estradiol (E2; 10 nM) or tumor necrosis factor-alpha (TNF-α; 10 ng/mL) for 24 h. Untreated cells served as controls.
After treatment, total RNA was extracted, and miR-1271-5p expression was measured by RT-qPCR as described above. Each experiment was performed in triplicate and repeated three times independently.
8. Dual-luciferase reporter assay
To validate the direct binding of miR-1271-5p to the 3′ untranslated region (3′UTR) of IGF1R, a dual-luciferase reporter assay was performed. hEM15A and 12Z cells were seeded in 24-well plates at a density of 5 × 10⁴ cells per well and co-transfected with 100 ng of either IGF1R-3′UTR-WT or IGF1R-3′UTR-MUT reporter plasmid and 50 nM of miR-1271-5p mimic or NC-mimic using a lipid-based transfection reagent.
After 48 h of transfection, cells were lysed in 100 µL of passive lysis buffer, and firefly and Renilla luciferase activities were measured sequentially using a dual-luciferase reporter assay system and a luminometer. Firefly luciferase activity was normalized to Renilla activity for each well to control for transfection efficiency. Each experiment was performed in triplicate and repeated independently three times.
9. Western blot analysis
Cells were lysed in radioimmunoprecipitation assay (RIPA) buffer supplemented with protease and phosphatase inhibitors. Protein concentrations were determined using a bicinchoninic acid (BCA) protein assay. Equal amounts of protein, 30 µg per lane, were separated by 10% sodium dodecyl sulfate-polyacrylamide gel electrophoresis (SDS-PAGE) and transferred onto polyvinylidene fluoride (PVDF) membranes.
Membranes were blocked with 5% non-fat milk in Tris-buffered saline containing Tween 20 (TBST) for 1 h at room temperature and then incubated overnight at 4 °C with primary antibodies against IGF1R (1:1,000) and GAPDH (1:5,000). After washing with TBST, membranes were incubated with horseradish peroxidase (HRP)-conjugated secondary antibody (1:3,000) for 1 h at room temperature.
Protein bands were visualized using an enhanced chemiluminescence substrate and imaged using a chemiluminescence imaging system. Densitometric analysis was performed using image-analysis software, with GAPDH as the loading control.
10. Bioinformatic analysis
To predict potential target genes of miR-1271-5p, four publicly available databases were used: miRWalk, miRDB, TargetScan, and ENCORI. Overlapping target genes among the four databases were identified using a Venn diagram.
Gene Ontology (GO) enrichment analysis, including biological process (BP), cellular component (CC), and molecular function (MF), and Kyoto Encyclopedia of Genes and Genomes (KEGG) pathway enrichment analysis were performed using an online bioinformatics platform. A p-value < 0.05 was considered statistically significant for enrichment.
11. Data processing and analysis
The ENCORI database predicted the potential binding sites of miR-1271-5p. Kappa analysis was used to assess the agreement between TVUS results and diagnoses. Receiver operating characteristic (ROC) curve analysis was utilized to evaluate the diagnostic value of TVUS and miR-1271-5p in EMs. The area under the ROC curve (AUC) was calculated for each model, and the optimal cut-off value for miR-1271-5p was determined by maximizing the Youden index (sensitivity + specificity − 1).
To construct the combined diagnostic model, binary logistic regression was performed with TVUS result and serum miR-1271-5p expression as independent variables and clinical diagnosis as the dependent variable. The predicted probability was used as the combined diagnostic index for ROC analysis. AUC comparisons between the combined model, TVUS, and miR-1271-5p were performed using DeLong’s non-parametric method.
Charts were generated, and significance analyses were conducted using statistical and graphing software. Each set of experiments was repeated at least three times. The data were assessed for normal distribution using histograms and the Shapiro-Wilk test. Categorical data, such as the incidence of dysmenorrhea, are expressed as n (%), while continuous data, such as age, are presented as mean ± standard deviation (SD). Comparisons between groups were conducted using t-tests or analysis of variance. A p-value < 0.05 was considered statistically significant.
Results
Clinical data analysis
A total of 115 patients with EMs and 90 healthy controls were included. No significant differences in age or body mass index (BMI) were observed between the groups. Patients with EMs exhibited significantly higher serum anti-endometrial antibody (EMAb) levels than healthy controls (p < 0.001). Additionally, chronic pelvic pain and dysmenorrhea were more frequent in patients with EMs (p < 0.001, Table 1).
| Factors | Healthy controls (n = 90) | Endometriosis (n = 115) | p-value |
| Age (years) | 33.27 ± 5.08 | 33.78 ± 2.71 | 0.352 |
| BMI (kg/m²) | 22.37 ± 2.58 | 22.68 ± 2.36 | 0.368 |
| Smoking status, n (%) | 12 (13.33%) | 19 (16.52%) | 0.527 |
| Drinking, n (%) | 15 (16.67%) | 21 (18.26%) | 0.766 |
| EMAb (ng/L) | 0.21 ± 0.08 | 0.61 ± 0.13 | <0.001 |
| Chronic pelvic pain, n (%) | 16 (17.78%) | 58 (50.43%) | <0.001 |
| Dysmenorrhea, n (%) | 17 (18.89%) | 61 (53.04%) | <0.001 |
| rASRM stage I–II | — | 72 | — |
| rASRM stage III–IV | — | 43 | — |
Table 1: Comparisons of baseline characteristics between healthy controls and patients with endometriosis. This table summarizes demographic and clinical characteristics of the healthy control and endometriosis groups, including age, body mass index, serum anti-endometrial antibody levels, chronic pelvic pain, dysmenorrhea, and rASRM stage distribution. Note: BMI, body mass index; EMAb, anti-endometrial antibody; rASRM, revised American Society for Reproductive Medicine. p < 0.05 was considered statistically significant.
Diagnostic value of miR-1271-5p in EMs
Serum miR-1271-5p expression was significantly higher in patients with EMs than in healthy controls (p < 0.001, Figure 1A). Similarly, miR-1271-5p expression in endometrial tissues was significantly higher in patients with ovarian EMs than in disease-control patients who underwent surgery for uterine fibroids (p < 0.001, Figure 1B). Receiver operating characteristic (ROC) analysis showed an area under the curve (AUC) of 0.857 for serum miR-1271-5p. At the optimal cut-off value, the sensitivity and specificity for detecting EMs were 77.39% and 86.67%, respectively (p < 0.001, Figure 1C).
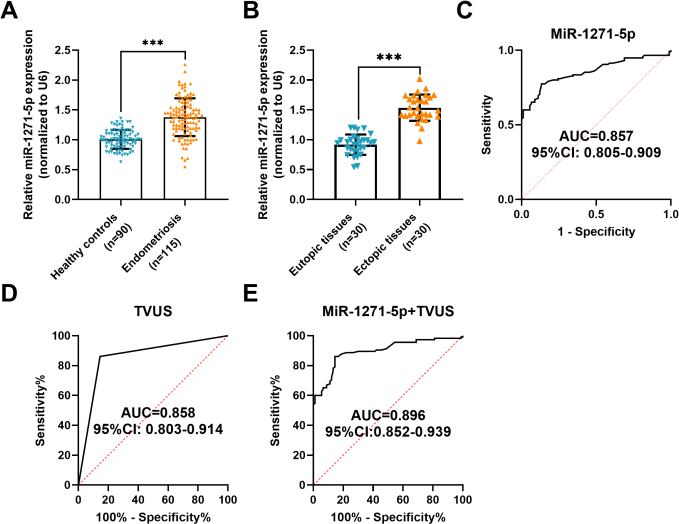
Figure 1: The diagnostic value of miR-1271-5p in endometriosis (EMs). (A) Serum miR-1271-5p expression in healthy controls and patients with EMs. (B) MiR-1271-5p expression in endometrial tissues from patients with ovarian EMs and non-EMs patients who underwent surgery for uterine fibroids. (C) Receiver operating characteristic (ROC) curve evaluating the diagnostic value of serum miR-1271-5p for EMs. (D) ROC curve for transvaginal ultrasound (TVUS) as a binary classifier (area under the curve [AUC] = 0.858). (E) ROC curve for the combined logistic regression model using the predicted probability as the test variable (AUC = 0.896). Data in A–B are shown as mean ± standard deviation (SD). ***p < 0.001 by unpaired t-test. ROC curves in C–E were analyzed using a non-parametric method, with AUC and 95% confidence interval (CI) reported. Please click here to view a larger version of this figure.
Diagnostic value of miR-1271-5p combined with TVUS in EMs
Kappa analysis showed agreement between TVUS examination and clinical diagnosis (Kappa = 0.714, p < 0.001, Table 2). As shown in Table 3, TVUS alone yielded an AUC of 0.858, with a sensitivity of 86.09%, specificity of 85.56%, and accuracy of 85.85% for the diagnosis of EMs. Serum miR-1271-5p alone demonstrated an AUC of 0.857, with a sensitivity of 77.39%, specificity of 86.67%, and accuracy of 81.46%.
For the combined model, binary logistic regression was performed using TVUS results (0 = negative; 1 = positive) and serum miR-1271-5p expression as independent variables and clinical diagnosis as the dependent variable. The model's predicted probability was used as the combined diagnostic index for ROC analysis. As shown in Figure 1D, TVUS as a binary classifier yielded an AUC of 0.858. The combined logistic regression model achieved an AUC of 0.896 (Figure 1E), with a sensitivity of 85.22%, specificity of 85.56%, and accuracy of 85.37% (Table 3). The AUC of the combined model was higher than that of either modality alone.
| Ultrasound finding | Endometriosis (n = 115) | Healthy controls (n = 90) | Total |
| Endometriosis | 99 | 13 | 112 |
| Healthy controls | 16 | 77 | 93 |
| Total | 115 | 90 | 205 |
| Kappa = 0.714 , p < 0.001 | |||
Table 2: Agreement between transvaginal ultrasound examination and clinical diagnosis of endometriosis. This table presents the distribution of positive and negative transvaginal ultrasound findings relative to the clinical diagnosis of endometriosis and reports the corresponding Kappa statistic for diagnostic agreement.
| Examination | AUC | Sensitivity | Specificity | Accuracy |
| Ultrasound | 0.858 | 86.09% (99/115) | 85.56% (77/90) | 85.85% (176/205) |
| miR-1271-5p | 0.857 | 77.39% (89/115) | 86.67% (78/90) | 81.46% (167/205) |
| Combined | 0.896*# | 85.22% (98/115) | 85.56% (77/90) | 85.37% (175/205) |
Table 3: Diagnostic performance of transvaginal ultrasound, miR-1271-5p, and their combination for endometriosis. This table compares the diagnostic performance of transvaginal ultrasound, serum miR-1271-5p, and the combined diagnostic model using area under the curve, sensitivity, specificity, and accuracy. AUC comparisons were performed using DeLong’s non-parametric method for paired ROC curves. Note: p < 0.05, combined model versus ultrasound; #p < 0.05, combined model versus miR-1271-5p. AUC values were compared using DeLong’s non-parametric method for paired ROC curves.
Five-fold cross-validation of the combined model yielded a mean AUC of 0.895 (SD = 0.033; Supplementary Figure 1). Although the sensitivity and specificity of the combined model at the default logistic regression threshold were slightly lower than those of TVUS alone, its AUC was significantly higher (p < 0.05).
Effect of miR-1271-5p on hEM15A and 12Z cells
The miR-1271-5p mimic significantly increased miR-1271-5p expression, whereas the miR-1271-5p inhibitor significantly decreased its expression in hEM15A and 12Z cells (p < 0.001, Figure 2A). The miR-1271-5p mimic significantly promoted cell proliferation, migration, and invasion, whereas the miR-1271-5p inhibitor significantly suppressed these cellular activities (p < 0.001, Figure 2B-E).
To establish a baseline comparison with normal endometrial cells, miR-1271-5p expression was measured in hEECs. As shown in Figure 2F (left), miR-1271-5p expression was significantly higher in hEM15A and 12Z cells than in hEECs (p < 0.001). To determine whether the elevated miR-1271-5p in EMs cells is specific to disease pathology or merely reflects broad inflammatory signaling, we treated hEECs, hEM15A, and 12Z cells with E2 or TNF-α for 24 h. Results showed that treatment with E2 (middle, Figure 2F) or TNF-α (right, Figure 2F) significantly upregulated miR-1271-5p expression in all three cell lines. The magnitude of increase induced by E2 and TNF-α was significantly greater in hEM15A and 12Z cells than in hEECs (p < 0.001), indicating that EMs-derived cells exhibit heightened sensitivity to hormonal and inflammatory stimuli.
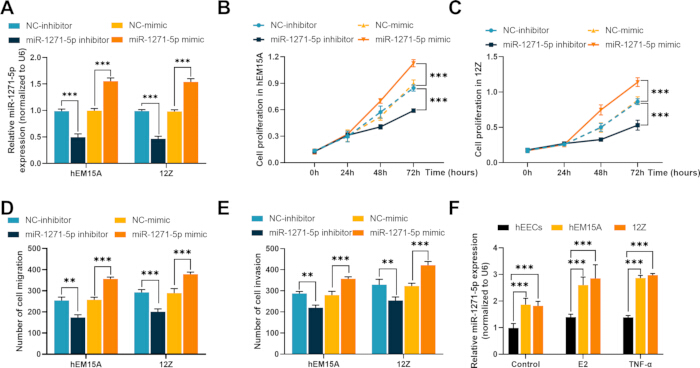
Figure 2: Effects of miR-1271-5p on hEM15A and 12Z cells. (A) Validation of miR-1271-5p overexpression and inhibition following transfection with the miR-1271-5p mimic or inhibitor. (B–C) Cell proliferation curves of hEM15A (B) and 12Z (C) cells at 0, 24, 48, and 72 h after transfection, measured using the cell counting kit-8 (CCK-8) assay. (D–E) Migration (D) and invasion (E) of hEM15A and 12Z cells assessed using porous membrane cell migration and invasion assays. (F) Relative miR-1271-5p expression, normalized to U6, in hEECs (normal human endometrial epithelial cells), hEM15A cells, and 12Z cells under basal conditions (left) and following stimulation with 17β-estradiol (E2) (middle) or tumor necrosis factor-alpha (TNF-α) (right) for 24 h. Data are shown as mean ± standard deviation (SD). **p < 0.01, and ***p < 0.001 by two-way analysis of variance (ANOVA) with Tukey’s post-hoc test for A–F. Please click here to view a larger version of this figure.
Interaction between miR-1271-5p and IGF1R
Bioinformatic analysis using the ENCORI database predicted a conserved binding site for miR-1271-5p within the 3′ untranslated region (3′UTR) of IGF1R (Figure 3A). Dual-luciferase reporter assays were then performed in hEM15A and 12Z cells. Co-transfection with the miR-1271-5p mimic significantly reduced the luciferase activity of the IGF1R-WT reporter compared with the NC-mimic control (p < 0.001), whereas the IGF1R-MUT reporter carrying a mutated seed sequence showed no significant reduction (ns, p > 0.05), confirming that miR-1271-5p directly binds to the 3’UTR of IGF1R at the predicted site (Figure 3B).
Furthermore, serum IGF1R mRNA levels were significantly lower in patients with EMs than in healthy controls (Figure 3C). Among patients with EMs, Pearson correlation analysis showed a significant inverse correlation between serum miR-1271-5p and IGF1R expression (r = −0.6607, p < 0.001, Figure 3D).
At the cellular level, IGF1R mRNA expression was significantly lower in hEM15A and 12Z cells than in hEECs (p < 0.001, Figure 3E). Western blot analysis also showed significantly lower IGF1R protein expression in hEM15A and 12Z cells than in hEECs (Figure 3F).
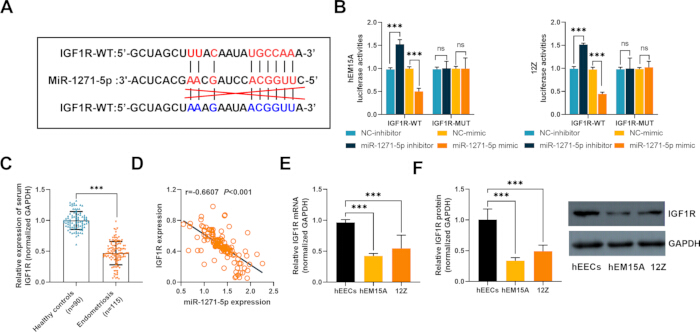
Figure 3: Interaction between miR-1271-5p and IGF1R. (A) Predicted binding-site sequence between miR-1271-5p and the 3′ untranslated region (3′UTR) of IGF1R. (B) Dual-luciferase reporter assay in hEM15A and 12Z cells. The miR-1271-5p mimic significantly reduced luciferase activity of the IGF1R-WT reporter compared with NC-mimic (p < 0.001), whereas no significant reduction was observed for the IGF1R-MUT reporter (ns, p > 0.05). (C) Relative serum IGF1R mRNA expression, normalized to GAPDH, in healthy controls and patients with EMs. (D) Pearson correlation analysis between serum miR-1271-5p and IGF1R expression in patients with EMs (r = −0.6607, p < 0.001). (E) Relative IGF1R mRNA expression, normalized to GAPDH, in hEECs, hEM15A cells, and 12Z cells. (F) Western blot analysis of IGF1R protein expression in hEECs, hEM15A cells, and 12Z cells. GAPDH was used as a loading control. Data are shown as mean ± standard deviation (SD). Not significant (ns), ***p < 0.001 by unpaired t-test (C), one-way ANOVA (E–F), or two-way ANOVA (B), with Tukey’s post-hoc test. Please click here to view a larger version of this figure.
Bioinformatic analysis of miR-1271-5p target genes
Potential target genes of miR-1271-5p were predicted using miRWalk, miRDB, TargetScan, and ENCORI. A Venn diagram identified 201 common targets (Supplementary Figure 2A), which were subjected to Gene Ontology (GO) and Kyoto Encyclopedia of Genes and Genomes (KEGG) enrichment analyses.
GO analysis showed significant enrichment in peptide hormone response, insulin receptor signaling, focal adhesion, and transcription coregulator activity (Supplementary Figure 2B). KEGG analysis showed enrichment in focal adhesion, proteoglycans in cancer, and insulin resistance pathways (Supplementary Figure 2C).
Rescue experiment
Rescue experiments were performed using si-IGF1R to silence IGF1R expression in the presence of the miR-1271-5p inhibitor. Transfection with the miR-1271-5p inhibitor significantly increased IGF1R expression in hEM15A and 12Z cells, whereas co-transfection with si-IGF1R significantly reduced this increase (p < 0.001, Figure 4A).
The miR-1271-5p inhibitor + si-IGF1R group showed significantly higher IGF1R expression than the NC-inhibitor + si-NC group (p < 0.001), indicating partial restoration of IGF1R expression following si-IGF1R co-transfection. The miR-1271-5p inhibitor significantly suppressed cell proliferation, migration, and invasion in both cell lines. Co-transfection with si-IGF1R significantly reversed these effects (p < 0.001, Figure 4B–E).
For cell proliferation (Figure 4B,C) and migration (Figure 4D), the miR-1271-5p inhibitor + si-IGF1R group remained significantly different from the NC-inhibitor + si-NC group (p < 0.05), consistent with a partial rescue effect. For cell invasion (Figure 4E), no significant difference was observed between these groups (p > 0.05).
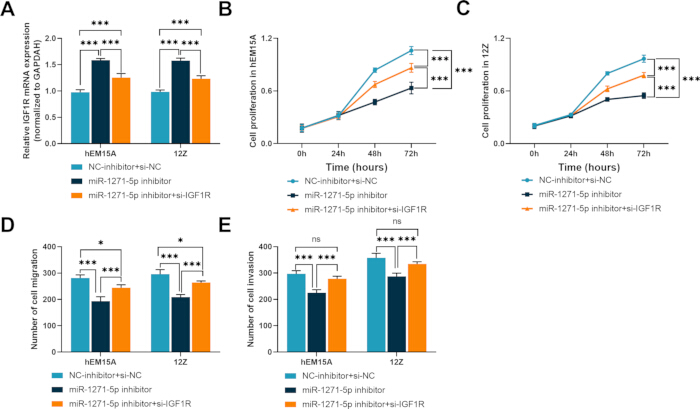
Figure 4: The role of IGF1R in mediating the effects of miR-1271-5p in hEM15A and 12Z cells. (A) IGF1R mRNA expression in hEM15A and 12Z cells transfected with the miR-1271-5p inhibitor alone or in combination with si-IGF1R. (B–C) Cell proliferation curves of hEM15A (B) and 12Z (C) cells at 0, 24, 48, and 72 h after transfection, measured using the CCK-8 assay. (D–E) Migration (D) and invasion (E) of hEM15A and 12Z cells were assessed using porous membrane cell migration and invasion assays. Data are shown as mean ± standard deviation (SD). ns, not significant; *p < 0.05; and ***p < 0.001 by two-way ANOVA with Tukey’s post-hoc test for A–E. Please click here to view a larger version of this figure.
DATA AVAILABILITY:
The clinical dataset and bioinformatics analysis data supporting the findings of this study are provided in Supplementary File 1.
Supplementary Figure 1: Internal validation of the combined diagnostic model using five-fold cross-validation. (A–E) ROC curves for the combined model (TVUS + miR-1271-5p) in each of the five validation folds. The mean AUC across all folds was 0.895 (SD = 0.033). TVUS, transvaginal ultrasound; SD, standard deviation. Please click here to download this file.
Supplementary Figure 2: Bioinformatic analysis of miR-1271-5p target genes. (A) Venn diagram showing overlapping target genes predicted using miRWalk, miRDB, TargetScan, and ENCORI (201 common targets). (B) Gene Ontology (GO) enrichment analysis, including biological process (BP), cellular component (CC), and molecular function (MF). (C) Kyoto Encyclopedia of Genes and Genomes (KEGG) pathway enrichment analysis. Please click here to download this file.
Supplementary File 1: The clinical dataset and bioinformatics analysis data. Please click here to download this file.
Discussion
Endometriosis (EMs) is a systemic inflammatory disease characterized by the growth of endometrial tissue outside the uterus26. Histological examination following surgery remains a diagnostic criterion for EMs27. However, this approach is not universally applicable. The average diagnostic delay for EMs is approximately seven years, and available diagnostic methods remain limited28,29. Consequently, non-invasive or minimally invasive diagnostic approaches are needed28,30. Ultrasound is widely used as a first-line diagnostic method for patients with suspected EMs27. Ultrasound examination in young patients with severe dysmenorrhea may facilitate earlier diagnosis31, although limitations in diagnostic accuracy and sensitivity remain32. Ultrasound and pelvic magnetic resonance imaging (MRI) have demonstrated similar sensitivity for diagnosing EMs, while their combined use may improve diagnostic accuracy33,34. Noncoding RNAs have also been investigated as minimally invasive and potentially cost-effective diagnostic biomarkers for EMs32. In the present study, miR-1271-5p expression was significantly elevated in patients with EMs compared with healthy controls and patients with uterine fibroids. Kappa and receiver operating characteristic analyses further demonstrated the diagnostic performance of TVUS combined with serum miR-1271-5p. The findings also showed an inverse regulatory relationship between miR-1271-5p and IGF1R.
MiRNAs contribute to EMs development by regulating cellular processes, including invasion, migration, adhesion, and proliferation35. Endometrial stromal cells (ESCs) represent a major cell type in the endometrium36, and alterations in their proliferation, invasion, and migration are associated with EMs progression35. Endometrial epithelial cells can also undergo epithelial-mesenchymal transition (EMT), a process associated with EMs37. Multiple studies have shown that miRNAs regulate the proliferation, migration, and invasion of ESCs35,38,39. In vitro experiments in the present study used hEM15A and 12Z cells, which are commonly used to examine EMs-associated cellular behavior40,41. Inhibition of miR-1271-5p significantly reduced cell proliferation, migration, and invasion, whereas miR-1271-5p overexpression produced the opposite effects.
The ENCORI database predicted a miR-1271-5p binding site within the 3′ untranslated region (3′UTR) of IGF1R, and this interaction was subsequently verified using a dual-luciferase reporter assay. The insulin-like growth factor (IGF) axis regulates cell proliferation, survival, and migration, and its dysregulation has been implicated in cancers and gynecological disorders42,43. IGF1R, a principal receptor mediating IGF signaling, activates downstream PI3K/AKT and MAPK/ERK pathways involved in cellular homeostasis44. Previous studies have shown that activation of IGF1R inhibits pyroptosis in endometrial stromal cells and suppresses EMs progression23. IGF1R expression has also been reported to be reduced in ovarian EMs24. Consistent with these observations, serum IGF1R mRNA expression was significantly reduced in patients with EMs and inversely correlated with miR-1271-5p expression. IGF1R mRNA and protein expression were also significantly lower in EMs-derived cells than in normal hEECs. Although these findings indicate reduced IGF1R expression in EMs, its diagnostic application remains limited because IGF1R is primarily a tissue-localized receptor. Circulating IGF1R mRNA may be detectable, including within extracellular vesicles, but this approach is not standardized, and direct tissue measurement requires invasive sampling. In contrast, serum miR-1271-5p can be detected non-invasively and demonstrated diagnostic performance in the present study. Rescue experiments further showed that si-IGF1R reversed the inhibitory effects of the miR-1271-5p inhibitor on proliferation, migration, and invasion, supporting the regulatory relationship between miR-1271-5p and IGF1R.
Bioinformatic analysis further identified miR-1271-5p target genes enriched in focal adhesion, insulin signaling, and proteoglycan-related pathways. Focal adhesion contributes to cell migration and invasion in EMs, while insulin and IGF signaling have also been implicated in disease progression45,46. These results indicate that miR-1271-5p may regulate additional downstream targets beyond IGF1R. A previous study by Yarahmadi et al. reported downregulation of miR-1271 in EM tissues47, differing from the elevated serum miR-1271-5p observed in the present study. Differences in sample type, miRNA arm specificity, and target genes may contribute to this discrepancy. The present study measured serum miR-1271-5p and examined IGF1R, whereas the previous study evaluated tissue miR-1271 without specifying the -5p or -3p arm and investigated GRB247.
Several limitations should be acknowledged. The principal diagnostic analysis used healthy controls, which limits the assessment of specificity relative to other gynecological conditions. Although uterine fibroid samples were included as a disease control group for tissue analysis, a broader range of disease controls was not evaluated. Five-fold cross-validation provided internal validation of the combined diagnostic model, but external validation in an independent cohort remains necessary. Potential confounders, including disease stage, lesion subtype, and coexisting conditions, were not fully controlled. Menstrual-cycle variability was minimized by collecting serum samples during the proliferative phase, and rASRM stage distribution was reported; however, subgroup analyses were not performed due to the limited sample size. In addition, IGF1R protein expression was not assessed in patient tissues due to the retrospective design and limited availability of archived tissue. Protein-level validation was restricted to cell lines. The study also used in vitro models without animal validation and was conducted at a single center with a relatively small sample size. Larger multicenter prospective studies, broader disease-control cohorts, tissue-level protein validation, and additional experimental models are therefore required before routine clinical implementation.
In summary, elevated miR-1271-5p expression was associated with EMs and demonstrated diagnostic value when combined with TVUS. MiR-1271-5p directly interacted with the 3′UTR of IGF1R, and inhibition of miR-1271-5p reduced proliferation, migration, and invasion in EMs-derived cells. Silencing IGF1R reversed these effects, supporting a functional relationship between miR-1271-5p and IGF1R. These findings identify serum miR-1271-5p combined with TVUS as a potential diagnostic approach and support further investigation of the miR-1271-5p/IGF1R regulatory axis in EMs.
Disclosures
The authors declare that they have no competing interests.
Acknowledgements
The funding source had no role in the study design, conduct, or data analysis.
Materials
| Name | Company | Catalog Number | Comments |
|---|---|---|---|
| 24-Well Cell Culture Plate | Corning | 3526 | Dual-luciferase assay |
| 6-Well Cell Culture Plate | Corning | 3516 | Cell transfection |
| 96-Well Cell Culture Plate | Corning | 3599 | CCK-8 assay |
| Anti-GAPDH Antibody | Cell Signaling Technology | 5174 | Western blot loading control (1:5,000) |
| Anti-IGF1R Antibody | Cell Signaling Technology | 9750 | Western blot (1:1,000) |
| BCA Protein Assay Kit | Beyotime | P0012S | Protein concentration quantification |
| Cell Counting Kit-8 (CCK-8) | Beyotime | C0038 | Cell proliferation assay |
| ChemiDoc Imaging System | Bio-Rad | 12003153 | Western blot imaging |
| Countess II Automatic Cell Counter | Thermo Fisher Scientific | AMQAX1000 | Cell counting |
| Crystal Violet Ammonium Oxalate Solution, 1% | Solarbio | G1062 | Stock solution used for cell staining |
| DMEM/F-12 Medium | Gibco | 11320033 | Cell culture medium |
| Dual-Luciferase Reporter Assay Kit | Beyotime | RG027 | Luciferase activity measurement |
| ECLIPSE Si Microscope | Nikon | MCA77201 | Imaging of stained migrated and invaded cells |
| Enhanced Chemiluminescence (ECL) Substrate | Millipore | WBKLS0500 | Western blot detection |
| Fetal Bovine Serum (FBS), Premium Plus | Gibco | A5669201 | Cell culture supplement |
| Forma Series II CO2 Incubator | Thermo Fisher Scientific | 3111GP | Cell culture at 37 °C and 5% CO2 |
| Geltrex LDEV-Free Reduced Growth Factor Basement Membrane Matrix | Gibco | A4000046702 | Extracellular matrix for invasion assay |
| Glomax Luminometer | Promega | GM-2000 | Dual-luciferase activity measurement |
| GraphPad Prism 7.0 | GraphPad Software | — | Data visualization and statistical analysis |
| H2050R High-Capacity High-Speed Refrigerated Centrifuge | Xiangyi | H2050R | Sample centrifugation |
| HRP-Conjugated Secondary Antibody | Cell Signaling Technology | 7074 | Western blot (1:3,000) |
| IBM SPSS Statistics 23 | IBM | — | Statistical analysis |
| IGF1R-3′UTR-WT and IGF1R-3′UTR-MUT Reporter Plasmids | RiboBio | Custom synthesis | Dual-luciferase reporter assay |
| ImageJ Software | NIH | — | Densitometric analysis of Western blot |
| iMark Microplate Reader | Bio-Rad | 1681135 | Absorbance measurement for CCK-8 and BCA assays |
| Lipofectamine 3000 Transfection Reagent | Thermo Fisher Scientific | L3000015 | Cell transfection |
| miR-1271-5p Mimic/Inhibitor and Negative Controls | RiboBio | Custom synthesis | Oligonucleotides for transfection |
| NanoDrop 2000 Spectrophotometer | Thermo Fisher Scientific | ND-2000 | RNA concentration and purity measurement |
| Penicillin-Streptomycin (10,000 U/mL) | Gibco | 15140122 | Cell culture antibiotic supplement |
| Phosphate-Buffered Saline (PBS), pH 7.4 | Gibco | 10010023 | Washing buffer |
| PowerTrack SYBR Green Master Mix | Invitrogen | A46110 | RT-qPCR |
| PrimeScript RT Reagent Kit | Takara | RR037A | cDNA synthesis |
| Primers for miR-1271-5p, U6, IGF1R, and GAPDH | RiboBio | Custom synthesis | RT-qPCR primers |
| Protease and Phosphatase Inhibitor Cocktail | Beyotime | P1045 | Protein preservation |
| PVDF Membrane | Millipore | IPVH00010 | Western blot transfer |
| QuantStudio 3 Real-Time PCR System | Applied Biosystems | A28567 | RT-qPCR amplification |
| RIPA Lysis Buffer | Beyotime | P0013B | Protein extraction |
| SDS-PAGE Electrophoresis Apparatus | Bio-Rad | 1658004 | Protein separation |
| si-IGF1R and si-NC | RiboBio | Custom synthesis | siRNA for IGF1R knockdown |
| Trans-Blot Turbo Transfer System | Bio-Rad | 1704150 | Protein transfer to PVDF membrane |
| Transwell Inserts, 8 µm Pore Size, 24-Well | Corning | 3422 | Porous membrane inserts for migration and invasion assays |
| TRIzol Reagent | Invitrogen | 15596026CN | RNA extraction from serum, tissue, and cells |
| Voluson E8 Ultrasound System | GE Healthcare | Voluson E8 | TVUS examination with 5–9 MHz endovaginal probe |
| Weishengxin Online Platform | bioinformatics.com.cn | — | GO and KEGG enrichment analysis |
References
- Taylor HS, Kotlyar AM, Flores VA. Endometriosis is a chronic systemic disease: clinical challenges and novel innovations. Lancet. 2021;397(10276):839–52.
- Blanco LP, Salmeri N, Temkin SM, Shanmugam VK, Stratton P. Endometriosis and autoimmunity. Autoimmun Rev. 2025;24(4):103752. doi: 10.1016/j.autrev.2025.103752.
- Marquardt RM, Tran DN, Lessey BA, Rahman MS, Jeong JW. Epigenetic Dysregulation in Endometriosis: Implications for Pathophysiology and Therapeutics. Endocr Rev. 2023;44(6):1074–95.
- Crump J, Suker A, White L. Endometriosis: A review of recent evidence and guidelines. Aust J Gen Pract. 2024;53(1–2):11–8.
- As-Sanie S et al. Endometriosis: A Review. JAMA. 2025;334(1):64–78.
- Young SW et al. Society of Radiologists in Ultrasound Consensus on Routine Pelvic US for Endometriosis. Radiology. 2024;311(1). doi: 10.1148/radiol.232191.
- Baumler M, Heiss N, Druckmann R. Endometriosis at all ages: diagnostic ultrasound. Horm Mol Biol Clin Investig. 2022;43(2):151–7.
- Piessens S, Edwards A. Sonographic Evaluation for Endometriosis in Routine Pelvic Ultrasound. J Minim Invasive Gynecol. 2020;27(2):265–6.
- Nati ID et al. Endometriosis Reccurence - is Ultrasound the Solution? Curr Med Imaging. 2024;20. doi: 10.2174/1573405620666230405093304.
- Chen-Dixon K, Uzuner C, Mak J, Condous G. Effectiveness of ultrasound for endometriosis diagnosis. Curr Opin Obstet Gynecol. 2022;34(5):324–31.
- Ferrero S, Barra F, Perrone U, Paudice M, Vellone VG. Ultrasound Diagnosis of Bowel Endometriosis. Gynecol Obstet Invest. 2025;90(3):268–78.
- Ochoa Bernal MA, Fazleabas AT. The Known, the Unknown and the Future of the Pathophysiology of Endometriosis. Int J Mol Sci. 2024;25(11):5815. doi: 10.3390/ijms25115815.
- Surmann H, Kiesel L. The Role of miRNA in Endometriosis-Related Infertility-An Update. Int J Mol Sci. 2025;26(12):5862. doi: 10.3390/ijms26125862.
- Dryja-Brodowska A, Obrzut B, Obrzut M, Darmochwal-Kolarz D. miRNA in Endometriosis-A New Hope or an Illusion? J Clin Med. 2025;14(14):4849. doi: 10.3390/jcm14144849.
- Bendifallah S et al. Salivary MicroRNA Signature for Diagnosis of Endometriosis. J Clin Med. 2022;11(3):612. doi: 10.3390/jcm11030612.
- Moustafa S et al. Accurate diagnosis of endometriosis using serum microRNAs. Am J Obstet Gynecol. 2020;223(4):557.e1–e11.
- Szubert M et al. miRNA Expression Profiles in Ovarian Endometriosis and Two Types of Ovarian Cancer-Endometriosis-Associated Ovarian Cancer and High-Grade Ovarian Cancer. Int J Mol Sci. 2023;24(24):17470. doi: 10.3390/ijms242417470.
- Nazri HM et al. The role of small extracellular vesicle-miRNAs in endometriosis. Hum Reprod. 2023;38(12):2296–311.
- Wu Y, Yuan W, Ding H, Wu X. Serum exosomal miRNA from endometriosis patients correlates with disease severity. Arch Gynecol Obstet. 2022;305(1):117–27.
- Tahermanesh K et al. Evaluation of expression of biomarkers of PLAGL1 (ZAC1), microRNA, and their non-coding RNAs in patients with endometriosis. J Gynecol Obstet Hum Reprod. 2023;52(4):102568. doi: 10.1016/j.jogoh.2023.102568.
- Galal MA et al. Insulin Receptor Isoforms and Insulin Growth Factor-like Receptors: Implications in Cell Signaling, Carcinogenesis, and Chemoresistance. Int J Mol Sci. 2023;24(19):15006. doi: 10.3390/ijms241915006.
- Sekulovski N, Whorton AE, Shi M, Hayashi K, MacLean JA, 2nd. Insulin signaling is an essential regulator of endometrial proliferation and implantation in mice. FASEB J. 2021;35(4). doi: 10.1096/fj.202002448R.
- Huang Y et al. CHS-Ⅳa activates the IGF1R/PI3K signal pathway with inhibited pyroptosis of endometrial stromal cells and progress of endometriosis. Int Immunopharmacol. 2024;143(Pt 3):113527. doi: 10.1016/j.intimp.2024.113527.
- Shi L et al. Upregulated let-7 expression in the follicular fluid of patients with endometriomas leads to dysfunction of granulosa cells through targeting of IGF1R. Hum Reprod. 2025;40(1):119–37.
- Guerriero S et al. Systematic approach to sonographic evaluation of the pelvis in women with suspected endometriosis, including terms, definitions and measurements: a consensus opinion from the International Deep Endometriosis Analysis (IDEA) group. Ultrasound Obstet Gynecol. 2016;48(3):318–32.
- Edi R, Cheng T. Endometriosis: Evaluation and Treatment. Am Fam Physician. 2022;106(4):397–404.
- Bean E et al. Prevalence of deep and ovarian endometriosis in early pregnancy: ultrasound diagnostic study. Ultrasound Obstet Gynecol. 2022;59(1):107–13.
- Kovacs Z, Glover L, Reidy F, MacSharry J, Saldova R. Novel diagnostic options for endometriosis - Based on the glycome and microbiome. J Adv Res. 2021;33:167–81.
- Nnoaham KE et al. Impact of endometriosis on quality of life and work productivity: a multicenter study across ten countries. Fertil Steril. 2011;96(2):366–73.e8.
- Garvey M. Endometriosis: Future Biological Perspectives for Diagnosis and Treatment. Int J Mol Sci. 2024;25(22):12242. doi: 10.3390/ijms252212242.
- Martire FG et al. Early noninvasive diagnosis of endometriosis: dysmenorrhea and specific ultrasound findings are important indicators in young women. Fertil Steril. 2023;119(3):455–64.
- Spiers A et al. Clues to revising the conventional diagnostic algorithm for endometriosis. Int J Gynaecol Obstet. 2025;168(1):101–11.
- Bordonne C et al. Imaging for evaluation of endometriosis and adenomyosis. Minerva Obstet Gynecol. 2021;73(3):290–303.
- Roditis A et al. Accuracy of combined physical examination, transvaginal ultrasonography, and magnetic resonance imaging to diagnose deep endometriosis. Fertil Steril. 2023;119(4):634–43.
- Zhang QC. METTL3 is aberrantly expressed in endometriosis and suppresses proliferation, invasion, and migration of endometrial stromal cells. Kaohsiung J Med Sci. 2023;39(3):266–77.
- Szukiewicz D et al. Estrogen- and Progesterone (P4)-Mediated Epigenetic Modifications of Endometrial Stromal Cells (EnSCs) and/or Mesenchymal Stem/Stromal Cells (MSCs) in the Etiopathogenesis of Endometriosis. Stem Cell Rev Rep. 2021;17(4):1174–93.
- Kapoor R, Stratopoulou CA, Dolmans MM. Pathogenesis of Endometriosis: New Insights into Prospective Therapies. Int J Mol Sci. 2021;22(21):11700. doi: 10.3390/ijms222111700.
- Li X et al. Inhibition of METTL3/m6A/miR126 promotes the migration and invasion of endometrial stromal cells in endometriosisdagger. Biol Reprod. 2021;105(5):1221–33.
- Mao H et al. Silencing of circ_0007299 suppresses proliferation, migration, and invasiveness and promotes apoptosis of ectopic endometrial stromal cells in endometriosis via .miR-424-5p-dependent modulation of CREB1. Arch Gynecol Obstet. 2023;307(1):149–61.
- Li L et al. The role of miR-27b-3p/HOXA10 axis in the pathogenesis of endometriosis. Ann Palliat Med. 2021;10(3):3162–70.
- Jin X, Feng J, Cheng X. LncRNA IGF2-AS promotes endometriosis progression through targeting miR-370-3p/IGF2 axis and activating PI3K/AKT/mTOR signaling pathway. J Assist Reprod Genet. 2022;39(12):2699–710.
- Wang P, Mak VC, Cheung LW. Drugging IGF-1R in cancer: New insights and emerging opportunities. Genes Dis. 2023;10(1):199–211.
- Li H et al. Association of Insulin-Like Growth Factor-1 With Polycystic Ovarian Syndrome: A Systematic Review and Meta-analysis. Endocr Pract. 2023;29(5):388–97.
- Zhang Y et al. Elevated insulin-like growth factor 1 receptor signaling induces antiestrogen resistance through the MAPK/ERK and PI3K/Akt signaling routes. Breast Cancer Res. 2011;13(3). doi: 10.1186/bcr2883.
- Zheng W et al. Exploration of the Modulatory Property Mechanism of ELeng Capsule in the Treatment of Endometriosis Using Transcriptomics Combined With Systems Network Pharmacology. Front Pharmacol. 2021;12:674874. doi: 10.3389/fphar.2021.674874.
- Blontzos N et al. Differential Expression of Insulin Growth Factor 1 (IGF-1) Isoforms in Different Types of Endometriosis: Preliminary Results of a Single-Center Study. Biomolecules. 2023;14(1):7. doi: 10.3390/biom14010007.
- Yarahmadi G et al. Evaluation of the relationship between miR-1271 and GRB2 gene in endometriosis. Eur J Obstet Gynecol Reprod Biol. 2022;277:12–15.