ELISPOT Assay: Detection of IFN-γ Secreting Splenocytes
1. Set-up
Buffers and Reagents
- Sterile phosphate-buffered saline (PBS) without calcium or magnesium
- Coating buffer- either sterile PBS or carbonate buffer
- Assay diluent- 10% fetal bovine serum (FBS) in PBS
- Cell culture medium- RPMI 1640 with 10% FBS, penicillin/streptomycin, & L-glutamine
- Wash buffer- PBS containing 0.05% Tween20
- Double distilled water (ddH2O)
- Detection substrate- 100 mg AEC (3-amino-9-ethyl-carbazole) in 10 mL DMF (N,N, Dimethylformamide).
Equipment
- Laminar flow hood
- Humidified incubator (set at 37°C, 5% CO2)
- Automated ELISPOT Reader or dissecting microscope
Materials
- ELISPOT plates
- Sterile and nonsterile reservoirs
- Pipettors and tips
- Sterile serological pipettes
- Sterile, conical polypropylene tubes
- Two squeeze bottles for plate washing
Assay Specific Reagents
- Cells- primary cells or cell lines (here, splenocytes from C57BL/6 mice were used)
- Stimulants- mitogen or antigen (here, phorbol 12-myristate 13-acetate (PMA, 50 ng/mL) and ionomycin (1 µM) were used)
- Primary antibody- biotinylated anti-cytokine detecting antibody (diluted to 2 µg/mL in assay diluent)
- Secondary antibody- streptavidin-horseradish peroxidase (SAv-HRP)
2. Procedure
Coating
- Keeping the conditions sterile and inside a laminar flow hood, dilute the purified anti-cytokine capture antibody to a final concentration of 0.5-4.0 µg/mL in sterile coating buffer. (Note: for IFN- γ and IL-6 use 5 µg/mL).
- Transfer the capture antibody solution, 100 µL/well, to the ELISPOT plate.
- Cover the plate with a plate cover and seal it to prevent evaporation.
- Incubate the plate overnight at 4°C.
Blocking
- The next day, uncover the ELISPOT plate in the laminar flow hood. Quickly invert the plate onto sterile wipes to remove the capture antibody solution from each well.
- Then, add 200 µL of cell culture medium to each well. This step will block non-specific binding during the assay.
- Replace the plate cover and incubate the plate for 2 hours at 37°C.
Plating and Activating Cells
- While the plate is incubating, prepare a 2X mitogen solution containing 50 ng/mL PMA and 1 µM ionomycin in cell culture medium.
- Then, prepare target cellular suspensions to a stock concentration of 2 x 10⁶ cells/mL.
- After the incubation is complete, remove the cell culture medium from each well by quickly inverting the plate onto sterile wipes inside the laminar flow hood.
- Next, generate a 2X serial dilution of the stock cell suspension solution. To do so, first add 200 µL of the prepared cellular suspension stock solution into the wells in the top row of the ELISPOT plate.
- Then, add 100 µL of plain cell culture medium to the next five rows of the plate below the rows containing cellular stock solution.
- After that, perform a 2X serial dilution by pipetting 100 µL of the cellular suspension from the top row into the row directly below. Ensure proper mixing by gently pipetting this solution up and down to ensure even distribution the cells.
- Repeat this process for the remaining four rows.
- Leave the sixth row with the culture medium only. It will serve as experimental control.
- Next, add 100 µL of the prepared mitogen solution to the experimental wells of the first five rows of the plate. In the control wells and the sixth row, add 100 µL of the cell culture media without mitogen.
- Replace the plate cover and incubate plate at 37°C, 5% CO2 in an incubator for 20-48 hours. (Note: 20-24 hours is typically sufficient for detecting IL-2 and TNF- α, whereas 48 hours is optimal for IL-4 and IFN-γ).
Detection
Primary antibody
- Prepare the biotinylated anti-cytokine detecting antibody to a concentration of 2 µg/mL in assay diluent.
- Prepare 20-25 mL of wash buffer at this time by mixing 0.05% Tween-20 in PBS.
- After the incubation is complete, uncap the plate and quickly invert it over a sink to remove all liquid from the wells. (Note: After this point the plate no longer has to be kept sterile).
- Then, wash the plate by adding ~200 µL wash buffer to each well. Expel this liquid by quickly inverting and flicking the plate over a sink. Repeat this process for a total of five washes.
- Next, add 100 µL of the diluted biotinylated anti-cytokine detecting antibody solution to each well. Incubate at room temperature for 2 hours at room temperature or overnight at 4°C.
Secondary antibody
- After incubation is complete, expel the detection antibody by inverting and flicking the plate over the sink.
- As before, wash the plate 5 times with ~200 µL wash buffer, expelling the liquid between each wash.
- Next add 100 µL of diluted streptavidin-horseradish peroxidase solution to each well (diluted to its pre-determined optimal concentration in assay diluent).
- Replace the plate cover and incubate at room temperature for 1.5-2 hours at 37°C.
Substrate
- After the incubation, no more than 15 minutes before use, first activate AEC substrate solution according to manufacturer's instructions.
- Next, discard the contents of the wells and wash the plate five times with wash buffer, as before.
- Then, immediately add 100 µL of prepared AEC substrate solution into each well.
- Incubate the plate at room temperature for ~10-20 minutes while monitoring the spot development.
- Stop the reaction by rinsing the plate with water and flicking the plate over the sink.
- Blot the plate on paper towels and allow the plate to air dry overnight or until it is completely dry. Removing the plastic tray under the plate will facilitate drying.
3. Data Acquisition and Analysis
- After drying, the spots are ready to be counted with an automated plate reader. Here, the CTL Immunospot reader is used, but this protocol can be adapted for any reader.
- First turn on the instrument, then the computer. Then, open the CTL program and click "scan count."
- Push "eject" for the tray to extend from the machine. Then, remove the plastic adaptor and align row "A" on the ELISPOT plate and adaptor.
- Choose a file name and location for the file to be saved and load the plate onto the tray.
- Then, click "load" on the software and close the door on the side of the machine.
- Press "start- after counting." Ensure that the file is saved, and then open the quality control "QC" software to analyze the data and count the number of spots.
Notes:
- The minimum number of cells should be determined in preliminary experiments. The optimal number of spots is ~50/well. If too many cells are loaded, it will be hard to detect distinct spots. Additionally, the cells will overlap and may not form a monolayer on the membrane, thus the level of detection may be reduced.
- When optimizing the experiment, consider the expected expression level of the target protein. The lower the expression, the higher the number of cells required per well.
- Unlike ELISA, it is better to hand wash the plate rather than use a plate washer. ELISPOT plates are more delicate and one should avoid puncturing the PVDF membrane.
- One should limit movement of the plate during the incubation period as it can cause the spots to smudge.
- Plates should be stored in the dark, as exposure to direct light causes spots to fade.
Source: Tonya J. Webb1
1 Department of Microbiology and Immunology, University of Maryland School of Medicine and the Marlene and Stewart Greenebaum Comprehensive Cancer Center, Baltimore, Maryland 21201
ELISPOT is a standardized, reproducible assay used to detect cellular immune responses. The assay utilizes an enzyme-linked immunosorbent assay (ELISA)- based method to detect single-cell immune responses which can be visualized by spots, hence the name ELISPOT. ELISPOT was first described in 1983, by Czerkinsky, as a method of enumerating the number of B cell hybridomas producing antigen-specific immunoglobulins (1). The same group further developed the assay to measure the frequency of cytokine producing T lymphocytes. Now ELISPOT has become a gold standard for measuring antigen-specific T cell immunity in clinical trials and vaccine candidates. For example, after vaccination or during an infection, plasma cells and memory B cells secrete antibodies that provide protection. Typically, these B cell responses are assessed by measuring serum titers of antigen-specific antibodies. However, this type of analysis, typically measured by ELISA, may not include memory B cells, which can be present even in the absence of detectable serum antibody levels. Furthermore, it has been well-established that circulating memory B cells are important for the rapid and protective antibody response observed following pathogen re-exposure, thus it is critical to be able to detect these cells. Therefore, to clearly assess antigen-specific memory B-cell responses, both ELISA and ELISPOT should be used (2).
ELISPOT assay uses a plate containing membrane-lined wells that are coated with antibodies in order to capture secreted proteins of interest. Then, the plate is loaded with cells and stimuli to induce protein production. The secreted proteins are captured by the antibodies coated on the surface. After appropriate incubation time, cells are removed and the secreted molecule is detected by using a biotinylated antibody that is specific for a different epitope, as compared to the capture antibody. Next, streptavidin peroxidase is added, followed by the addition of a substrate that allows the detection of the spots (Figure 1). The strength of this assay is that it allows one to quantitate the number of cells producing the protein of interest. Importantly, one can assess if there are changes in the total number of cells producing a specific protein or if individual cells within a population are producing more protein. Moreover, it can provide information regarding kinetics and can be used to assess overall immune activation (mitogen stimulation) relative to antigen-specific responses (antigen simulation). The ELISPOT assay will permit the detection one activated cell amongst 300,000 cells following mitogenic or antigen-specific activation.
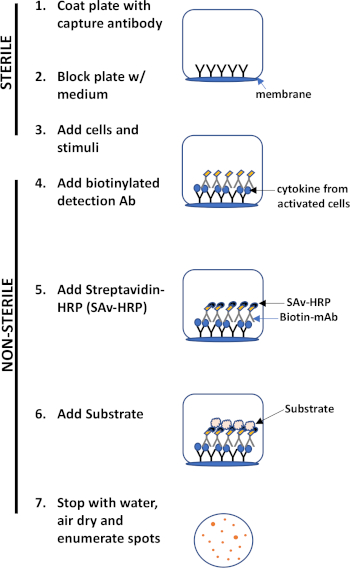
Figure 1: ELISPOT protocol overview.
The major advantages of this assay are its- a. Simplicity- the protocol is relatively simple and straightforward. It does not require technical expertise, b. Sensitivity- it permits the detection of immune cells at the single cell level and requires very few cells compared to other methods such as flow cytometry, c. Functionality- it provides quantitative data regarding immune function.
This lab exercise demonstrates the ELISPOT protocol for detection of IFN-γ secreting-splenocytes, but as mentioned above this assay can also be used to assess antibody secretion by B cells (3).
1. Set-up
Buffers and Reagents
- Sterile phosphate-buffered saline (PBS) without calcium or magnesium
- Coating buffer- either sterile PBS or carbonate buffer
- Assay diluent- 10% fetal bovine serum (FBS) in PBS
- Cell culture medium- RPMI 1640 with 10% FBS, penicillin/streptomycin, & L-glutamine
- Wash buffer- PBS containing 0.05% Tween20
- Double distilled water (ddH2O)
- Detection substrate- 100 mg AEC (3-amino-9-ethyl-carbazole) in 10 mL DMF (N,N, Dimethylformamide).
Equipment
- Laminar flow hood
- Humidified incubator (set at 37°C, 5% CO2)
- Automated ELISPOT Reader or dissecting microscope
Materials
- ELISPOT plates
- Sterile and nonsterile reservoirs
- Pipettors and tips
- Sterile serological pipettes
- Sterile, conical polypropylene tubes
- Two squeeze bottles for plate washing
Assay Specific Reagents
- Cells- primary cells or cell lines (here, splenocytes from C57BL/6 mice were used)
- Stimulants- mitogen or antigen (here, phorbol 12-myristate 13-acetate (PMA, 50 ng/mL) and ionomycin (1 µM) were used)
- Primary antibody- biotinylated anti-cytokine detecting antibody (diluted to 2 µg/mL in assay diluent)
- Secondary antibody- streptavidin-horseradish peroxidase (SAv-HRP)
2. Procedure
Coating
- Keeping the conditions sterile and inside a laminar flow hood, dilute the purified anti-cytokine capture antibody to a final concentration of 0.5-4.0 µg/mL in sterile coating buffer. (Note: for IFN- γ and IL-6 use 5 µg/mL).
- Transfer the capture antibody solution, 100 µL/well, to the ELISPOT plate.
- Cover the plate with a plate cover and seal it to prevent evaporation.
- Incubate the plate overnight at 4°C.
Blocking
- The next day, uncover the ELISPOT plate in the laminar flow hood. Quickly invert the plate onto sterile wipes to remove the capture antibody solution from each well.
- Then, add 200 µL of cell culture medium to each well. This step will block non-specific binding during the assay.
- Replace the plate cover and incubate the plate for 2 hours at 37°C.
Plating and Activating Cells
- While the plate is incubating, prepare a 2X mitogen solution containing 50 ng/mL PMA and 1 µM ionomycin in cell culture medium.
- Then, prepare target cellular suspensions to a stock concentration of 2 x 10⁶ cells/mL.
- After the incubation is complete, remove the cell culture medium from each well by quickly inverting the plate onto sterile wipes inside the laminar flow hood.
- Next, generate a 2X serial dilution of the stock cell suspension solution. To do so, first add 200 µL of the prepared cellular suspension stock solution into the wells in the top row of the ELISPOT plate.
- Then, add 100 µL of plain cell culture medium to the next five rows of the plate below the rows containing cellular stock solution.
- After that, perform a 2X serial dilution by pipetting 100 µL of the cellular suspension from the top row into the row directly below. Ensure proper mixing by gently pipetting this solution up and down to ensure even distribution the cells.
- Repeat this process for the remaining four rows.
- Leave the sixth row with the culture medium only. It will serve as experimental control.
- Next, add 100 µL of the prepared mitogen solution to the experimental wells of the first five rows of the plate. In the control wells and the sixth row, add 100 µL of the cell culture media without mitogen.
- Replace the plate cover and incubate plate at 37°C, 5% CO2 in an incubator for 20-48 hours. (Note: 20-24 hours is typically sufficient for detecting IL-2 and TNF- α, whereas 48 hours is optimal for IL-4 and IFN-γ).
Detection
Primary antibody
- Prepare the biotinylated anti-cytokine detecting antibody to a concentration of 2 µg/mL in assay diluent.
- Prepare 20-25 mL of wash buffer at this time by mixing 0.05% Tween-20 in PBS.
- After the incubation is complete, uncap the plate and quickly invert it over a sink to remove all liquid from the wells. (Note: After this point the plate no longer has to be kept sterile).
- Then, wash the plate by adding ~200 µL wash buffer to each well. Expel this liquid by quickly inverting and flicking the plate over a sink. Repeat this process for a total of five washes.
- Next, add 100 µL of the diluted biotinylated anti-cytokine detecting antibody solution to each well. Incubate at room temperature for 2 hours at room temperature or overnight at 4°C.
Secondary antibody
- After incubation is complete, expel the detection antibody by inverting and flicking the plate over the sink.
- As before, wash the plate 5 times with ~200 µL wash buffer, expelling the liquid between each wash.
- Next add 100 µL of diluted streptavidin-horseradish peroxidase solution to each well (diluted to its pre-determined optimal concentration in assay diluent).
- Replace the plate cover and incubate at room temperature for 1.5-2 hours at 37°C.
Substrate
- After the incubation, no more than 15 minutes before use, first activate AEC substrate solution according to manufacturer's instructions.
- Next, discard the contents of the wells and wash the plate five times with wash buffer, as before.
- Then, immediately add 100 µL of prepared AEC substrate solution into each well.
- Incubate the plate at room temperature for ~10-20 minutes while monitoring the spot development.
- Stop the reaction by rinsing the plate with water and flicking the plate over the sink.
- Blot the plate on paper towels and allow the plate to air dry overnight or until it is completely dry. Removing the plastic tray under the plate will facilitate drying.
3. Data Acquisition and Analysis
- After drying, the spots are ready to be counted with an automated plate reader. Here, the CTL Immunospot reader is used, but this protocol can be adapted for any reader.
- First turn on the instrument, then the computer. Then, open the CTL program and click "scan count."
- Push "eject" for the tray to extend from the machine. Then, remove the plastic adaptor and align row "A" on the ELISPOT plate and adaptor.
- Choose a file name and location for the file to be saved and load the plate onto the tray.
- Then, click "load" on the software and close the door on the side of the machine.
- Press "start- after counting." Ensure that the file is saved, and then open the quality control "QC" software to analyze the data and count the number of spots.
Notes:
- The minimum number of cells should be determined in preliminary experiments. The optimal number of spots is ~50/well. If too many cells are loaded, it will be hard to detect distinct spots. Additionally, the cells will overlap and may not form a monolayer on the membrane, thus the level of detection may be reduced.
- When optimizing the experiment, consider the expected expression level of the target protein. The lower the expression, the higher the number of cells required per well.
- Unlike ELISA, it is better to hand wash the plate rather than use a plate washer. ELISPOT plates are more delicate and one should avoid puncturing the PVDF membrane.
- One should limit movement of the plate during the incubation period as it can cause the spots to smudge.
- Plates should be stored in the dark, as exposure to direct light causes spots to fade.
The Enzyme-linked Immunospot, or ELISPOT, assay is a method to analyze the immune response to a pathogen or cell damage. It allows for quantification of the activation of different immune cells by detecting specific proteins they secrete. For example, ELISPOT is commonly used for measuring T-cell responses upon exposure to a foreign antigen by detecting secreted cytokines.
For a cytokine-based ELISPOT assay, the process begins with the coating of an ELISPOT microplate with a capture antibody, which is specific to the target cytokine. After the antibody coating, T-cells are added to the wells and stimulated by an external agent, like anti-CD3 antibody, for example. The cells then secrete the target cytokine, which immediately gets immobilized by the capture antibody. Since the protein is captured instantly post-secretion from live cells, without dilution or degradation, this assay has a high accuracy. After the target cytokine is immobilized, a detection antibody is added, which also binds to the captured cytokine.
The ELISPOT technique can also be used to quantify memory B-cells after an infection or vaccination by analyzing their production of specific antibodies. In an antibody-based ELISPOT, a specific antigen is used instead of an antibody for either the capture step, where the antigen will be bound to the plate, or at the detection step, where the antigen detects the target antibody post-capture. In all variations of the process, for T-cells or B-cells, the detection antibody or antigen is biotinylated, which allows it to bind to a streptavidin-conjugated detection enzyme, such as horseradish peroxidase. Then, upon addition of the peroxidase's substrate, AEC, a dark, insoluble precipitate is produced. This precipitate marks the location of the captured protein, and each secretory cell results in a visible spot, which can be quantified using an ELISPOT reader or a microscope. The size of the spots is a relative estimate of the amount of protein secreted from each cell. This assay can detect immune responses from single cells, even in relatively small subpopulations of secretory cells, making it useful for studying immune responses at the cellular level.
In this video, you will learn how to perform an ELISPOT assay and then quantify the spots representing the secretory cells.
Throughout the experiment, ensure sterile conditions by working in a laminar flow hood and wearing gloves.
All calculations in this protocol are based on the volume needed for one 96-well plate.
First, dilute the anti-cytokine capture antibody. To do this, transfer 10 milliliters of buffer into a sterile 15 milliliter conical tube. Then, use a pipette to add 10 microliters of one milligram per milliliter of monoclonal antibody to the buffer to create a solution with a final concentration of one microgram per milliliter. Next, pour the capture antibody solution into a sterile reservoir and, using a multichannel pipette, distribute 100 microliters into each well of a 96-well ELISPOT plate.
Cover the plate with a plate cover, seal it to prevent evaporation, and incubate overnight at four degrees Celsius. The next day, uncover the ELISPOT plate in the laminar flow hood. Quickly invert the plate onto sterile wipes to remove the capture antibody solution from each well. Next, use a multichannel pipette to add 200 microliters of cell culture medium to each well. This step will block non-specific binding during the assay. Replace the plate cover and incubate in a 37 degrees Celsius incubator for two hours.
While the plate is incubating, prepare a 2X mitogen solution by adding one microliter of PMA and 20 microliters of ionomycin to 10 milliliters of cell culture medium to achieve a final concentration of 15 nanograms per milliliter PMA and one micromolar ionomycin.
Cellular suspensions of mouse splenocytes should also be prepared at this time in a sterile hood. Using a microscope and hemocytometer, measure the concentration of cells and adjust the total volume until a stock concentration of two million cells per milliliter is reached.
After incubation is complete, quickly invert the plate onto sterile wipes to remove the cell culture medium from each well. Next, add 200 microliters of the prepared cellular suspension stock solution to the wells in the top row of the ELISPOT plate. Set up the experiment in triplicate, so that each cell type tested will be plated in a set of three grouped columns. Below this, add 100 microliters of plain cell culture medium to the next five rows of the plate, below the rows containing cellular stock solution.
Next, perform a serial dilution by pipetting 100 microliters of the cell suspension from the top row into the row directly below, gently pipetting the solution up and down to evenly distribute the cells. Repeat this process for the remaining rows, moving 100 microliters from the previous row to the row below at each step, continuing until the fifth row has been serially diluted. Leave the sixth row with cell culture medium only, to serve as a control. To stimulate the cells in the experimental wells of the plate, add 100 microliters of the prepared mitogen solution to the cellular suspensions in each well of rows one through five. Be sure to leave the sixth row, which will serve as the control, unstimulated. Replace the lid and incubate the plate at 37 degrees Celsius and 5% CO2 for 24 to 48 hours.
Prepare the diluted biotinylated anti-cytokine detecting antibody. First, prepare 50 milliliters of assay diluent by adding 5 milliliters of 10% fetal bovine serum to 45 milliliters of PBS. Next, dilute the detecting antibody to a concentration of 2 micrograms per milliliter in assay diluent. Also, prepare 20 to 25 milliliters of wash buffer at this time, by mixing .05% Tween-20 and PBS.
After the incubation is complete, uncap the plate and quickly invert it to remove all liquid from the wells. Wash the plate by adding about 200 microliters of wash buffer to each well. Expel this liquid by quickly inverting and flicking the plate over a sink. Repeat this process four more times for a total of five washes. Next, add 100 microliters of the diluted detection antibody solution to each well, replace the lid, and incubate at room temperature for two hours. After incubation, expel the detection antibody solution from the wells of the plate by inverting and flicking the plate over the sink.
As before, wash the plate five times with wash buffer, expelling the liquid between each wash. After the final wash, prepare the streptavidin- horseradish peroxidase solution by diluting it according to the manufacturer's instructions. Next, with the wells of the plate empty, add 100 microliters of diluted streptavidin- horseradish peroxidase solution to each well. Place the lid back onto the plate and incubate at room temperature for two hours.
After the incubation, no more than 15 minutes before use, activate pre-made AEC substrate solution. Discard the contents of the wells and wash the plate five times with wash buffer, as before. Then, immediately add 100 microliters of prepared AEC substrate solution into each well. Leave the plate at room temperature to develop for approximately 10 to 20 minutes, while monitoring spot development. These spots will appear as small, darkened circles on the surface of the wells. Then, stop the reaction by rinsing the plate with water and flicking it over the sink. Blot the plate on paper towels and allow to air dry overnight or until completely dry. Removing the plastic tray under the plate will facilitate drying. After drying, the spots are ready to be counted with an automated plate reader.
Here, the CTL ImmunoSpot reader is used, but this protocol can be adapted for any reader. Then, open the CTL program and click on Scan Count. Push eject for the tray to extend from the machine. Then, remove the plastic adapter and align row A on the ELISPOT plate and adapter. Choose a file name and location for the file to be saved and load the plate and adapter onto the tray. Click Load on the software and close the door on the side of the machine. Then, press Start After Counting. Ensure that the file is saved and then open the Quality Control QC software to analyze the data and count the number of spots. Export this data as an Excel file. Once analysis is complete, click Eject to retrieve the plate.
In this experiment, cells from wild type and tumor-bearing mice were plated and analyzed for IFN gamma. Notice that the number of spots decreases with decreasing cell concentration. Typically, ELISPOT data are presented as the number of spot counts per number of cells plated. In this example, the number of spots were displayed in a bar graph, with each respective cellular concentration listed on the x-axis. Notice that the number of spots indicates the number of activated cells per total number of cells in a given population.
In this ELISPOT assay, splenic leukocytes from wildtype and tumor-bearing mice were analyzed for IFN-γ. Figure 2 A shows the visual image of the assay result. The numbers in the green color indicate the number of spots per well (TNTC indicates "too numerous to count"). Notice that the number of spots decreases with decreasing cell concentration.
The ELISPOT assay allows one to assess immune cell activation by determining the number of cells secreting a specific analyte. The size and intensity of the spots provides information regarding the amount of analyte being produced by each cell. The protocol outlined above detailed the detection of a single cytokine. However, recent developments have enhanced the utility of this assay. Currently, one can use fluorescent detection dyes in order to detect multiple analytes within a well. This permits the detection of differ...
Chapters in this video
0:01
Concepts
3:01
Coating and Blocking the Plate
4:42
Plating and Activating Cells
7:05
Detection
9:03
Substrate
10:01
Data Acquisition and Analysis
11:07
Results
Videos from this collection: