Platelets react rapidly to a range of stimuli. This paper describes a real-time flow cytometry-based platelet function assay and a newly developed bespoke open-source software (Kinetx) to enable quantitative kinetic measurements of platelet granule release, fibrinogen binding, and intracellular calcium flux.
Method Article
Kinetx: A Combined Flow Cytometry Assay and Analysis Software Framework to Quantitatively Measure and Categorize Platelet Activation in Real-time.
* These authors contributed equally
In This Article
Summary
Abstract
Platelets react rapidly to vascular injury and undergo activation in response to a range of stimuli to limit blood loss. Many platelet function tests measure endpoint responses after a defined time period and not the rate of platelet activation. However, the rate at which platelets convert extracellular stimuli into a functional response is an essential factor in determining how efficiently they can respond to injury, bind to a forming thrombus, and signal to recruit other platelets. This paper describes a flow cytometry-based platelet function assay that enables simultaneous data acquisition and sample stimulation and utilizes newly developed bespoke open-source software (Kinetx) to enable quantitative kinetic measurements of platelet granule release, fibrinogen binding, and intracellular calcium flux. Kinetix was developed in R so that users can alter parameters such as degree of smoothing, identification of outlying data points, or time scales. To aid users unfamiliar with the R environment, Kinetix analysis of data can be performed by a single command. Together, this allows real-time platelet activation metrics, such as rate, acceleration, time to peak-rate, time to peak-calcium, and qualitative shape changes, to be accurately and reproducibly measured and categorized. Kinetic measurements of platelet activation give a unique insight into platelets' behavior during the first stages of activation and may provide a method of predicting the recruitment of platelets into a forming thrombus.
Introduction
Platelets play a central role in hemostasis and generate a rapid and multifaceted response to vascular injury1,2. Current platelet function tests measure various aspects of platelet reactivity, representative of their hemostatic actions in vivo. Traditionally, platelet function has been assessed using endpoint assays that measure fibrinogen binding, granule release, or platelet aggregation in platelets stimulated for long enough to achieve maximal activation3,4. These tests do not take into account the time taken for platelets to convert extracellular stimuli to intracellular signals and calcium flux and subsequently degranulate and bind to the growing thrombus. Blood flows at a shear rate of up to 20 dynes/cm3 in veins and 80 dynes/cm3 in large arteries5, emphasizing the need for platelets to counteract this rapid rate of flow by detecting, processing, and responding to extracellular stimuli rapidly to bind into a forming thrombus and support its ongoing growth.
The rate of platelet activation can vary independently of the maximum extent of platelet activation. Integrin-linked kinase (ILK) is a protein involved in regulating β1 and β3 integrins in platelets6,7. Inhibition or specific deletion of ILK in vivo demonstrated that the rate, but not the maximal extent of platelet activation, was affected in the absence of functional ILK8. Differences between the rate of aggregation and maximum level of aggregation were also identified in mice deficient in CALDAG GEFI9,10, a signaling molecule involved in the regulation of inside-out signaling via RAP111.
These findings demonstrate that platelet rate and maximal activation levels can be autonomous and that measurements of maximal activation may not be descriptive of platelet behavior up to this point. These differences in the time taken for platelets to become activated may profoundly affect their initial binding to the growing thrombus, impacting the architecture and overall size of the thrombus. These variations between platelet rate and maximal activation highlight the need for an assay to accurately measure the rate of platelet activation and can be used to detect variances within the population.
This paper describes a method that accurately measures platelet activation and calcium flux in real-time and calculates a range of metrics, including the rate at which platelets become activated and the time taken for platelets to reach the maximum rate of activation and maximum calcium flux. These kinetic measurements of platelet activation give a better insight into the behavior of platelets during the first stages of thrombus formation and provide a method for predicting how quickly platelets can be recruited into a forming thrombus.
Protocol
This protocol used human whole blood and platelets from healthy donors with no underlying health conditions and not taking any medication known to interfere with platelet function after written informed consent and was approved by the University of Reading Research Ethics Committee.
1. Collection of blood and preparation of platelet-rich plasma
- Collect the peripheral blood in a vacutainer containing 3.2% sodium citrate
- Discard the first 3 mL.
- Let the blood rest at 30 °C for 30 min prior to centrifugation.
- Prepare the platelet-rich plasma (PRP) by centrifugation at 140 x g for 20 min at room temperature before incubation at 37 °C for the assay duration, which was finished within 60 min of centrifugation.
2. Instrument preparation
NOTE: A non-pressurized fluidics system is essential for real-time flow cytometry as platelets are stimulated simultaneously as the flow cytometer records events.
- Use a non-pressurized flow cytometer to carry out real-time flow cytometry.
- To perform the assay at 37 °C, attach a mouse dissection mat to the stage to place the 96-well plate. Heat the mat to 37 °C for the duration of the assay.
- Place a 96-well plate on top of the heated mat to allow for continuous incubation at 37 °C (Figure 1)
3. Assay preparation
- Fibrinogen binding and P-selectin expression
- Coat a polypropylene 96-well round-bottomed, non-treated microtitre plate with 5% bovine serum albumin (BSA) in Hepes buffered saline (HBS; 10 mM Hepes pH 7.4; 150 mM NaCl, 5 mM KCl, 1 mM MgSO4·7H20) overnight at 4 °C .
- Prepare the antibody mix in HBS containing 5 mM glucose (HBS-G). Add fluorescein isothiocyanate (FITC)-labelled anti-fibrinogen antibody, (FITC-FGN; dilution 1: 37.5 (v/v)) and allophycocyanin (APC)-labelled anti-P-selectin (APC-CD62P; dilution 1: 37.5 (v/v)) to HBS-G (final volume: 225 µL) and incubate in a 96-well plate at 37 °C .
- Immediately before collecting events, add PRP to the HBS-G-antibody mix at a dilution of 1:600 (v/v).
NOTE: A low volume of PRP is required to ensure the event limit is not exceeded and reduce platelet aggregation in the sample. Platelet dilution was examined in pilot studies and does not affect activation rate. - Incubate the activation mix containing FITC-FGN, (dilution 1: 37.5 (v/v)) and APC-CD62P (dilution 1: 37.5 (v/v)) and agonist at 37 °C. The agonists include thrombin (thr; 0.0012-1 U/mL) in the presence of Gly-Pro-Arg-Pro peptide (GPRP; 1.18 mM), cross-linked collagen related peptide (CRP-XL; 0.004-10 µg/mL), adenosine diphosphate (ADP; 0.04-4 µM), epinephrine (epi; 20-200 µM), 9,11-Dideoxy-11α,9α-epoxymethanoprostaglandin F2α (U46619; 0.02-5 µM), and thrombin receptor activator peptide 6 (TRAP-6; 0.04-10 µM).
- Calcium flux
NOTE: This assay was performed using a commercial calcium assay kit (Table of Materials)- Coat a polypropylene 96-well round-bottomed, non-treated microtitre plate with 5% BSA in Hepes buffered saline overnight at 4 °C.
- To prepare the calcium assay dye, add 100 mL of calcium assay buffer and 2 mL probenecid stock solution (250 mM) to one bottle of calcium reagent to obtain 2x calcium reagent loading solution.
- To prepare Fluo-4/HBS-G, dilute the calcium assay dye with HBS-G at a 1:1 ratio, filter through a 0.22 µM filter. Add 225 µL of Fluo-4/HBS-G to the appropriate wells of a 96-well plate at 37 °C.
- Incubate PRP at 37 °C for 30 min at a 1:1 dilution with Fluo-4/HBS-G.
- Prepare the activation mix in Fluo-4/HBS-G and incubate at 37 °C. The agonists include thrombin (1 U/mL) in the presence of GPRP, CRP-XL (0.5 µg/mL) ADP (1 µM), epinephrine (20 µM), U46619 (1 µM), and TRAP-6 (1 µM).
- Immediately before collecting events, add PRP/Fluo-4/HBS-G to the 225 µL of Fluo-4/HBS-G mix at a final PRP dilution (after agonist addition) of 1: 600 (v/v; 0.5 mL in 300 mL of the final volume).
4. Assay procedure and data collection
- Set the flow cytometer to a flow rate on 'slow' with an average number of 1000 events per second (eps) and a maximum of 3000 eps. Set the threshold to 20000 to avoid recording cell debris.
- Gate the platelet population using forward scatter (FSC), and side scatter (SSC) plots. For data collection, plot FSC-A vs. SSC-A to accurately gate the platelet population and FL1 or FL4 vs. time to record the fluorescent events over time.
- The flow cytometer takes 14 s to begin recording events; after this, let the instrument record events in each well for another 5 s before adding 75 µL of the activation mix rapidly using a gel loading tip to ensure spontaneous mixing (Figure 1).
- Collect the events for 5 min and set up the plots to record the 488 (FL1; 533/30 filter - FITC-fibrinogen/FLUO-4) channel vs. time and the 633 (FL4; 675/25 filter - APC-P-selectin) channel vs. time.
- Save the plot data for the 488 and 633 channels from each well as CSV files.
5. Data analysis
- Download the latest version of Kinetx12.
NOTE: The download includes all code required to analyze the data generated from the assay and is accompanied by a test set of experimental data from ten donors and outputs generated from their analysis (these results can be regenerated and validated via the following procedures) (Figure 2). - Set up R environment
- Use the programming language R via the RStudio environment. Install R13, RStudio14 and the following packages: ggplot2, dplyr, plotrix, minpack.lm, tidyverse, psych. Ensure that all pre-requisite packages have been successfully installed.
- Create Metadata: Place a text file (called wellData.txt) inside the same directory as the data. It describes the agonists, their concentrations, any antibodies, and the assay (function or calcium) used to generate each CSV file.
- Place a second text file ('IsotypeData.txt') in the same directory and defines the isotypes. The files provided in the download ('data/wellData.txt' and 'data/IsotypeData.txt') can act as a template, being easily adaptable to alternative agonists, inhibitors, and concentrations.
- Analyze the data: Kinetx comprises three functions as defined in steps 5.2.5-5.2.7.
- kinetxProcess.R: This function processes the raw functional flow cytometry data. To run type kinetxProcess('data location','where to put outputs','FL1' (for FITC-anti-fibrinogen, or 'FL4' (for APC-CD62P)
- kinetxProcessCalcium.R: This function analyzes and labels the calcium flux data. To run type kinetxProcessCalcium('data location','where to put outputs','FL1')
- kinetxSummary.R: This function summarizes the data. To run type kinetxSummary('data location','where to put outputs','FL1').
- To run all of the above functions (5.2.5-5.2.7) on the test data, use the script (test.R).
NOTE: The first two functions produce figures for each donor that shows the raw data plus the fitted curves. All outputs and a spreadsheet that summarises the data are placed in the output location.
Results
The analysis of the functional real-time flow cytometry reveals differences in the shape of activation curves between agonists and between donors
Data analysis of the functional data (P-selectin exposure and fibrinogen binding) using Kinetx removes data points that are out of reasonable ranges (>200000 or <1) and <2.80 s (zero time being set to this point), normalizes data to the median of the isotypes and fits a smooth moving average curve (via function loess). Kinetx also assigns metrics and categories are based on the fitted smoothed line shape, absolute values, and rates of change as follows: (1) RoC - average rise in the smoothed line over the first 120 s; (2) label - categorizes responses as fast, medium, or slow being set according to the cut-offs of 40 and 80 for FL1 and 5 and 10 for FL4; (3) EarlyRoC - average rise in the smoothed line over the first 20 s; (4) shape - low responders, increasing, linear or decreasing (Figure 3A) - Low responders being determined as FL1 < 4000 or FL4 < 1000, the labels increasing, linear and decreasing are determined based on: shapeMetric - RoC(120 seconds)/EarlyRoC, where increasing shapeMetric >2, linear shapeMetric between 0.9-2 and decreasing shapeMetric <0.9; (5) Produces a spreadsheet summarising the data by providing the level and rate of change at 0 s, 10 s, 20 s, 30 s, 40 s, 60 s, 90 s, 120 s, 180 s, isotype median, the maximum and minimum rates of change and acceleration and all labels and categories.
Platelet fibrinogen binding and P-selectin exposure over 5 min following activation in response to a single concentration of the agonists ADP, TRAP-6, CRP-XL, epinephrine, and U46617, was analyzed in 30 donors. The metrics for fibrinogen binding and P-selectin exposure in response to different agonists show considerable variation in the shape of the response (Figure 3). Platelets stimulated with TRAP-6 and ADP showed a more rapid acceleration in fibrinogen binding, which for many donors slowed at later time points (Figure 3B). Fibrinogen binding in response to CRP-XL, thrombin, and epinephrine was more likely to show an increasing or linear rate of response. Many donors showed a relatively long lag time for CRP-XL before the rate of fibrinogen binding accelerated rapidly. Response to U46619 was often categorized as low. In contrast, P-selectin exposure was more likely to show a linear or increasing rate of response to all agonists except U46619 which again showed low response levels (Figure 3C).
Intracellular calcium flux during platelet activation can be accurately measured using real-time flow cytometry
Data analysis of the calcium flux assay removes data points that are out of reasonable ranges (< 2.80 s zero time being set to this point) and then fits a smooth moving average curve (via function loess). Kinetx assigns metrics, and categories are assigned based on the fitted smooth lines shape, absolute values, and rates of change as follows: (1) category - that describes the shape of the calcium response based on the early rise, the maximum, and the final drop from maximum, described as linear, peak or sustained (Figure 4A); (2) rate - that describes the rate of change in the fast 30 s and is defined as no change, slow, medium or fast (with cut off at 10, 40 and 80). Kinetx also produces a spreadsheet summarizing the data by providing the level and rate of change at 0 s, 10 s, 20 s, 30 s, 40 s, 60 s, 90 s, 120 s, 180 s, the maximum and minimum rates of change and acceleration and all labels and categories, as well as producing a figure of the data for each donor. Examples of calcium flux measured by this method in 30 individuals again showed different patterns of activation between individuals and agonists (Figure 4B). CRP-XL gave predominantly sustained calcium response, whereas the response to TRAP-6 most often showed a peaked response. All other agonists generated a predominantly linear response.
Real-time flow cytometry identifies differences in maximum levels of activation in response to different agonists and concentrations
Results demonstrate that the real-time flow cytometry assay has the capacity to detect differences in the maximum levels of fibrinogen binding (Figure 5A) and P-selectin exposure (Figure 5D), in response to stimulation via different receptors (10 µg/mL CRP-XL vs. 3 U/mL thrombin P < 0.001; 10 µg/mL CRP-XL vs. 1 U/mL thrombin P < 0.001). They also show that the assay is sensitive to differences in agonist concentration, where levels of maximum fibrinogen binding and P-selectin exposure are increased in response to greater agonist concentrations (fibrinogen binding - CRP-XL - 0.004 µg/mL vs. 0.4, 5, 10 µg/mL, P < 0.01; thrombin - 0.0012 U/mL vs. 1 and 3 U/mL, P < 0.01; ADP - 0.04 µg/mL vs. 1 and 4 µM, P < 0.05).
The real-time flow cytometry assay is sensitive enough to detect variability amongst donors in platelet activation rate
The maximum rate of platelet activation was determined by fitting a smoothed moving average (loess) to the fluorescence data and then using this to calculate the maximum rate of fibrinogen binding and P-selectin exposure (Figure 5B,E). The data demonstrate a considerable variation between individual donors, and the flow cytometry assay is sensitive enough to detect this variation. Results indicate that increasing agonist concentration has little effect on the maximum rate of fibrinogen binding (Figure 5B). In contrast, the maximum rate of P-selectin exposure increases with greater thrombin and CRP-XL concentration, but not with increasing concentrations of ADP (Figure 5E).
Variations in the lag time of platelet activation can be detected using real-time flow cytometry
The time to the maximum rate of platelet activation was determined by calculating the time points at which the maximum rate of fibrinogen binding and P-selectin exposure were reached (Figure 5C,F). The maximum rate of fibrinogen binding and P selectin exposure varies between donors, particularly at lower agonist concentrations. Stimulation of platelets with increasing concentrations of CRP-XL shows higher agonist concentrations take less time to reach the maximal rate of fibrinogen binding with less variability between donors; however, this trend is not seen with either thrombin or ADP stimulation (Figure 5C). The assay demonstrates that in some circumstances, increasing the agonist concentration decreases the time taken for platelet activation to commence (lag time) without altering the maximum rate of platelet activation and that both of these measures can be assessed with this assay.
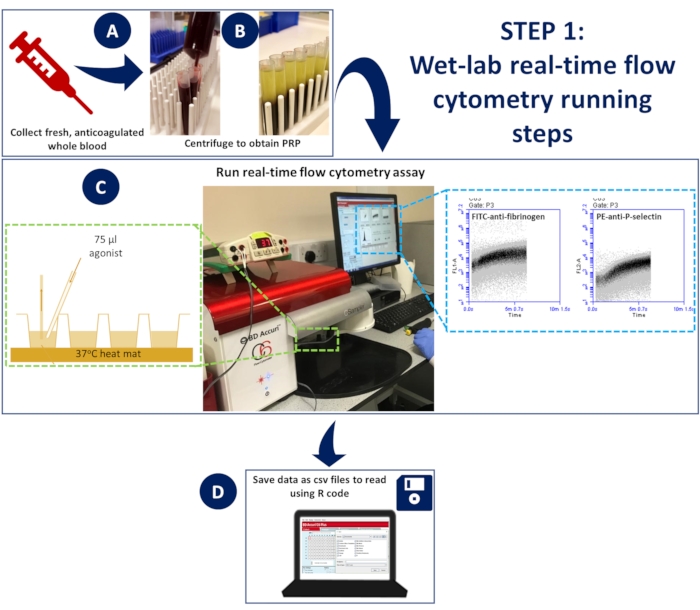
Figure 1: Wet-lab real-time flow cytometry. (A) anticoagulated whole blood was (B) centrifuged to obtain platelet-rich plasma (PRP). (C) Diluted PRP containing appropriate antibodies or calcium indicator dyes was placed in a 96-well plate, loaded onto a non-pressurized flow cytometer, and maintained at 37 °C using a dissection mat. Samples were stimulated during acquisition with an activation mix containing antibodies or calcium dye and agonist, rapidly added to the well using a gel loading tip to ensure spontaneous mixing. (D) Events were collected for 5 min, and CSV files of the data for each well were saved. Please click here to view a larger version of this figure.
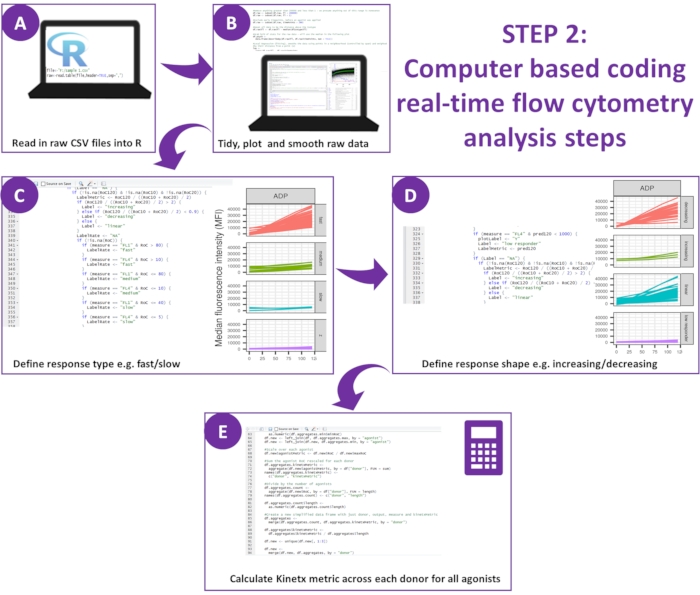
Figure 2: Schematic of the data analysis. (A) R environment was configured, and metadata was created. (B) Outlying data were removed, and a smooth moving average (loess) curve was fitted. (C) Response type and (D) response shape were defined. (E) Metrics were calculated, exported and figures generated for each donor. Please click here to view a larger version of this figure.
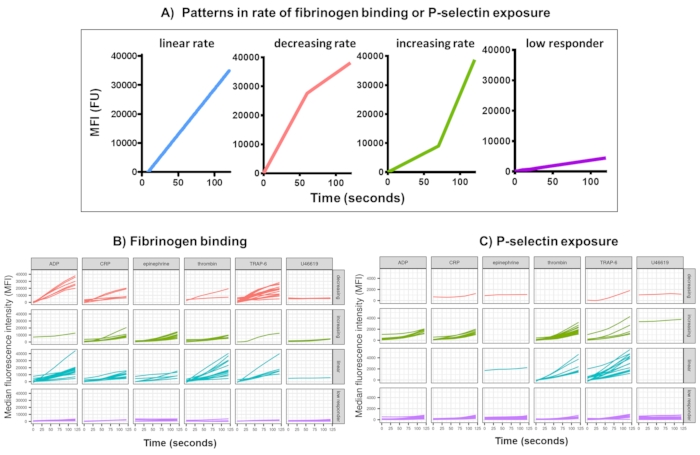
Figure 3: Representative output of Kinetx analysis of real-time platelet fibrinogen binding and P-selectin expression. (A) As well as providing metrics such as maximum rate of change (RoC) and the RoC at various time points, Kinetx also categorizes the shape of the curve to provide additional information on the activation of platelets that is hard to capture in a single metric. Representative data for 30 individuals show the typical variation seen in real-time platelet (B) fibrinogen binding and (C) P-selectin expression in response to the agonists ADP, TRAP-6, CRL-XL, epinephrine, and U46617. Please click here to view a larger version of this figure.
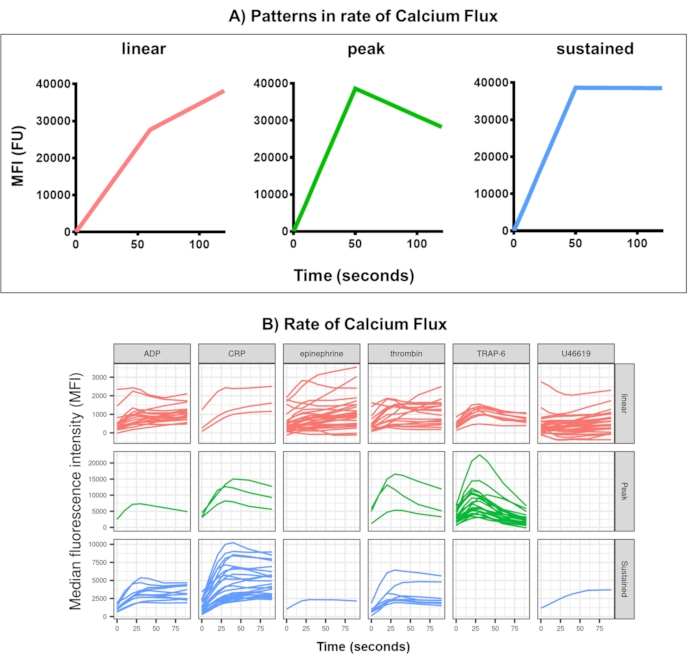
Figure 4: Representative output of Kinetx analysis of real-time platelet Calcium Flux. (A) As well as providing metrics such as maximum rate of change (RoC) and the RoC at various time points, Kinetx also categorizes the shape of the calcium flux curve to provide additional information on the activation of platelets that is hard to capture in a single metric. Representative data for 30 individuals show the typical variation seen in real-time platelet (B) Calcium Flux in response to the agonists ADP, TRAP-6, CRL-XL, epinephrine, and U46617. Please click here to view a larger version of this figure.
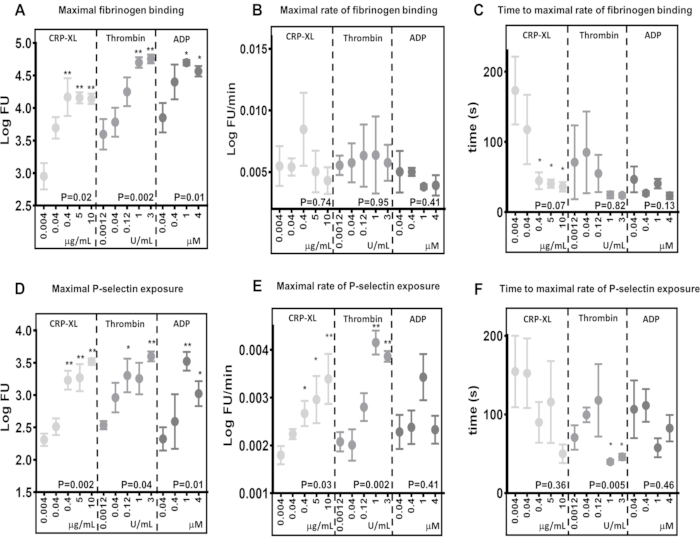
Figure 5: Agonist concentration determines maximum platelet activation but not the rate of platelet activation. Maximum platelet activation - fibrinogen binding (A) or P-selectin exposure (D) - was significantly positively altered by agonist (CRP-XL, thrombin, or ADP) concentration. The rate of platelet activation (B and E) and the time to the maximal rate of platelet activation (C and F) showed either no relationship or a weaker relationship with changing agonist concentration. P-values show the significance over the whole concentration range (Kruskal-Wallis test), and asterisks indicate a significant difference (multiple comparison test) of individual values from the lowest concentration. * P < 0.05, ** P < 0.01. Please click here to view a larger version of this figure.
Discussion
The rate at which platelets detect, process, and respond to activating stimuli may be an essential determinant for thrombus formation. Previous studies have found that inhibition of signaling elements that impact the rate, but not the final extent of platelet activation, results in the formation of unstable thrombi8. Many platelet function assays measure the extent of platelet activation and aggregation in response to different conditions and treatments; however, these do not consider the rate at which platelets become activated and the time taken for this complex process to occur3,4. The innovative flow cytometry-based assays developed here reproducibly monitor platelet activation over time and translate this into a range of metrics to calculate the maximum rate of platelet activation and the time taken for platelets to reach this maximum rate and become fully activated.
The data presented highlights the real-time assay's capacity to identify variations between different responses to agonist type and concentration and between individuals. Many previous reports have shown that platelet reactivity is highly variable between normal individuals15,16, indicating that the rate of platelet activation may also vary significantly within the population. Data from this study demonstrates that the rate of degranulation and fibrinogen binding to platelets appears to be even more variable than the maximum levels of platelet activation. This shows that real-time flow cytometry can also be utilized as a valuable and reliable tool to identify variances in platelet rate in the population and detect the effects of different inhibitory or pro-activatory agents on platelet rate as an additional means of measuring platelet function.
When platelet function is measured using endpoint assays, comparisons can be made on the extent of fibrinogen binding or granule release between different agonists. The loess curves comparing fibrinogen binding over the first 5 min of platelet activation demonstrate the ability of the real-time assay to tease out more detail in the differences in platelet activation kinetics that single endpoint assays cannot measure.
The data collected from the real-time assay demonstrates that the speed at which fibrinogen binds to platelets follows a slightly different pattern, depending on the activating pathway (Figure 3). In order to accurately assess platelet activation kinetics, it is essential to use a non-pressurized flow cytometer that enables simultaneous data acquisition and sample stimulation. It is also essential that the agonists are added rapidly to ensure near-instantaneous and complete mixing of agonist and platelets. Stimulation with thrombin ADP and epinephrine produces a similar curve representing a rapid initiation of signaling in response to receptor sensitization resulting in fibrinogen binding to platelets at a quick and steady rate. In contrast, platelets stimulated by CRP-XL are initially very slow to bind fibrinogen following initial receptor sensitization; however, the rate of fibrinogen binding is then rapidly increased after this initial delay. Platelet stimulation with U46619, a mimetic of TXA2, results in a quick initial rate of fibrinogen binding, which decreases rapidly to a very slow rate leading to only a slight and steady increase in fibrinogen binding over time.
Kinetx was designed to be open-source, reproducible, and easy to implement in order to get around problems with proprietary software, such as cost and inflexibility. As such, it needed to be developed with software that was non-propriety. R was chosen as it is widely used by biologists, easy to install, cost-free, and open-source. This open-source environment allows users proficient in R to alter parameters such as degree of smoothing, identification of outlying data points, or time scales. However, to aid researchers who are unfamiliar with R Kinetix was also developed so that analysis can be performed via a single command (either kinetxProcess or kinetxProcessCalcium, depending on the data being analyzed). The Kinetix software demonstrated here can calculate a range of metrics, including values for the maximum levels, rate, and acceleration of fibrinogen binding or P-selectin exposure and the time points at which these maximums occur. The kinetics of platelet activation in response to different stimulatory pathways can be more accurately compared using these numbers.
Comparisons between different agonist stimulations in the maximum levels of fibrinogen binding and the rates of fibrinogen binding to platelets are good examples of where the rate of platelet activation can vary independently of maximum binding. Comparing maximum fibrinogen binding after 5 min of stimulation with 0.04 µM ADP (3.85 LogFU) and 0.04 µg/mL CRP-XL (3.70 LogFU), both agonists have resulted in a similar amount of bound fibrinogen (Figure 5A). The maximum rates of fibrinogen binding show an even more minor difference (0.04 µM ADP - 0.0050 LogFU/minute; 0.04 µg/mL CRP-XL - 0.0054 LogFU/min), indicating that the overall rate of fibrinogen binding is similar between these two stimulations (Figure 5B). However, when the lag time of platelet activation is compared, there is a clear difference showing CRP-XL (117 s to maximum rate) accelerating at a much slower rate than ADP (47 s to maximum rate) (Figure 5C). Thus, it becomes clear that ADP stimulation results in a much faster initial response (P < 0.001) when compared to CRP-XL. When observed together, these measurements of platelet kinetics in response to two different agonists describe a rapid initial response to ADP stimulation which accelerates slowly and remains at a steady rate. In contrast, CRP-XL stimulation results in a slow initial rate of activation, which accelerates rapidly at a much later time, eventually leading to a similar overall rate and levels of fibrinogen binding as ADP. These differences between the maximum levels, rate, and acceleration of fibrinogen binding demonstrate that a number of parameters are involved in measuring how quickly platelets become activated. The real-time assay and Kinetx analysis can measure and compare these parameters, describe the time taken from receptor sensitization to the platelet response, and compare this between different signaling pathways.
Increasing agonist concentration does not have a significant effect on the rate of fibrinogen binding to platelets. However, the time taken to reach the maximum rate of fibrinogen binding decreases as agonist concentration increases, suggesting that platelets bind fibrinogen at a steady rate and receptor saturation plays a more prominent role in how quickly platelets bind fibrinogen.
The calcium flux assay and analysis described is a quick and easy to perform calcium assay that can be incorporated as extra samples in the real-time assay allowing for the analysis of calcium and platelet fibrinogen binding and P-selectin in the same run of samples. The bespoke analysis package provides an in-depth assessment of calcium flux kinetics, including the shape of the response, maximum response, and time to maximum response. These parameters can then be compared for variation between donors and in response to various pharmaceutical agents. Calcium flux in platelet has been previously studied in platelets using a variety of flow cytometry-based assays17,18,19. Aliotta et al.14, describe an elegant assay capable of analyzing the kinetics of multiple intracellular ions. The calcium assay presented here builds upon these previously published assays by including the analysis package allowing greater flexibility, a more in-depth exploration of the data with the benefit of high-throughput analysis for multiple donors in a short timeframe.
Previous studies have demonstrated that the inhibition or absence of certain signaling molecules results in an altered platelet activation rate, which directly translates to thrombus formation8,9. In the past, platelet activation kinetics could be measured by flow cytometry over a number of fixed time points which can then be used to calculate and compare, for example, the rate of GPIIbIIIa externalization in response to different agonists20. The real-time assay and Kinetx analysis described in this paper provide a simple, freely available, and accurate method for measuring both rate and endpoint of platelet activation from resting platelets. This is likely important in identifying physiologically relevant variations in platelet function that may be missed when only endpoint readings are measured.
Disclosures
The authors have nothing to disclose.
Acknowledgements
This project was supported by the British Heart Foundation (PG/16/36/31967, RG/20/7/34866, and RG/15/2/31224).
Materials
| Name | Company | Catalog Number | Comments |
|---|---|---|---|
| 9,11-Dideoxy-11α,9α-epoxymethanoprostaglandin F2α - U46619 | Sigma-Aldrich, Poole, UK | D8174-1MG | |
| Accuri C6 flow cytometer with BD Csampler | Beckton Dickinson, UK | 660517 + 660519 | |
| Adenosine diphosphate | Sigma-Aldrich, Poole, UK | A2754-1G | |
| APC-labelled anti-P-selectin (CD62p) | BD Biosciences, UK | 550888 | |
| Corning polypropylene 96-well round-bottomed, non-treated microtitre plate | Sigma-Aldrich, Poole, UK | CLS3879-50EA | |
| Cross-linked collagen related peptide (CRP-XL) | CambCol, UK | ||
| Epinephrine | Sigma-Aldrich, Poole, UK | E4375-1G | |
| FITC-labelled anti-fibrinogen antibody | Dako, Agilent Technologies, UK | F011102-2 | |
| Fluo-4 Direct dye | Thermo-Fisher Scientific | F10472 | |
| Gel loading tips | Starlab, UK | I1022-0600 | |
| Gly-Pro-Arg-Pro peptide | Sigma-Aldrich, Poole, UK | G1895-5MG | |
| Thrombin | Sigma-Aldrich, Poole, UK | SRE0003-10KU | |
| Thrombin receptor activator peptide 6 (TRAP-6) | Bachem, St Helens, UK | H-2936.0005 | |
| Vacuette 9NC coagulation 3.2 % trisodium citrate (0.109 mol/L) | Greiner Bio-one LTD, Stonehouse, UK | 454327 |
References
- Bye, A. P., Unsworth, A. J., Gibbins, J. M. Platelet signaling: a complex interplay between inhibitory and activatory networks. Journal of Thrombosis and Haemostasis: JTH. 14 (5), 918-930 (2016).
- Jones, C. I., Barrett, N. E., Moraes, L. A., Gibbins, J. M., Jackson, D. E. Endogenous inhibitory mechanisms and the regulation of platelet function. Methods in Molecular Biology. 788, 341-366 (2012).
- Paniccia, R., Priora, R., Liotta, A. A., Abbate, R. Platelet function tests: a comparative review. Vascular Health and Risk Management. 11, 133-148 (2015).
- Saboor, M., Moinuddin, M., Ilyas, S. New horizons in platelets flow cytometry. The Malaysian Journal of Medical Sciences : MJMS. 20 (2), 62-66 (2013).
- Kroll, M. H., Hellums, J. D., McIntire, L. V., Schafer, A. I., Moake, J. L. Platelets and shear stress. Blood. 88, 1525-1541 (1996).
- Pasquet, J. M., Noury, M., Nurden, A. T. Evidence that the platelet integrin alphaIIb beta3 is regulated by the integrin-linked kinase, ILK, in a PI3-kinase dependent pathway. Thrombosis and Haemostasis. 88 (1), 115-122 (2002).
- Stevens, J. M., Jordan, P. A., Sage, T., Gibbins, J. M. The regulation of integrin-linked kinase in human platelets: evidence for involvement in the regulation of integrin alpha 2 beta 1. Journal of Thrombosis and Haemostasis: JTH. 2 (8), 1443-1452 (2004).
- Jones, C. I., et al. Integrin-linked kinase regulates the rate of platelet activation and is essential for the formation of stable thrombi. Journal of Thrombosis and Haemostasis: JTH. 12 (8), 1342-1352 (2014).
- Cifuni, S. M., Wagner, D. D., Bergmeier, W. CalDAG-GEFI and protein kinase C represent alternative pathways leading to activation of integrin alphaIIbbeta3 in platelets. Blood. 112 (5), 1696-1703 (2008).
- Stolla, M., et al. The kinetics of alphaIIbbeta3 activation determines the size and stability of thrombi in mice: implications for antiplatelet therapy. Blood. 117 (3), 1005-1013 (2011).
- Kawasaki, H., et al. A Rap guanine nucleotide exchange factor enriched highly in the basal ganglia. Proceedings of the National Academy of Sciences of the United States of America. 95 (22), 13278-13283 (1998).
- Kinetx. , Available from: http://github.com/cardiomaths/Kinetx (2021).
- R. , Available from: https://www.r-project.org/ (2021).
- R Studio. , Available from: https://rstudio.com/products/rstudio/download/ (2021).
- Yee, D. L., Sun, C. W., Bergeron, A. L., Dong, J. F., Bray, P. F. Aggregometry detects platelet hyperreactivity in healthy individuals. Blood. 106 (8), 2723-2729 (2005).
- Panzer, S., Hocker, L., Koren, D. Agonists-induced platelet activation varies considerably in healthy male individuals: studies by flow cytometry. Annals of Hematology. 85 (2), 121-125 (2006).
- Aliotta, A., Bertaggia Calderara, D., Alberio, L. Flow cytometric monitoring of dynamic cytosolic calcium, sodium, and potassium fluxes following platelet activation. Cytometry. Part A : The Journal of the International Society for Analytical Cytology. 97 (9), 933-944 (2020).
- do Ceu Monteiro, M., Sansonetty, F., Goncalves, M. J., O'Connor, J. E. Flow cytometric kinetic assay of calcium mobilization in whole blood platelets using Fluo-3 and CD41. Cytometry. 35 (4), 302-310 (1999).
- Vines, A., McBean, G. J., Blanco-Fernandez, A. A flow-cytometric method for continuous measurement of intracellular Ca(2+) concentration. Cytometry. Part A : The Journal of the International Society for Analytical Cytology. 77 (11), 1091-1097 (2010).
- Weber, A. A., Schror, K. Differential inhibition of adenosine diphosphate- versus thrombin receptor-activating peptide-stimulated platelet fibrinogen binding by abciximab due to different glycoprotein IIb/IIIa activation kinetics. Blood. 98 (5), 1619-1621 (2001).
Reprints and Permissions
This article has been published
Video Coming Soon