This protocol uses piroxicam to accelerate colitis development in the interleukin (IL-10)-knockout mouse model. The protocol ensures colitis synchronization, resulting in rigorous, reproducible results independent of sex, background strain, or vivarium conditions. It serves as a useful model for studying metabolic alterations during intestinal inflammation.
Method Article
A Model of Piroxicam-Accelerated Enterocolitis in Interleukin-10 Knockout Mice for Studying Inflammation-Induced Metabolic Alterations
In This Article
Summary
Abstract
Inflammatory bowel disease (IBD) is a chronic inflammatory disorder of the digestive tract affecting over 10 million individuals globally. While substantial research has focused on the immunologic mechanisms and consequences underlying IBD, less is understood about how mucosal inflammation contributes to metabolic dysregulation, including weight loss and reduced appetite. Here, the authors describe a mouse model of piroxicam-accelerated enterocolitis in interleukin-10-knockout (IL-10-KO) mice to study inflammation-induced metabolic dysregulation. IL-10-KO mice are known to develop spontaneous enterocolitis and have heightened susceptibility to enterocolitis triggered by infections or drugs. However, vivarium conditions and strain background have been reported as confounders in colitis development in this model. Piroxicam, a non-steroidal anti-inflammatory drug (NSAID), has been demonstrated to trigger or accelerate enterocolitis in animal models by increasing mucosal exposure to luminal bacteria. In this protocol, male and female IL-10-KO mice were fed a piroxicam-fortified diet in place of a regular chow diet. Food intake and body weight were measured daily to reflect whole-body metabolic alterations, along with clinical manifestations of enterocolitis such as diarrhea and rectal bleeding. The protocol is efficient and reproducible, inducing enterocolitis simultaneously in multiple mice, and allows assessment of metabolic dysregulation in an inflammatory bowel disease model. Further studies using this protocol may investigate the effects of enterocolitis on other components of metabolic dysregulation, such as energy expenditure and body composition, revealing broader connections between inflammatory bowel disease and host metabolism.
Introduction
Crohn’s disease and ulcerative colitis, collectively known as inflammatory bowel disease (IBD), are chronic autoimmune disorders of the gastrointestinal tract characterized by mucosal inflammation with clinical manifestations including abdominal pain, weight loss, hematochezia, and diarrhea. IBD affects millions of individuals worldwide, with the highest prevalence in Westernized societies1. In the US, it is estimated that over 3 million people are affected2,3, with rising incidence and prevalence, particularly among children and young individuals4,5.
The exact mechanisms underlying IBD pathogenesis remain incompletely understood, but the disease is widely thought to result from an exaggerated immune response to the intestinal microbiota in genetically susceptible individuals. Cytokines that modulate inflammatory responses play critical roles in maintaining gut homeostasis and in the development of IBD. Among these, interleukin-10 (IL-10) is a well-studied anti-inflammatory cytokine that helps maintain immunologic homeostasis in humans by regulating both innate and adaptive arms of immune response6,7. Notably, polymorphisms in IL-10 and its receptor (IL-10RA/B) have been identified in infants with very-early onset IBD (VEO-IBD), classically presenting with perianal disease within the first several months of life8. This association is further supported by large-scale exome sequencing of adult patients with Crohn’s disease, which identified IL-10RA as a disease susceptibility locus in non-monogenic IBD9. Furthermore, a non-genetic pathway involving IL-10 neutralizing antibodies has been described in VEO-IBD patients, further highlighting the importance of this pathway in maintaining mucosal immune homeostasis10.
Building on human studies implicating IL-10 in IBD, interleukin-10-knockout (IL-10-KO) mice have been developed as a model to study IL-10's role in IBD. IL-10-KO mice are known to develop spontaneous enterocolitis with an exaggerated CD4+ Th1 response to stimuli, typically beginning at 8–12 weeks of age11. However, the development of spontaneous enterocolitis in IL-10-KO mice can be unpredictable in the absence of an accelerating agent12,13,14, depending on genetic strain, microbiota composition, and housing conditions15,16. The use of a reliable protocol to induce colitis is critical for the IL-10-KO model to be practically useful. Prior studies have utilized non-steroidal anti-inflammatory drugs (NSAIDs) such as piroxicam to induce enterocolitis in IL-10-KO mice17,18. However, these studies have primarily focused on immunologic alterations, with relatively little emphasis on the effects of enterocolitis on metabolism or on the role of sex in colitis severity19. The authors herein describe the use of a piroxicam-fortified diet to induce enterocolitis in IL-10-KO mice and characterize metabolic dysregulation and mucosal inflammatory responses in this model using both male and female mice. This protocol measures body weight and food intake to reflect whole-body metabolic alterations, as well as clinical manifestations of colitis and histologic and transcriptomic changes reflecting mucosal inflammation. This efficient and reproducible model provides a valuable tool for investigating the connection between IBD and host metabolism.
Protocol
All animal experiments were performed in compliance with the protocol approved by the Institutional Animal Care and Use Committee (IACUC) at the University of Texas Southwestern Medical Center, in accordance with the “Guide for the Care and Use of Laboratory Animals" [Approval Number: 2017-102011]. Euthanasia was performed in accordance with institutional guidelines. No anesthesia was required for the procedures performed. Specific details for materials are described in the Table of Materials.
1. Establishing the piroxicam-accelerated enterocolitis model in IL-10-KO mice
- Maintain IL-10-KO mice in a specific pathogen-free (SPF) facility on a 12-h light cycle with ad libitum access to chow and water.
- Individually house 7–8-week-old, age and sex-matched mice in microisolator cages. Allow mice to acclimate to single housing and daily handling for at least one week prior to the start of the experiment.
NOTE: Ensure that body weights are >20 g for males or >17 g for females, and that mice are free from fight wounds. - Assign mice to an experimental group and a control group. For the experimental group, replace the standard chow with piroxicam-fortified chow. For the control group, provide fresh standard chow. Add 50 g chow to each cage hopper.
NOTE: Allocate at least five mice per sex to each group. The piroxicam-fortified chow (200 ppm) was prepared by Teklad using piroxicam supplied by the investigators for the production of a custom laboratory animal diet. To minimize batch-to-batch variability, it is recommended that all animals within a given experiment receive chow from the same production batch. When possible, the same batch should also be used across experiments to improve reproducibility.
2. Monitoring of body weight and feeding behavior
- Using an analytical scale, record the body weight of each mouse. Weigh each mouse individually at the same time each day, daily for 7 consecutive days. Report daily body weight as a percentage of the baseline weight on day 0 (set as 100%).
NOTE: A weight loss greater than 20% indicates excessive stress and risk of imminent death. Mice should be euthanized if this threshold is reached. - Using an analytical scale, record the initial weight of the piroxicam-fortified chow and the standard chow in each cage.
- Then, measure the remaining chow in each cage hopper at the same time each day, daily for 7 consecutive days.
- Calculate daily chow consumption by subtracting the daily chow weight from the remaining chow from the prior day.
NOTE: Routinely check the amount of chow and refill if it is below 10 g. The palatability of piroxicam chow does not influence intake and should closely resemble that of standard chow.
3. Monitoring of disease activity
- On days 0 and 7, visually inspect fecal pellets from individual mice and determine the presence of blood in stool.
- If no blood is visible, perform a fecal occult blood test by smearing a pellet onto the test card, then adding the supplied developer reagent. Score results according to Table 1.
- On days 0 and 7, visually inspect freshly voided fecal pellets to assess stool consistency. Use flat forceps to aid in determining consistency. Score results according to Table 1.
- On days 0 and 7, determine the degree of rectal prolapse by inspecting the perianal region. Score results according to Table 1.
- Measure body weight as described above. Score results according to Table 1.
NOTE: Disease activity index (DAI) scoring should be performed in a blinded manner by the same researcher throughout the experiment to ensure consistency, minimize observer bias, and improve the reliability of the assessment.
4. Harvesting of colonic tissue
- Euthanize mice by CO2 asphyxiation and cervical dislocation as reported elsewhere20.
- Place the mouse in a supine position and spray 70% ethanol on the ventral abdomen.
- Lift the skin with forceps and use surgical scissors to cut along the midline. Expose the peritoneal cavity and locate the colon.
- Expose the colon and cecum using blunt dissection. Remove the colon en bloc, including the cecum and the anal cuff.
- Place the colon on a flat surface and remove any connective tissue.
- Measure and record colon length.
- After measurement of colon length, remove the cecum by cutting at the ceco-colonic junction.
- Prepare a 10 mL syringe filled with phosphate-buffered saline (PBS) with an attached 22-gauge ball tip reusable steel gavage needle. Thread the needle into the colon and flush out intestinal contents.
- Place the flushed colon in a Petri dish containing PBS and rinse to remove residual contents. Once cleared, use it for downstream assays.
5. Histology analysis
- Lay the colon flat on a glass slide. Use forceps to wrap the tissue around itself, starting from the distal end, to form a “Swiss roll”. In this fashion, the distal/anal end will remain in the inner roll with the more proximal regions extending to the outer roll.
- Using a 27-gauge needle, pin the rolled colon to maintain the roll and place it inside an embedding tissue cassette.
- To fix tissues, submerge tissue cassettes in 10% buffered formalin solution for 16 h at 4 °C.
CAUTION: 10% formalin is harmful if in contact with skin and can cause severe skin burns and eye damage. Handle cautiously with protective gloves and scientific goggles. Residual formalin should be properly disposed of following institutional guidelines. - After formalin fixation, process tissues for paraffin embedding and section them for mounting on glass slides.
NOTE: Samples should be submitted to a histology laboratory with the necessary equipment for processing tissue cassettes in paraffin, scroll sectioning, slide mounting, and hematoxylin and eosin staining. - Stain tissue slides with hematoxylin and eosin (HE), as per established protocols21.
- Using the histological scoring system described in Table 2, evaluate the following histologic features in each section: tissue damage from enterocolitis, lamina propria inflammatory cell infiltration, and percentage of area involved. Combine the scores in each section to generate a total score (Table 2).
Total score = Features × Involvement (Tissue Damage) + Features × Involvement (Lamina Propria Inflammatory Cell Infilteration) (1) - Representative histopathological images of tissue damage and cell infiltration can be found in the publication by Erben et al22.
NOTE: Histologic scoring should be performed in a blinded manner, preferably by a trained pathologist, to ensure consistency and reliability of the assessment.
6. Immunofluorescent staining of formalin-fixed paraffin-embedded tissue
- Place tissue slides in a slide rack and into a 55 °C slide dryer for 1 h to melt paraffin.
- Place slides in a staining rack and sequentially submerge the rack for 3 min into staining jars with xylene. Repeat this step on 3 occasions.
- Submerge the staining rack for 3 min in staining jars with 100% ethanol. Repeat this step on 3 occasions.
- Submerge the staining rack for 3 min in the staining jar with 95% ethanol.
- Submerge the staining rack for 3 min in the staining jar with 80% ethanol.
- Submerge the staining rack for 5 min in staining jars with deionized (DI) water.
NOTE: All prior steps must be performed in a ventilated hood due to the xylene fumes. Handle cautiously with protective gloves and scientific goggles. Residual xylene should be properly disposed of in accordance with institutional guidelines. - Transfer slides to a slide rack and submerge in staining jar with 1× citrate retrieval solution.
- Place the staining jar in the staining dish support.
- Place the staining dish support in the pressure cooker.
- Cook for 15 min in a pressure cooker.
- Recover the slides from the pressure cooker and allow them to cool down to room temperature.
- Incubate slides with 300 µL blocking buffer (3.5% goat serum diluted in PBS) for 1 h in a humidified chamber. Ensure the tissue is completely covered by the blocking buffer.
- Expose slides to 300 µL of primary antibody diluted in blocking buffer for 16 h at 4 °C, inside a humidified chamber. Ensure the tissue is completely covered by the primary antibody. The following primary antibody was used: Anti-S100A8/S100A9 (1:500).
NOTE: Antibody dilutions will be reagent-specific and should follow the supplier's recommendations. - Rinse slides by serially submerging them in PBS for 5 min on 3 occasions in a staining jar.
- Expose slides to 300 µL of a diluted fluorescent secondary antibody in blocking buffer for 1 h at room temperature, in a humidified chamber. Ensure the tissue is completely covered by the secondary antibody. The following fluorescent secondary antibody was used: goat anti-Rabbit Alexa Fluor 555 (1:150 dilution).
NOTE: From this point on, slides should be protected from light to prevent photobleaching of fluorophores. Dilutions of secondary antibodies will be reagent-specific and should follow the supplier's recommendations. - Rinse slides by serially submerging them in PBS for 5 min on 3 occasions in a staining jar.
- Expose slides to nuclear staining by submerging in Hoechst solution diluted 1:5000 in PBS for 20 min in a staining jar.
- Rinse slides by serially submerging them in PBS for 5 min on 3 occasions in a staining jar.
- Carefully wipe off any PBS from the slides using a non-abrasive tissue. Add 50 µL of antifade mounting medium and a coverslip.
7. RNA extraction
- Snap freeze the entire colon or a fragment in liquid nitrogen and then store at -80 °C. Alternatively, submerge in 1.5 mL of RNALater preserving solution and store according to the manufacturer’s instructions.
- Thaw previously frozen colon and place on a flat surface. Disrupt and homogenize the tissue with a handheld homogenizer.
- Isolate RNA using the kit, following the manufacturer’s instructions.
- Measure RNA concentration using a spectrophotometer. A260/A280 ratios > 1.8 and A260/A230 ratios of 2.0–2.2 indicate acceptable RNA purity.
- Proceed with reverse transcription, followed by qPCR with SYBR green intercalating dye.
- Analyze results using the quantification platform or a similar instrument.
Results
Male and female IL-10-KO mice develop enterocolitis after a short exposure to a piroxicam-fortified diet (Figure 1A–E). By day 2, piroxicam-exposed mice exhibited statistically significantly greater weight loss than their same-sex regular chow-fed controls, and comparable weight loss was observed across sexes (Figure 1B). Apparent daily food intake remained unchanged throughout piroxicam exposure and enterocolitis development and resembled intake of standard chow, indicating that weight loss in this model is not primarily driven by reduced intake but rather by other factors that promote metabolic expenditure (Figure 1C).
To further investigate the progression of intestinal inflammation, disease activity was assessed by a combined score of weight loss, blood in stool, stool consistency, and degree of rectal prolapse. The modified disease activity index (DAI) was assessed at baseline and day 7; day 7 scores are shown in Figure 1D. In addition, the development of enterocolitis observed in piroxicam-exposed mice was associated with a strong trend toward increased mortality, although this difference was not statistically significant (p = 0.12; Figure 1E). In this model, early mortality is secondary to mice reaching humane endpoints (weight loss > 20%) and preferentially affects males (Figure 1E). If mortality is a sought-after experimental endpoint, a larger number of experimental animals than used here may be considered. In this study, the authors used the minimum number of animals necessary to achieve statistical power through study completion, accounting for expected mortality.
Colon shortening is a feature associated with the severity of colitis in murine models. At harvest, both male and female IL-10-KO mice fed a piroxicam diet had shorter colons than those fed regular chow (Figures 2A–B). Upon histological assessment, colons from the piroxicam-fed group showed epithelial damage and increased immune cell infiltration, changes associated with colitis (Figure 2C). These findings translated into a higher histological score (Figure 2D). Additionally, transcriptional levels of pro-inflammatory cytokines involved in human IBD and murine models of colitis were evaluated23. In agreement with prior reports, colons from piroxicam-fed IL-10-KO mice displayed a significant upregulation of pro-inflammatory cytokines at the transcript level (Figure 3A–D). Of note, this transcriptional change was not observed in IL-10-KO mice receiving regular chow or WT mice receiving piroxicam-fortified diet, indicating that the transcriptional signature was driven by a combination of IL-10 deficiency and piroxicam, rather than either factor alone. Finally, the authors confirmed that the transcriptional signature observed in the colon from piroxicam-treated mice was associated with increased calprotectin staining in the colonic mucosa (Figure 3E)24,25.
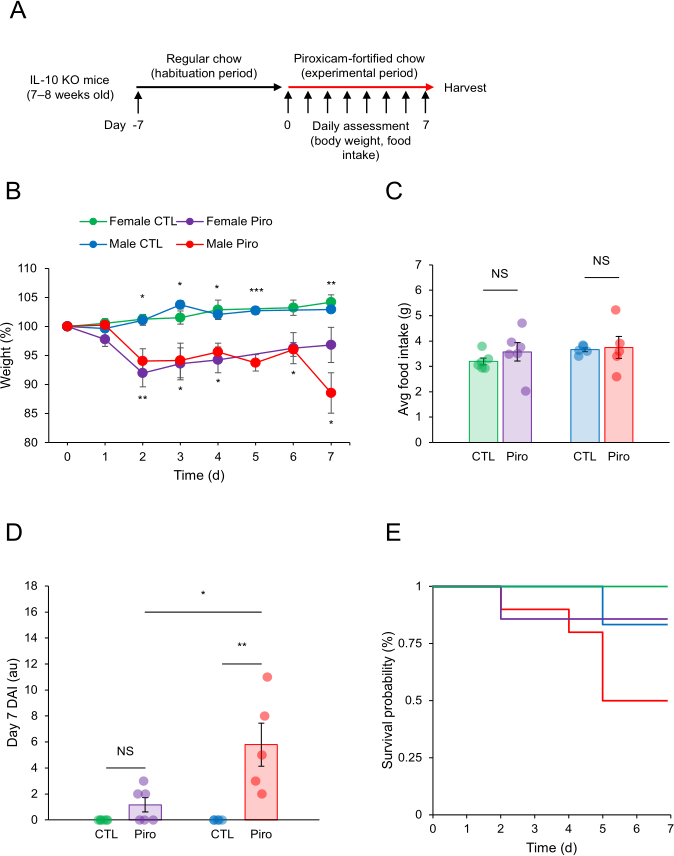
Figure 1: Piroxicam-accelerated enterocolitis in IL-10-KO mice. (A) Schematic overview of experimental protocol. (B) Body weight, (C) food intake, (D) day 7 disease activity index (DAI), (E) survival curve in 8-week-old male and 8-week-old female IL-10-KO mice receiving a piroxicam-fortified diet or a regular diet. Male control: n = 5, male piroxicam: n = 5, female control: n = 6, female piroxicam: n = 6 in (B), (C), and (D). Male control: n = 6, male piroxicam: n = 10, female control: n = 6, female piroxicam: n = 7 in (E). * p ≤ 0.05, ** p ≤ 0.01, *** p ≤ 0.001 by pairwise comparison of male (top asterisks) and female (bottom asterisks) mice in (B). Statistical analyses were performed using a two-tailed unpaired t-test in (B), (C), and (D), and a log-rank test in (E). Mean values and error bars representing the standard error of the mean (SEM) are depicted. In bar charts, individual measurements are depicted by jitter plots. Please click here to view a larger version of this figure.
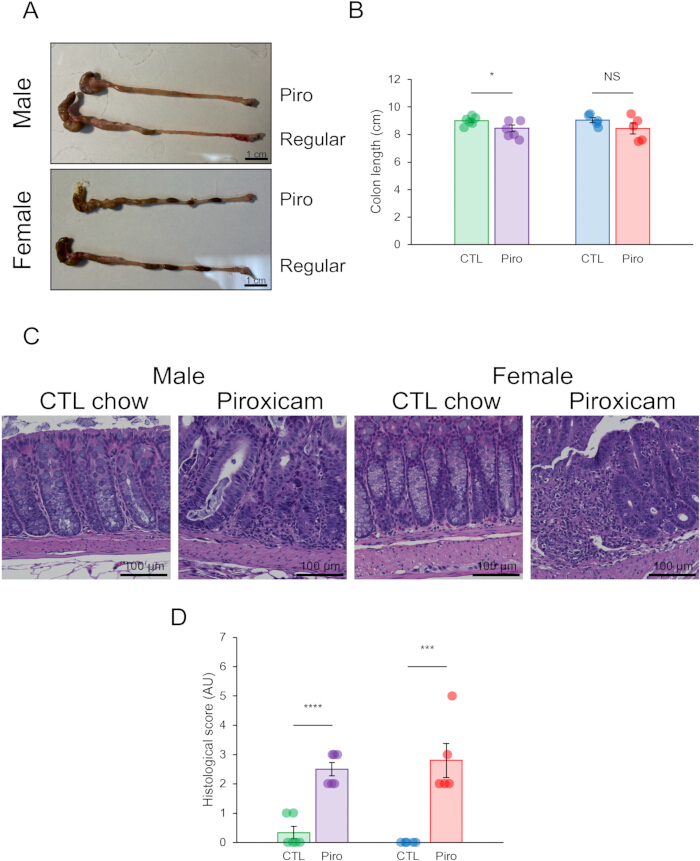
Figure 2: Colon shortening and histological assessment. (A) Representative colon specimens from 8-week-old male and female interleukin-10-knockout (IL-10-KO) mice receiving a piroxicam diet (top) or a regular diet (bottom) for 7 days. Scale bar = 1 cm. (B) Colon length on day 7 (male control: n = 5, male piroxicam: n = 5, female control: n = 6, female piroxicam: n = 6). (C) Representative images of HE-stained colon. Scale bar = 100 µm. (D) Histology score on day 7. Two-tailed unpaired t-test in (B) and (D). Mean values and error bars representing SEM are depicted. In bar charts, individual measurements are depicted by jitter plots. Not significant (NS), * p ≤ 0.05, *** p ≤ 0.001, **** p ≤ 0.0001 by pairwise comparison. Please click here to view a larger version of this figure.
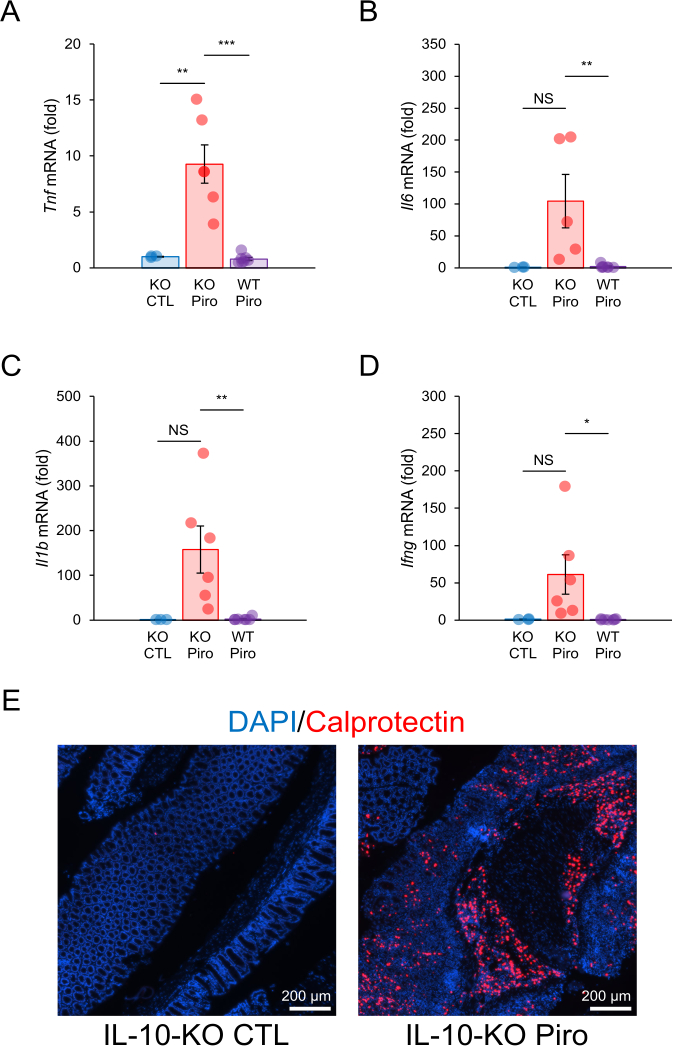
Figure 3: Inflammatory changes in piroxicam-accelerated enterocolitis. Quantitative RT-PCR results of (A) Tnf, (B) Il6, (C) Il1b, and (D) Ifng in colonic tissue from 8-week-old wild-type (WT) and interleukin-10-knockout (IL-10-KO) male mice at the time of harvest. For panels A–D, WT piroxicam n = 7, KO piroxicam n = 6, KO control n = 3. (E) Representative calprotectin immunofluorescence staining of colonic tissue of 8-week-old IL-10-KO mice at the time of harvest. Statistical analyses were performed using a two-tailed unpaired t-test. Mean values and error bars representing the standard error of the mean (SEM) are depicted. In bar charts, individual measurements are depicted by jitter plots. Scale bar in (E) = 200 µm. Not significant (NS), * p ≤ 0.05, ** p ≤ 0.01, *** p ≤ 0.001 by pairwise comparison. Please click here to view a larger version of this figure.
| Domain | Score |
| Weight | 0 – Unchanged |
| 1 – Loss of 1–5% | |
| 2 – Loss of 6–10% | |
| 3 – Loss of 11–20% | |
| 4 – ; Greater than 20% loss | |
| Stool Consistency | 0 – Normal ; |
| 1 - Soft but formed | |
| 2 – Loose stools (not watery) | |
| 4 – Diarrhea (liquid stool) | |
| Bleeding | 0 – None |
| 2 – Hematooccult positive stools | |
| 3 – Visible blood on stool | |
| 4 – Gross bleeding per rectum | |
| Rectal Prolapse | 0 – Absent |
| 1 – Present | |
| Total Score | Total Score: Sum of (Domain scores) for each domain |
Table 1: Disease activity score (DAI). A scoring system to determine disease activity by weight loss, stool consistency, blood in stool, and rectal prolapse. Adapted from Sifuentes-Dominguez, et al26.
| Tissue Damage | Lamina Propria Inflammatory Cell Infiltration | |||||||
| Features | Involvement | Features | Involvement | |||||
| 0 | None | 1 | 1–25% of surface | 0 | Infrequent | 1 | 1–25% of surface | |
| 1 | Infrequent ; | 2 | 26–50% of surface | 1 | Increased, some neutrophils | 2 | 26–50% of surface | |
| 2 | Mucosal erosions and ulcerations | 3 | 51–75% of surface | 2 | Submucosal presence of inflammatory cell clusters | 3 | 51–75% of surface | |
| 3 | Extensive damage deep into the bowel wall | 4 | 76–100% of surface | 3 | Transmural cell infiltrations | 4 | 76–100% of surface | |
Table 2: Histologic scoring system. Scoring system to determine histologic changes and damage. Adapted from Sifuentes-Dominguez, et al26.
Discussion
Inflammatory bowel disease is a complex polygenic disorder where preclinical models serve as invaluable tools to dissect pathways that contribute to IBD pathogenesis and develop novel diagnostic and therapeutic strategies. Currently, many IBD preclinical models rely on chemical exposure, such as dextran sulfate sodium (DSS), oxazolone, and trinitrobenzene sulfonic acid (TNBS), due to their ease of use. Genetic models that develop spontaneous colitis are also available. Among these, the IL-10-KO model is particularly valuable because genetic variations in the IL-10 pathway are known to cause intestinal inflammation in humans, and IL-10-KO mice develop spontaneous chronic enterocolitis that resembles human disease. However, a major limitation of this model is its inability to account for phenotypic variability. Although enterocolitis develops spontaneously, its onset can be variable depending on the strain background and vivarium conditions27.
By combining chemical exposure with a genetic model, the protocol described here provides a reliable and reproducible murine model of experimental colitis. Enterocolitis is accelerated in IL-10-KO mice by piroxicam, with disease onset within 7 days following exposure to piroxicam-fortified diet. This protocol allows synchronization of colitis development. The model recapitulates features observed in other commonly used murine models of colitis, including weight loss, blood in stool, diarrhea, colon shortening, histologic damage, and transcriptional changes. Furthermore, this model is reproducible in the widely used C57Bl/6J strain, which facilitates interrogation of additional gene defects associated with IBD through the relative ease of generating mice carrying additional mutations in this strain.
The model described here provides a useful tool to study metabolic changes during intestinal inflammation. In this model, mice exposed to piroxicam that develop accelerated enterocolitis continue to feed normally without a significant decrease in daily intake. This indicates that weight loss in this model is not due to impaired feeding but rather to additional factors. Further studies are needed to determine whether these results are due to increased caloric expenditure due to inflammation, excessive caloric loss through diarrhea, or impaired thermogenesis. Furthermore, male and female mice exhibit similar patterns of disease severity, a finding that contrasts prior observations made on IL-10-KO and DSS models28,29,30.
There are several important troubleshooting steps to ensure reproducibility of this model. First, mice should be acclimated to daily handling and observations for one week prior to exposure to piroxicam. This prevents stress-associated weight loss. Second, cages should contain no more than three mice, and only mice that are harmoniously housed should be included in the experiment. Mice exhibiting fighting behavior or fight wounds are more susceptible to colitis development and may succumb prior to harvest31,32. Third, if food intake is to be monitored throughout the experiment, mice should be individually housed to allow accurate measurement of chow consumption. In addition, only large, intact food pellets should be placed in the feeding hoppers to prevent them from crumbling into the bedding, which may affect measurements. The methods for quantifying food intake described here are in line with published rodent food consumption guidelines33. Finally, cage changes should be avoided during the experiment, as sudden environmental changes may reduce food intake for 1–2 days, particularly in young mice.
This protocol has several limitations. First, assessment of metabolic alterations is limited to body weight and food intake, while other measures of systemic metabolism, such as respiratory exchange ratio (RER), energy expenditure, and physical activity, were not evaluated. In addition, the mechanisms underlying weight loss were not investigated; therefore, the relative contributions of reduced food intake, altered energy expenditure, malabsorption, and other factors associated with intestinal inflammation remain unclear. Second, only colonic tissue was collected and analyzed, whereas other organs involved in metabolic regulation, including adipose tissue, liver, and skeletal muscle, were not examined. Third, this protocol was developed using C57BL/6 IL-10-KO mice, which may exhibit different susceptibility to colitis compared with other genetic backgrounds. Despite these limitations, the protocol can readily be adapted to incorporate additional metabolic phenotyping and analysis of extraintestinal tissues, allowing investigation of the mechanisms underlying weight loss as well as the relationship between intestinal inflammation and systemic metabolic alterations34, or assessment of novel anti-inflammatory nanomaterials35. Furthermore, the approach should be applicable to other IL-10-KO mouse strains, although additional validation studies are warranted.
In summary, the authors report an efficient and reproducible protocol that simultaneously induces enterocolitis in multiple IL-10-KO mice and allows evaluation of feeding behavior. Further studies are needed to investigate the effects of enterocolitis on energy expenditure and body composition in this model, thereby revealing broader connections between IBD and host metabolism.
Disclosures
The authors declare no pertinent disclosures.
Acknowledgements
We wish to thank the core facilities at UTSW that contributed to the work presented here. This work was supported by the following funding sources: NIH through K08DK127197 (LS-D), T32DK007745 (JW), and the Southwestern Foundation through Docstars award (LS-D).
Materials
| Name | Company | Catalog Number | Comments |
|---|---|---|---|
| 10% buffered formalin | StatLab | 28600-1 | 1 Galllon |
| 27 G needles | BD | 305109 | |
| Anti-S100A8 + S100A9 antibody | Abcam | AB288715 | |
| Balance | Fisher scientific | S94792D | Fisher Science Education Portable Balances, 300 g |
| Citrate buffer | Sigma Aldrich | C9999-1000mL | |
| DI water | Fisher scientific | STLSL301 | |
| Dissecting forceps | Fisher scientific | 22-327379 | |
| Ethanol, 100% 200 proof | Fisher scientific | NC1675398 | Pharmco Products ETHYL ALCOHOL 200 PROOF |
| Ethanol, 190 proof, 95% | Fisher scientific | AC615110010 | |
| Ethanol, 80% | Fisher scientific | T08204K7 | |
| EZ-Quick Slide Staining Dish | IHC world | IW-2511 | Staining jar |
| EZ-Quick Slide Staining Rack | IHC world | IW-2512 | Slide rack |
| Feeding needle | Fisher scientific | NC9924986 | 22 gauge, 25 mm |
| Fine scissors | Fisher scientific | 14060-11 | |
| Flat forceps | Fisher scientific | 21-125-109 | |
| Goat anti-Rabbit IgG (H+L) Cross-Adsorbed Secondary Antibody, Alexa Fluor™ 555 | Thermo Fisher | AB_2535849 | |
| Handheld homogenizer | Fisher scientific | 15-340-167 | |
| HemoCue | Danlee Medical Products, Inc. | BCK 64151A | Hemoccult Dev/ Single Slide Test Cards - CLIA Waived |
| Hoechst 33342 | Invitrogen | 62249 | |
| IL-10 KO Mice | The Jason Laboratory | Strain #: 002251 | IL10-KO mice, genotype: B6.129P2-IL-10tm1Cgn/J |
| IVC mouse caging | Allentown | Mouse 500 | |
| Liquid nitrogen | Airgas | NI UHP300 | |
| Microscope cover glass | Fisher scientific | 12541033 | |
| Nanodrop | Thermo Fisher | ND-ONE-W | |
| Normal Goat serum | Vector labs | S-1000-20 | |
| Phosphate buffered saline (PBS) | Sigma Aldrich | D8537 | |
| Petri dishes | Fisher scientific | FB0875713 | |
| Piroxicam | Sigma Aldrich | P0847 | supply to inotiv for preparation of custom animal diet |
| Piroxicam-fortified chow | Inotiv | Custom | 200 ppm |
| Primer: Mouse GAPDH forward | Sigma Aldrich | N/A | 5' AGGTCGGTGTGAACGGATTTG 3' forward |
| Primer: Mouse GAPDH reverse | Sigma Aldrich | N/A | 5' TGTAGACCATGTAGTTGAGGTCA 3' reverse |
| Primer: Mouse IFN-G forward | Sigma Aldrich | N/A | 5' ACTGGCAAAAGGATGGTGAC 3' forward |
| Primer: Mouse IFN-G reverse | Sigma Aldrich | N/A | 5' TGAGCTCATTGAATGCTTGG 3' reverse |
| Primer: Mouse IL-10 forward | Sigma Aldrich | N/A | 5' CTTGCACTACCAAAGCCACA 3' (common) |
| Primer: Mouse IL-10 reverse | Sigma Aldrich | N/A | 5' GTTATTGTCTTCCCGGCTGT 3' (Wild type reverse) |
| Primer: Mouse IL-10 reverse (2) | Sigma Aldrich | N/A | 5' CCACACGCGTCACCTTAATA 3' (Mutant reverse) |
| Primer: Mouse IL-1B forward | Sigma Aldrich | N/A | 5' GCTGAAAGCTCTCCACCTCA 3' forward |
| Primer: Mouse IL-1B reverse | Sigma Aldrich | N/A | 5' AGGCCACAGGTATTTTGTCG 3' reverse |
| Primer: Mouse IL-6 forward | Sigma Aldrich | N/A | 5' GTTCTCTGGGAAATCGTGGA 3' forward |
| Primer: Mouse IL-6 reverse | Sigma Aldrich | N/A | 5' TTTCTGCAAGTGCATCATCG 3' reverse |
| Primer: Mouse TNF forward | Sigma Aldrich | N/A | 5' GCAGGTTCTGTCCCTTTCAC 3' forward |
| Primer: Mouse TNF reverse | Sigma Aldrich | N/A | 5' AGTGCCTCTTCTGCCAGTTC 3' reverse |
| QuantStudio 7 Pro | Thermo Fisher | A43183 | |
| RNAlater solution | Invitrogen | AM7020 | RNA Stabilization Solution, 100 mL |
| Rneasy mini kit | Qiagen | 74104 | |
| SHURDry SD-II Slide Dryer | General data | SD-ll-120 | |
| Simport Scientific EasyDip Slide Staining Rack | Fisher scientific | 22-038-494 | Staining rack |
| SlowFade Gold antifade reagent | Invitrogen | S36936 | |
| Staining dish support | BioSB | BSB7086 | |
| Staintray IHC slide staining system | IHC world | M918-1 | Humidified chamber for IHC |
| SuperScript VILO | Invitrogen | 11755050 | |
| SYBR Green Master mix | Applied Biosystems | A46109 | |
| Tintoretriever pressure cooker | BioSB | BSB7008 | |
| Tissue cassettes | Fisher scientific | 50-197-8152 | Research Products International Corp Tissue Processing Cassette, Pink, 500 per Case |
| Xylene | Pharmco | 399000000 | 1 Gallon |
References
- Hracs L, Windsor JW, Gorospe J, et al. Global evolution of inflammatory bowel disease across epidemiologic stages. Nature. 2025;642(8067):458-466.
- Dahlhamer JM, Zammitti EP, Ward BW, Wheaton AG, Croft JB. Prevalence of Inflammatory Bowel Disease Among Adults Aged ≥18 Years - United States, 2015. MMWR Morb Mortal Wkly Rep. 2016;65(42):1166-1169.
- Ng SC, Shi HY, Hamidi N, et al. Worldwide incidence and prevalence of inflammatory bowel disease in the 21st century: a systematic review of population-based studies. Lancet. 2017;390(10114):2769-2778.
- Caron B, Honap S, Peyrin-Biroulet L. Epidemiology of Inflammatory Bowel Disease across the Ages in the Era of Advanced Therapies. J Crohns Colitis. 2024;18(Supplement_2):ii3-ii15.
- Ye Y, Manne S, Treem WR, Bennett D. Prevalence of Inflammatory Bowel Disease in Pediatric and Adult Populations: Recent Estimates From Large National Databases in the United States, 2007-2016. Inflamm Bowel Dis. 2020;26(4):619-625.
- Rubtsov YP, Rasmussen JP, Chi EY, et al. Regulatory T cell-derived interleukin-10 limits inflammation at environmental interfaces. Immunity. 2008;28(4):546-558.
- Shouval DS, Biswas A, Goettel JA, et al. Interleukin-10 receptor signaling in innate immune cells regulates mucosal immune tolerance and anti-inflammatory macrophage function. Immunity. 2014;40(5):706-719.
- Glocker EO, Kotlarz D, Boztug K, et al. Inflammatory bowel disease and mutations affecting the interleukin-10 receptor. N Engl J Med. 2009;361(21):2033-2045.
- Sazonovs A, Stevens CR, Venkataraman GR, et al. Large-scale sequencing identifies multiple genes and rare variants associated with Crohn’s disease susceptibility. Nat Genet. 2022;54(9):1275-1283.
- Griffin H, Ceron-Gutierrez L, Gharahdaghi N, et al. Neutralizing Autoantibodies against Interleukin-10 in Inflammatory Bowel Disease. N Engl J Med. 2024;391(5):434-441.
- Kühn R, Löhler J, Rennick D, Rajewsky K, Müller W. Interleukin-10-deficient mice develop chronic enterocolitis. Cell. 1993;75(2):263-274.
- Berg DJ, Davidson N, Kühn R, et al. Enterocolitis and colon cancer in interleukin-10-deficient mice are associated with aberrant cytokine production and CD4(+) TH1-like responses. J Clin Invest. 1996;98(4):1010-1020.
- Mizoguchi A. Animal models of inflammatory bowel disease. Prog Mol Biol Transl Sci. 2012;105:263-320.
- Hart ML, Ericsson AC, Franklin CL. Differing Complex Microbiota Alter Disease Severity of the IL-10-/- Mouse Model of Inflammatory Bowel Disease. Front Microbiol. 2017;8:792.
- Keubler LM, Buettner M, Häger C, Bleich A. A Multihit Model: Colitis Lessons from the Interleukin-10-deficient Mouse. Inflamm Bowel Dis. 2015;21(8):1967-1975.
- Büchler G, Wos-Oxley ML, Smoczek A, et al. Strain-specific colitis susceptibility in IL10-deficient mice depends on complex gut microbiota-host interactions. Inflamm Bowel Dis. 2012;18(5):943-954.
- Berg DJ, Zhang J, Weinstock JV, et al. Rapid development of colitis in NSAID-treated IL-10-deficient mice. Gastroenterology. 2002;123(5):1527-1542.
- Hale LP, Gottfried MR, Swidsinski A. Piroxicam treatment of IL-10-deficient mice enhances colonic epithelial apoptosis and mucosal exposure to intestinal bacteria. Inflamm Bowel Dis. 2005;11(12):1060-1069.
- Holgersen K, Kvist PH, Markholst H, Hansen AK, Holm TL. Characterization of enterocolitis in the piroxicam-accelerated interleukin-10 knock-out mouse--a model mimicking inflammatory bowel disease. J Crohns Colitis. 2014;8(2):147-160.
- B C, K B, V B, et al. Recommendations for euthanasia of experimental animals: Part 2. DGXT of the European Commission. Laboratory animals. 1997;31(1).
- Ellis JL, Yin C. Histological Analyses of Acute Alcoholic Liver Injury in Zebrafish. J Vis Exp. 2017;(123):55630.
- Erben U, Loddenkemper C, Doerfel K, et al. A guide to histomorphological evaluation of intestinal inflammation in mouse models. Int J Clin Exp Pathol. 2014;7(8):4557-4576.
- Holgersen K, Kutlu B, Fox B, et al. High-resolution gene expression profiling using RNA sequencing in patients with inflammatory bowel disease and in mouse models of colitis. J Crohns Colitis. 2015;9(6):492-506.
- Ananthakrishnan AN, Adler J, Chachu KA, et al. AGA Clinical Practice Guideline on the Role of Biomarkers for the Management of Crohn’s Disease. Gastroenterology. 2023;165(6):1367-1399.
- Singh S, Ananthakrishnan AN, Nguyen NH, et al. AGA Clinical Practice Guideline on the Role of Biomarkers for the Management of Ulcerative Colitis. Gastroenterology. 2023;164(3):344-372.
- Sifuentes-Dominguez LF, Li H, Llano E, et al. SCGN deficiency results in colitis susceptibility. eLife. 2019;8:e49910.
- Sellon RK, Tonkonogy S, Schultz M, et al. Resident enteric bacteria are necessary for development of spontaneous colitis and immune system activation in interleukin-10-deficient mice. Infect Immun. 1998;66(11):5224-5231.
- Bábíčková J, Tóthová Ľ, Lengyelová E, et al. Sex Differences in Experimentally Induced Colitis in Mice: a Role for Estrogens. Inflammation. 2015;38(5):1996-2006.
- Wagnerova A, Babickova J, Liptak R, Vlkova B, Celec P, Gardlik R. Sex Differences in the Effect of Resveratrol on DSS-Induced Colitis in Mice. Gastroenterol Res Pract. 2017;2017:8051870.
- Maite CB, Roy M, Emilie V. The Effect of Sex-Specific Differences on IL-10-/- Mouse Colitis Phenotype and Microbiota. Int J Mol Sci. 2023;24(12):10364.
- Dokoshi T, Seidman JS, Cavagnero KJ, et al. Skin inflammation activates intestinal stromal fibroblasts and promotes colitis. J Clin Invest. 2021;131(21):e147614.
- Dokoshi T, Chen Y, Cavagnero KJ, et al. Dermal injury drives a skin-to-gut axis that disrupts the intestinal microbiome and intestinal immune homeostasis in mice. Nat Commun. 2024;15(1):3009.
- Allard C, Zizzari P, Quarta C, Cota D. Food intake and body weight in rodent studies: the devil is in the details. Nat Metab. 2022;4(11):1424-1426.
- M W, R L, S S, et al. Combination therapy using intestinal organoids and their extracellular vesicles for inflammatory bowel disease complicated with osteoporosis. Journal of Orthopedic Translation. 2025;53.
- Y G, H Z, Y Y, et al. Injectable body temperature-responsive hydrogel for encephalitis treatment via sustained release of nano-anti-inflammatory agents. Biomaterials translational. 2024;5(3).
Reprints and Permissions
This article has been published
Video Coming Soon