This protocol provides an experimental strategy to infer whether the animals’ body temperature set-point shifts upward or downward by simultaneously recording core body temperature and environmental temperature preference.
Method Article
A Multimodal Assay to Infer Body Temperature Set-Point Shifts in Freely Moving Mice
152 views
⸱
September 11th, 2026
In This Article
Summary
Abstract
Homeothermic animals maintain a stable core body temperature (Tc) at a set-point around 37 °C. Thermoregulatory homeostasis maintains Tc around the set-point, even when ambient temperature varies considerably. While most studies of thermoregulation focus on laboratory animals’ systemic responses to changes in ambient temperature, little is known about how the central nervous system controls the Tc set-point. To facilitate such research, we developed an experimental strategy to infer Tc set-point shifts in freely moving mice. The core assay is based on the relationship between Tc and preferred environmental temperature (Tp), measured simultaneously within a thermal gradient apparatus (15–50 °C), thereby enabling evaluation of inferred Tc set-point changes through integrated physiological and behavioral responses in a single experiment. To support the interpretation of inferred set-point shifts, complementary thermoregulatory readouts were incorporated, including brown adipose tissue (BAT) surface temperature (TBAT) as an indirect proxy for thermogenesis and tail skin temperature (Ttail) as a measure of cutaneous heat loss. To demonstrate the utility of this assay, we bidirectionally manipulated the neuronal activity of EP3 receptor-expressing neurons in the medial preoptic area of the hypothalamus (MPAEP3R neurons). Chemogenetic activation was performed in hM3Dq-expressing mice (n = 7), whereas inhibition was performed in hM4Di-expressing mice (n = 6). Deschloroclozapine and vehicle treatments were administered using a randomized within-subject design with a 24 h washout interval. Chemogenetic activation of MPAEP3R neurons reduced Tc, along with coordinated cold-seeking behavior, reduced thermogenesis, and enhanced heat-loss responses, consistent with an inferred downward shift in the Tc set-point. Conversely, inhibition of these neurons induced warm-seeking behavior, enhanced thermogenesis, and heat-conservation responses, accompanied by elevated Tc, suggesting an inferred upward shift in the Tc set-point. Overall, this strategy provides a practical and reproducible approach for inferring Tc set-point dynamics in mice and will facilitate mechanistic studies of thermoregulation.
Introduction
Maintaining a stable core body temperature (Tc) near 37 °C is critical for mammalian survival1,2,3,4. Thermoregulatory homeostasis relies on negative feedback mechanisms that precisely coordinate autonomic responses, including heat production and dissipation, with behavioral responses4,5. Hammel et al. introduced the concept of the Tc set-point, around which negative feedback regulation is centered6,7. The Tc set-point represents an internal state that influences the activity of multiple thermal effectors in response to thermal sensory inputs8,9. Despite its fundamental importance, most studies have focused on systemic responses to variations in ambient temperature, leaving the central neural control of the Tc set-point largely unexplored.
In thermoregulation research, changes in Tc alone are insufficient to determine whether the set-point has shifted. For instance, during heat stroke10,11,12, Tc rises while animals exhibit heat-dissipation and cold-seeking behaviors. These responses act to return Tc to the normal physiological range through negative feedback mechanisms. In contrast, during fever13,14,15, Tc also rises, but animals exhibit increased brown adipose tissue (BAT) thermogenesis and warm-seeking behavior. Hammel’s model explains fever by proposing an elevated Tc set-point, which accounts for why a febrile mammal shivers or seeks a warmer environment despite already having an above-normal body temperature3,6,16. Therefore, assessing changes in the Tc set-point requires evaluation of coordinated physiological and behavioral thermoregulatory responses rather than a single-parameter measurement.
In this study, we developed a multimodal assay to infer Tc set-point shifts in freely moving mice. The core component of the assay is a thermal gradient apparatus (15–50 °C) that enables simultaneous acquisition of preferred environmental temperature (Tp) and Tc within a single experiment. Tc was continuously monitored using implantable temperature probes, whereas Tp was determined from the animal’s position within the thermal gradient.
To further support the interpretation of inferred Tc set-point shifts, we incorporated several auxiliary physiological readouts. Infrared (IR) thermography was used to measure BAT surface temperature (TBAT) as an indirect proxy for thermogenesis and tail skin temperature (Ttail) as an indicator of cutaneous heat loss17,18,19,20. Importantly, these measurements serve primarily as supportive indicators of thermoeffector recruitment rather than essential components of the assay. The primary inference of set-point dynamics is derived from the coordinated relationship between Tc and Tp. Integrating these parameters with complementary thermoeffector readouts helps determine whether Tc continues to be regulated around the original set-point or is instead consistent with regulation around an inferred shifted set-point.
To demonstrate the potential application of this assay, we investigated a candidate neuronal population in the medial preoptic area (MPA) of the anterior hypothalamus, a key thermoregulatory region of the brain2,21. Previous studies have shown that prostaglandin E2 (PGE2) acts on EP3 receptor-expressing neurons in the MPA (MPAEP3R) to induce fever22,23. According to Hammel’s model, fever is characterized by an elevated Tc set-point3,6,16. These findings suggest that MPAEP3R neurons contribute to Tc set-point regulation. Although recent studies have shown that bidirectional manipulation of MPAEP3R neuronal activity alters Tc13,24, it remains unclear whether these Tc changes are accompanied by coordinated responses consistent with changes in the Tc set-point. By combining our multimodal assay with chemogenetic manipulation, we demonstrate that activation of MPAEP3R neurons reduces Tc and induces a coherent cold-seeking and heat-dissipation phenotype, consistent with a downward shift in the inferred Tc set-point. In contrast, inhibition of these neurons elicits a coordinated warm-seeking and heat-conservation phenotype, accompanied by elevated Tc, consistent with an upward shift in the inferred Tc set-point. These findings demonstrate the utility of the assay for identifying coordinated physiological and behavioral responses consistent with bidirectional changes in the inferred Tc set-point following manipulation of MPAEP3R neuronal activity.
More broadly, our results demonstrate the utility of this assay framework for determining whether changes in Tc are accompanied by coordinated responses consistent with inferred shifts in the Tc set-point. With appropriate experimental design and validation, this assay may be applied to a broad range of thermoregulatory studies, including investigations of neural circuits, pharmacological interventions, genetic models, and physiological challenges that alter body temperature regulation. Because thermoregulation involves coordinated autonomic, behavioral, and thermoeffector responses, this multimodal framework is particularly well-suited to distinguishing the physiological mechanisms underlying observed changes in Tc. However, interpretation requires careful consideration of experimental factors, including locomotor activity, body posture, sensory function, and potential direct effects of interventions on peripheral thermoeffectors.
Protocol
All animal experiments described here were approved by the Institutional Animal Care and Use Committee (IACUC) of the Chinese Institute for Brain Research, Beijing (CIBR) under protocol number CIBR-IACUC-027. All procedures were performed in accordance with institutional guidelines and the Laboratory Animal Resource Center (LARC) regulations for animal welfare and care.
1. Animals
- Genotyping of Ptger3-iCre mice
- Collect a 0.2–0.5 cm tail-tip sample from each pup at postnatal days 7–14. Place the tissue in a labeled microcentrifuge tube.
- Add 50 µL of 25 mM NaOH/0.2 mM EDTA solution to each tube.
- Incubate the samples in a thermocycler at 98 °C for 1 h to lyse the tissue. Cool the samples to 15 °C.
- Add an equal volume of 40 mM Tris-HCl (pH 5.5) to neutralize the lysate. Mix thoroughly.
- Centrifuge the tubes at 2,300 × g for 3 min at room temperature. Use 1 µL of the lysate supernatant containing genomic DNA as the template for each genotyping PCR reaction.
- Perform the 5′-arm PCR using the forward primer 5′-TGCTGCTATCCCGCAGCTGA-3′ and reverse primer 5′-TCCTGGCATCTGTCAGAGTTCTCC-3′. Identify a 559 bp product from the Ptger3-iCre allele and no product from the wild-type (WT) allele.
- Perform the WT/Ptger3-iCre allele PCR using the forward primer 5′-TGCTGCTATCCCGCAGCTGA-3′ and reverse primer 5′-GAACACTGTCATGGTTAGCCCG-3′. Identify a 416 bp product from the WT allele and a 1,526 bp product from the Ptger3-iCre allele.
- Prepare each PCR reaction in a total volume of 25 µL containing 12.5 µL of 2× Taq Master Mix, 9.5 µL of ddH2O, 1 µL of each primer (10 pmol/µL), and 1 µL of genomic DNA template.
- Perform initial denaturation at 95 °C for 5 min.
- Perform 20 cycles of 98 °C for 30 s, annealing for 30 s starting at 65 °C and decreasing by 0.5 °C per cycle, and 72 °C for 45 s.
- Perform an additional 20 cycles of 98 °C for 30 s, 55 °C for 30 s, and 72 °C for 45 s.
- Perform final extension at 72 °C for 5 min. Hold the samples at 10 °C.
- Include positive-control DNA from previously genotyped Ptger3-iCre mice and a no-template negative control in each PCR run.
- Separate the PCR products on a 1.5% agarose gel prepared with 1× TAE buffer. Perform electrophoresis at 120 V for 30 min using a 2,000 bp DNA marker as the molecular weight marker.
- Stain the gel with YeaRed and visualize the bands using a gel documentation system.
- Determine the genotype based on the expected band sizes (Supplementary Figure 1A).
- Identify WT mice by the absence of the 559 bp band in the 5′-arm PCR and the presence of only the 416 bp band in the WT/targeted allele PCR.
- Identify heterozygous Ptger3-iCre mice by the presence of the 559 bp band in the 5′-arm PCR and the 416 bp band in the WT/targeted allele PCR.
- Identify homozygous Ptger3-iCre mice by the presence of the 559 bp band in the 5′-arm PCR and the absence of the 416 bp band in the WT/targeted allele PCR.
- Validation of Ptger3-iCre expression specificity
- Perform multiplex fluorescent in situ hybridization using the RNAscope Multiplex Fluorescent Detection Kit v2 according to the manufacturer’s instructions.
- Prepare 16 µm thick fresh-frozen coronal brain sections containing the preoptic area (POA).
- Apply RNAscope probes against Ptger3 mRNA and iCre mRNA to the brain sections.
- Acquire fluorescence images using a confocal microscope. Examine the colocalization of Ptger3 and iCre signals.
- Quantify the proportion of iCre⁺ cells that co-express Ptger3 mRNA to validate the specificity of Ptger3-iCre expression (Supplementary Figure 1B).
- Animal housing and experimental design
- Maintain mice in a specific pathogen-free (SPF) barrier facility at 22 ± 1 °C and 40%–60% humidity under a 12 h light/12 h dark cycle. Provide standard rodent chow and water ad libitum.
- Use male and female heterozygous Ptger3-iCre mice on a C57BL/6J background at 8–20 weeks of age and 20–30 g body weight.
- Use 21 mice for the chemogenetic experiments: 7 mice expressing the excitatory Designer Receptors Exclusively Activated by Designer Drugs (DREADD) receptor hM3Dq (4 males and 3 females), 6 mice expressing the inhibitory DREADD receptor hM4Di (3 males and 3 females), and 8 mice expressing AAV2/9-EF1a-DIO-GFP as empty-vector controls (4 males and 4 females). All mice were histologically verified for viral expression and injection-site accuracy, and all were included in the final analysis.
- Assign the experimental groups according to viral manipulation.
- Perform the chemogenetic experiments using a within-subject crossover design. Administer deschloroclozapine (DCZ) and sterile saline (vehicle) in randomized order with a washout interval of at least 24 h between sessions.
2. Surgery
- General preoperative preparation
- Perform all surgical procedures under strict aseptic conditions using autoclave-sterilized surgical instruments. Disinfect the surgical field with 75% ethanol before each procedure.
- Maintain the mouse’s body temperature throughout surgery using a thermostatically controlled heating pad set to 37 °C.
- Induce anesthesia with 3% isoflurane in an induction chamber. Maintain anesthesia with 1.5%–2% isoflurane delivered through a nose cone.
- Confirm adequate anesthesia by verifying the absence of the pedal withdrawal reflex following a toe pinch.
- Administer meloxicam (1 mg/kg, s.c.) for analgesia and penicillin G sodium (16,000 IU/kg, s.c.) for antibiotic prophylaxis before surgery.
- Apply a thin layer of erythromycin ophthalmic ointment to the eyes to prevent corneal desiccation during anesthesia.
- Stereotaxic microinjection of viral vectors
- Secure the anesthetized mouse in a stereotaxic frame using ear bars and a nose cone to stabilize the head.
- Shave the scalp and make a small midline incision to expose the skull. Clean the skull surface with a sterile cotton swab to identify bregma and lambda.
- Level the skull by ensuring that the dorsal-ventral (DV) coordinates of bregma and lambda are identical and that the medial-lateral (ML) coordinates are balanced.
- Create bilateral craniotomies over the medial preoptic area (MPA) using a microdrill. Use the following coordinates relative to bregma according to the Paxinos and Franklin Mouse Brain Atlas (5th edition): AP = +0.25 mm, ML = ±0.3 mm, and DV = −5.2 mm.
- Load a pulled glass micropipette (20 µm) with the appropriate Cre-dependent AAV vector.
- Use AAV2/9-EF1a-DIO-hM4Di-EGFP (1.2 × 10¹³ genome copies [gc]/mL) for neuronal inhibition, AAV2/9-EF1a-DIO-hM3Dq-EGFP (7 × 10¹² gc/mL) for neuronal activation, or AAV2/9-EF1a-DIO-GFP (1.3 × 10¹³ gc/mL) as the control virus.
- Lower the micropipette vertically to the target DV coordinate at 0.1 mm/s. Inject 30 nL of virus at 10 nL/min using a nanoliter injector.
- Leave the micropipette in place for 5–10 min after injection to facilitate viral diffusion and minimize reflux.
- Retract the micropipette slowly at 0.1 mm/s. Repeat steps 2.2.7.–2.2.8. on the contralateral side to complete bilateral MPA injections.
- Close the scalp incision using absorbable surgical sutures.
- Place the mouse in a clean recovery cage positioned partially over a thermostatically controlled heating pad maintained at approximately 37 °C. Monitor the mouse continuously until it is fully awake and mobile.
- Return the mouse to its home cage after recovery from anesthesia.
- Administer meloxicam (1 mg/kg, s.c.) and penicillin G sodium (16,000 IU/kg, s.c.) every 24 h for up to 3 days after surgery.
- Monitor the mouse daily for reduced mobility, piloerection, hunched posture, dehydration, wound dehiscence, and weight loss.
NOTE: Record body weight throughout recovery. If weight loss exceeds 10% of presurgical body weight or persistent signs of pain or distress occur, provide additional treatment under veterinary supervision. - Implant the telemetry probe at least 7 days after viral injection. Proceed only after the mouse has regained normal body weight, mobility, and grooming behavior and shows no signs of postoperative complications.
- Surgical implantation of the telemetry temperature probe
- Shave the abdominal hair and disinfect the surgical site with povidone-iodine followed by 75% ethanol.
- Make a 1–2 cm midline incision in the abdominal skin, beginning approximately 1 cm below the diaphragm. Carefully incise the linea alba to open the abdominal cavity.
- Gently retract the peritoneum using sterile forceps and move the intestines aside to expose the dorsal abdominal wall.
- Anchor the telemetry temperature probe securely to the dorsal abdominal wall tissue.
- Position the probe dorsally and allow the internal organs to return to their natural orientation over the device.
- Close the peritoneal/muscle layer using absorbable surgical sutures in a continuous pattern. Close the skin using interrupted surgical sutures.
- Place the mouse in a clean recovery cage positioned partially over a heating pad maintained at approximately 37 °C. Monitor the mouse continuously until it is fully awake and ambulatory.
- Allow the mouse to recover for at least 7 days.
- Administer meloxicam (1 mg/kg, s.c.) and penicillin G sodium (16,000 IU/kg, s.c.) every 24 h for 3 consecutive days postoperatively.
- Monitor the mouse daily for signs of pain, infection, impaired mobility, or wound dehiscence.
- Begin behavioral and physiological experiments only after the mouse has recovered for at least 7 days and regained normal body weight, mobility, and grooming behavior without signs of postoperative complications.
- Humane endpoints and exclusion criteria
- Monitor each mouse for humane endpoints, including persistent weight loss exceeding 20% of presurgical body weight, severe infection, self-injury, inability to ambulate or access food and water, or failure to recover normal grooming and exploratory behavior.
- Exclude mice with severe postoperative complications, including wound dehiscence, persistent infection, or failure to recover normal activity, from further experiments.
- Euthanize mice that reach humane endpoints or meet exclusion criteria according to institutional guidelines.
- Euthanize mice by gradual exposure to carbon dioxide (CO2) at a displacement rate of 30%–50% of the chamber volume per minute.
- Confirm death by verifying the absence of respiration and heartbeat, lack of response to toe pinch or other external stimuli, and loss of reflexes before tissue collection or disposal.
3. Body temperature recording
- Tc recording and data acquisition
- Allow the mice to recover for 1 week after surgery before recording Tc.
- Record Tc using implanted telemetry temperature probes compatible with the ER-4000 telemetry receiver (Figure 1A,B).
- Acquire data using VitalView software (version 5.1). Configure the software using the unique identification number and calibration parameters of each implanted probe.
NOTE: Use the manufacturer-defined reference frequencies corresponding to 37 °C and 41 °C to establish the linear temperature-frequency relationship for each probe. - Set the Tc sampling interval to 1 min and the physiological detection range to 20–40 °C.
- Start continuous data collection. Monitor the real-time temperature trace to detect a stable signal.
- Confirm acceptable signal quality by verifying continuous temperature updates without prolonged null values, abrupt nonphysiological fluctuations, or signal interruptions.
NOTE: Disregard the null values displayed during the first 2 min of recording. - Correct signal losses lasting <10 min by linear interpolation using adjacent values. Exclude longer signal interruptions from analysis.
- Exclude a mouse from analysis if its telemetry probe continuously displays −10 instead of physiological temperature readings, indicating probe failure.
- Export the raw telemetry data, typically in ASCII format, for analysis.
- Calibration of telemetry temperature probes
- Place the telemetry temperature probe and an independent reference temperature detector adjacent to each other in a circulating warm-water bath initially maintained at approximately 45 °C.
- Record temperatures from both devices simultaneously at 1 min intervals while allowing the water temperature to decrease gradually to 36 °C.
- Compare the temperatures measured by the telemetry probe with those recorded by the reference detector across the 36–45 °C range.
- Use the reference detector measurements to recalculate the frequency calibration values corresponding to 37 °C and 41 °C based on the established temperature-frequency relationship.
- If the absolute temperature difference between the telemetry probe and reference detector exceeds ±0.5 °C, enter the recalculated frequency values corresponding to 37 °C and 41 °C into VitalView as updated calibration parameters.
- Repeat the warm-water calibration until the absolute temperature difference between the telemetry probe and reference detector remains within ±0.5 °C across the 36–45 °C range.
4. Thermal gradient for temperature preference analysis
- Thermal gradient experiments
- Use an enclosed thermal gradient apparatus with internal dimensions of 900 mm × 100 mm × 250 mm.
- Use an aluminum floor plate for heat conduction and a glass bottom plate to permit transmission of telemetry radiofrequency signals. Cover the walking surface with masking tape to improve traction without interfering with infrared thermal imaging.
- Generate the thermal gradient using thermoelectric modules based on the Peltier effect. Heat one end and cool the opposite end through polarity-controlled heat transfer.
- Use CPU heat sinks equipped with cooling fans for heat dissipation. Power the system using a 220 V alternating-current source converted internally to the direct-current voltages required by the thermoelectric modules and cooling fans.
- Place a telemetry receiver beneath the thermal gradient apparatus for simultaneous Tc recording.
- Position a dual-modal IR/visible-light camera above the apparatus to record the animal’s position and movement continuously.
- Use the default camera settings, with emissivity displayed as 1.00 in the software. Use the manufacturer’s factory-calibrated radiometric settings for temperature measurements (Figure 1A,B).
- Turn on the thermal gradient apparatus and establish a floor temperature gradient of 15–50 °C under stable ambient conditions of 22 ± 1 °C.
- Allow the apparatus to equilibrate for 1–1.5 h before each experiment.
- Habituate each mouse to the thermal gradient apparatus for 2 h/day for 3 consecutive days before testing.
- Align the IR and visible-light images using the dual-modal camera software before recording. Confirm that both views are spatially aligned within the same field of view (Figure 1C).
- Allow the mouse to move freely across the thermal gradient. Record synchronized thermal and visible-light videos at 1 frame/s.
- Clean the thermal gradient apparatus thoroughly with 75% ethanol after each experimental session to minimize residual odor cues.
- Save video files using only lowercase English letters, numbers, and underscores. Avoid spaces, non-English characters, and special symbols in file names and directory paths.
- Extract the animal’s position from the synchronized visible-light video and align it with the corresponding IR thermal image.
- Determine Tp by mapping the tracked animal position onto the corresponding IR temperature field using either manual ROI selection or the automated image-processing pipeline described in Section 8.
- For automated analysis, export the IR and visible-light video streams separately using the dual-modal camera software.
- Confirm spatial alignment of the IR and visible-light fields before export. Set the IR video temperature display range to 15–50 °C and remove all on-screen overlays, including markers, cursors, and annotations.
NOTE: For manual analysis, analyze the original data directly in the camera software without exporting the videos.
- Calibration of the thermal gradient apparatus
- Turn on the thermal gradient apparatus and establish a stable spatial gradient of 15–50 °C under open-loop control.
- Allow the apparatus to equilibrate for at least 1–1.5 h before calibration. Calibration measurements can be performed at any time after this minimum equilibration period.
- Starting from the cold end, establish measurement points at 5 cm intervals along the floor.
- At each position, record the temperature at the center of the floor, 2 cm above the floor center, and at the side wall (Supplementary Figure 2A).
- Plot the temperature at each measurement position as a function of distance from the cold end.
- Calculate the coefficient of determination (R2) for each temperature distribution.
- Confirm adequate gradient linearity by obtaining R2 ≥ 0.95 for all measurement positions (Supplementary Figure 2B).
- Repeat the calibration at regular intervals to verify the long-term stability and repeatability of the thermal gradient (Supplementary Figure 2C).
5. Thermal imaging for animal surface temperature
- Thermal imaging
- Place an IR thermal camera inside the climate chamber directly above the telemetry receiver. Use the telemetry receiver to record Tc and the IR camera to record surface temperature simultaneously (Figure 2).
- Place high-walled housing cages on the telemetry receivers.
- Acclimate the mice to the cages for 2 h/day for 3 consecutive days before testing to minimize stress-induced hyperthermia.
- Shave the interscapular and dorsal regions 3 days before thermographic recording to expose the skin overlying BAT.
- Inspect the exposed skin before testing. Proceed only if the skin is intact and shows no visible irritation.
- Acquire thermal images using AnalyzIR software (version 6.1.15). Use the default camera settings, with emissivity displayed as 1.00 in the software, and the target-distance parameter set to 1 m.
- Use the manufacturer’s factory-calibrated radiometric settings to derive temperature measurements.
- Record thermal videos of the freely moving mouse in the high-walled housing cage at 1 frame/s using autofocus mode.
- Maintain the climate chamber at 22 ± 1 °C throughout image acquisition. Keep the entire animal, including the tail, within the camera field of view.
- Save video files using only lowercase English letters, numbers, and underscores. Avoid spaces, non-English characters, and special symbols in file names and directory paths.
- For automated analysis, export thermal imaging videos in grayscale format using the thermal imaging camera software.
- Set the temperature display range to 15–40 °C, with higher temperatures shown in white and lower in black. Remove all on-screen overlays before export.
NOTE: For manual analysis, analyze the original radiometric data directly in the IR camera software without exporting the videos. - Analyze TBAT and Ttail only in frames in which the relevant body regions are fully visible and unobstructed.
- Exclude frames containing motion blur or partial occlusion from the analysis.
6. Chemogenetic manipulation
- General procedure
- Wait at least 3 weeks after stereotaxic viral injection to allow stable expression of hM3Dq or hM4Di in the target neurons.
- Prepare DCZ from a stock solution stored at −80 °C. Dilute DCZ in sterile saline to a working dose of 10 µg/kg immediately before use.
- Store the working solution at 4 °C and use it within 1 week.
- Briefly anesthetize the mouse with 5% isoflurane for approximately 10 s or until it becomes immobile.
- Apply identical anesthesia and injection procedures to the DCZ and vehicle conditions to minimize procedural variability.
NOTE: Use identical brief isoflurane exposure across conditions because isoflurane can transiently affect autonomic thermoregulation and vasomotor tone. - Administer DCZ or an equal volume of vehicle by intraperitoneal injection (i.p.) at ZT2–3 according to the randomized crossover schedule described in step 1.3.5. Use an injection volume of 100 µL per 10 g body weight.
NOTE: Define ZT0 as lights-on and ZT12 as lights-off. Perform injections at ZT2–3 to avoid rapid baseline Tc changes near the light-dark transitions (Supplementary Figure 3).
- Chemogenetic manipulation during thermal gradient experiments
- Turn on the thermal gradient apparatus at least 1 h before placing the mouse inside. Allow the gradient to reach a stable spatial temperature profile.
- Place the mouse in the thermal gradient apparatus at least 1 h before injection to allow acclimation.
- Start continuous Tc recording immediately after placing the mouse in the apparatus.
- Start IR video recording 10 min before injection to establish the pre-injection Tp baseline.
- Briefly anesthetize the mouse with 5% isoflurane for approximately 10 s or until it becomes immobile.
- Inject DCZ or vehicle intraperitoneally immediately after induction of anesthesia.
- Return the mouse immediately to the thermal gradient apparatus. Continue recording Tc and animal position for 2 h after injection.
- Determine Tp from the recorded videos as described in Section 8.1.
- Chemogenetic manipulation during thermal imaging experiments
- Place the mouse in the high-walled housing cage inside the climate chamber at least 2 h before injection to allow acclimation.
NOTE: Use the 2 h acclimation period to minimize Tc fluctuations associated with transfer to the chamber. - Start continuous Tc recording immediately after placing the mouse in the chamber.
- Start simultaneous recording of TBAT and Ttail 10 min before injection to establish the pre-injection baseline.
- Briefly anesthetize the mouse as described in step 6.1.4.
- Inject DCZ or vehicle intraperitoneally immediately after induction of anesthesia.
- Return the mouse immediately to the cage. Continue recording Tc, TBAT, and Ttail for 2 h after injection.
- Determine TBAT and Ttail from the recorded videos as described in Section 8.2.
- Place the mouse in the high-walled housing cage inside the climate chamber at least 2 h before injection to allow acclimation.
7. Verification of viral expression and injection site
- Perfuse the mouse transcardially with 1× phosphate-buffered saline (PBS), followed by 4% paraformaldehyde (PFA).
- Collect the brain and post-fix it in 4% PFA solution in 1× PBS overnight at 4 °C.
- Cryoprotect the brain by immersion in 30% sucrose in 1× PBS until it sinks.
- Prepare coronal sections containing the target region using a cryostat microtome. Store the sections at 4 °C in 1× PBS.
- Examine the sections using a fluorescence microscope to verify viral expression and injection-site localization within the MPA.
- Include only mice with confirmed viral expression within the targeted MPA region in the final analysis (Supplementary Figure 4 and Supplementary Figure 5A,B).
8. Data analysis
- Extraction of Tp from thermal gradient data
- Manual analysis (recommended for reproducibility)
- Load the raw IR and visible-light data into the software associated with the dual-modal camera.
- Align the IR and visible-light images so that both views are spatially matched within the same field of view.
- Use the visible-light channel to identify the animal. Draw an ROI encompassing the body surface without knowledge of the treatment condition.
- Maintain the ROI size as consistently as possible across frames for each animal.
- Obtain the mean temperature within the ROI and record this value as Tp for each frame.
- Repeat steps 8.1.1.3.–8.1.1.5. throughout the video to generate a frame-by-frame Tp time series.
- Automated analysis using the temperature preference analysis algorithm (optional)
NOTE: Obtain the source code, configuration files, and usage instructions from the public GitHub repository provided with the manuscript.- Load the synchronized IR and visible-light videos exported for automated analysis.
- Randomly select up to 500 frames from the analysis period for each video.
- Construct static background images by computing the most frequent pixel values over time. Apply median filtering to reduce noise.
- Define the runway region by marking its four corners. Generate a runway mask and constrain subsequent animal detection to this area.
- Perform foreground segmentation on the visible-light video by subtracting the background and applying absolute differencing with a threshold of 50.
- Apply erosion using a kernel size of 3 to suppress noise. Remove connected regions smaller than 200 pixels.
- Identify the largest remaining connected region as the mouse. Record its centroid and bounding rectangle for each frame.
- Estimate the mouse’s longitudinal size along the runway using the axis-aligned bounding rectangle. Apply geometric correction based on runway orientation to obtain a stable reference length.
- Construct a rectangular spatial template centered on the mouse centroid in each frame. Set its length to the corrected body length and estimate its width from the runway cross-section.
- Orient the rectangular template along the runway axis.
- Use the spatial template to extract Tp from the IR background image by calculating the mean of all pixels within the template.
- Repeat steps 8.1.2.5.–8.1.2.11. across all frames to generate a table of Tp values.
- Manual analysis (recommended for reproducibility)
- Extraction of TBAT and Ttail from thermal imaging data
- Manual analysis (recommended for reproducibility)
- Load the raw thermal imaging video into the software associated with the thermal imaging camera.
- Identify the interscapular region corresponding to BAT and a tail segment located approximately 3 cm distal to the tail base in each frame.
- Draw a rectangular ROI over the identified anatomical region using the software’s ROI tool without knowledge of the treatment condition.
- Maintain the ROI size as consistently as possible across frames within the same animal. Adjust it only when necessary to fully cover the target region.
- For BAT surface temperature measurements, position the ROI over the interscapular region corresponding to BAT.
- For tail surface temperature measurements, position the ROI perpendicular to the tail axis and avoid areas obscured by body posture or cage structures.
- Extract the mean temperature within each ROI for every analyzable frame.
- Reposition the ROI frame by frame to follow animal movement while maintaining consistent anatomical placement criteria.
NOTE: Apply the same anatomical landmarks and ROI placement criteria to all videos throughout the study. - Exclude frames in which the target region is partially or completely occluded and mark these frames as missing data.
- Linearly interpolate missing intervals of <10 min using adjacent valid values. Exclude longer missing intervals from analysis.
- Automated analysis using the BAT surface temperature analysis algorithm (optional)
NOTE: Obtain the source code, configuration files, and usage instructions from the public GitHub repository provided with the manuscript.- Load the thermal video exported for automated analysis.
- Crop the original video into left- and right-side single-mouse videos using the central divider to isolate each mouse’s activity area.
- Select 20 representative frames covering different postures and movement states from the single-mouse videos.
- Manually annotate the anatomical landmarks of the BAT region in the selected frames.
- Train a DeepLabCut model (version 2.3.5) using the annotated frames. Use a ResNet-50 backbone and assign 95% of the frames to the training set.
- Apply the trained model to the full single-mouse video to obtain 2D coordinates and likelihood scores for each key point in every frame.
- Map the predicted key-point coordinates from each single-mouse video back to the original video coordinate system.
- Generate per-frame sequences of key-point positions for both mice within a unified spatial reference.
- Exclude key points with likelihood scores <0.5.
- Define a circular ROI with a radius of 10 pixels around each retained key point. Refine its position using brightness-weighted centroid estimation.
- Extract the temperature values within each ROI.
- Calculate the mean pixel value within each ROI. Convert the mean pixel value to temperature using the thermal-scale ROI exported with the image.
- Repeat the extraction across all frames to generate a continuous TBAT time series. Retain low-confidence frames as missing values (NaN).
- Transform each temperature trace into the frequency domain using a Fourier transform (FT).
- Retain only the low-frequency FT bins surrounding the direct-current component (indices −10 to +10), and set the remaining components to zero.
NOTE: The indices −10 to +10 refer to discrete FT bin indices, not physical frequencies in Hz. The thermal-imaging videos were acquired at 1 frame/s, corresponding to a Nyquist frequency of 0.5 Hz. For a trace containing N samples, the frequency resolution was 1/N Hz, such that FT bin +10 corresponded to approximately 10/N Hz. This procedure was used to preserve low-frequency temperature fluctuations while suppressing frame-to-frame noise and tracking jitter. - Apply inverse FT to reconstruct the smoothed time-domain signals. Retain frames excluded during confidence filtering as missing values in the final output.
- Generate a table of TBAT values for each frame.
- Inspect the final TBAT table. Linearly interpolate brief missing intervals of <10 min using adjacent valid values. Exclude longer missing intervals from analysis.
- Manual analysis (recommended for reproducibility)
- Validation of automated measurements against manual references
NOTE: Use this procedure to validate the automated Temperature Preference Analysis and BAT Surface Temperature Analysis algorithms against manual reference measurements.- Manually measure one frame every 10 min throughout each recording, using the same frames analyzed by the automated algorithm.
- Perform Bland–Altman analysis for Tp and TBAT by plotting the difference between automated and manual measurements (automated − manual) against their mean.
- Calculate the mean bias and 95% limits of agreement (LoA; mean bias ± 1.96 SD of the differences) using all paired observations pooled across mice.
- Calculate the intraclass correlation coefficient (ICC) between automated and manual measurements for each mouse using a two-way mixed-effects model for single measurements with absolute agreement [ICC(A,1), equivalent to ICC(3,1)].
- Calculate the mean ICC across mice to summarize overall agreement.
- Interpret ICC values as <0.5, poor; 0.5–0.75, moderate; 0.75–0.9, good; and >0.90, excellent reliability25.
- Summarize agreement between automated and manual measurements using the ICC across mice, pooled Bland–Altman mean bias and 95% LoA, and mean RMSE and MAE across mice for Tp and TBAT (Table 1).
- Data integration and statistical analysis
- Thermal gradient behavioral analysis
- Divide the thermal gradient apparatus into 1 °C temperature bins ranging from 15 °C to 50 °C.
- Track mouse position at 1 frame/s and assign each frame to the corresponding temperature bin.
- Calculate the fraction of the total time spent in each temperature bin during the 2 h post-injection period.
- Calculate Tp for each animal as the weighted mean of occupied temperatures during the full 2 h session.
- Extract Tc at a sampling resolution of 1 min and align the measurements to injection time.
- Use Tc values recorded during the 10 min immediately before injection (−10 to 0 min) as pre-injection reference measurements.
- Analyze physiological responses during the 2 h post-injection period (0–120 min; Figure 3A–C, Figure 4A–C, and Supplementary Figure 5C, Supplementary Figure 6, Supplementary Figure 7, and Supplementary Figure 8).
- Thermal imaging data processing
- Extract Tc at a sampling resolution of 1 min from the telemetry recordings.
- Extract TBAT and Ttail at a sampling resolution of 1 min from the thermal imaging recordings.
- Align all physiological signals to the injection time for synchronized analysis.
- Use the 10 min immediately before injection (−10 to 0 min) as the reference window. Analyze physiological responses over the 2 h post-injection period (0–120 min).
- Quantify Tc, TBAT, and Ttail for each animal over the 2 h post-injection period (Figure 3D–F, Figure 4D,E, Supplementary Figure 9, and Supplementary Figure 10).
- Statistical analysis
- Perform all statistical analyses using GraphPad Prism (version 10.2.3).
- Define each individual mouse as the experimental unit.
- Treat repeated measurements across time or video frames as repeated observations from the same animal rather than as independent biological replicates.
- Analyze Tp using repeated measures two-way ANOVA with treatment (DCZ vs. vehicle) and temperature bin as within-subject factors.
- Analyze Tc, TBAT, and Ttail using repeated measures two-way ANOVA with treatment (DCZ vs. vehicle) and time as within-subject factors.
- Assess the data distribution before statistical testing.
- Apply the Geisser–Greenhouse correction when the sphericity assumption is violated.
- Perform post hoc comparisons using Sidak’s multiple comparisons test to identify time points showing significant differences between treatments.
- Define statistical significance as P < 0.05. Report all data as mean ± SEM.
- Thermal gradient behavioral analysis
Results
Figure 3 demonstrates the sustained hypothermic state induced by chemogenetic activation of MPAEP3R neurons. Tc rapidly decreased from 36.8 ± 0.3 °C (mean Tc during the −10 to 0 min pre-injection period; mean ± SEM) to 28.1 ± 0.4 °C (mean Tc during the 30–120 min post-injection period). Across the 2 h post-injection period, DCZ-treated mice exhibited significantly lower Tc than vehicle-treated mice (n = 7 mice, P < 0.01, two-way repeated measures ANOVA followed by Sidak’s multiple comparisons test; Figure 3A). Mice also exhibited a behavioral shift toward cooler ambient temperatures, as indicated by a decrease in their Tp (Figure 3B). For each 2 h session, the most frequently occupied temperature was identified for each mouse, and the mean of these modal temperatures across mice was 33.0 ± 0.3 °C in vehicle-treated sessions and 26.0 ± 1.1 °C following DCZ administration (n = 7 mice, P < 0.01, two-way repeated measures ANOVA; Figure 3C). This hypothermia was accompanied by a reduction in thermogenesis, as reflected by a decrease in interscapular surface TBAT from 33.4 ± 0.2 °C to 26.3 ± 0.2 °C, together with increased heat dissipation, as evidenced by an elevation in Ttail from 22.8 ± 0.1 °C (mean Ttail during the −10 to 0 min pre-injection period) to 26.1 ± 0.5 °C (mean Ttail during the 0–30 min post-injection period). Across the 2 h post-injection period, DCZ treatment significantly reduced interscapular surface TBAT and increased Ttail relative to vehicle treatment (n = 7 mice, P < 0.01, two-way repeated measures ANOVA followed by Sidak’s multiple comparisons test; Figure 3D–F).
Figure 4 shows the physiological and behavioral outcomes following the chemogenetic inhibition of MPAEP3R neurons. Tc increased from 36.5 ± 0.2 °C (mean Tc during the −10 to 0 min pre-injection period; mean ± SEM) to 39.0 ± 0.2 °C (mean Tc during the 30–120 min post-injection period). Across the 2 h post-injection period, DCZ-treated mice exhibited significantly higher Tc than vehicle-treated mice (n = 6 mice, P < 0.05, two-way repeated measures ANOVA followed by Sidak’s multiple comparisons test; Figure 4A). Mice also exhibited a behavioral shift toward warmer ambient temperatures, as indicated by an increase in Tp (Figure 4B). For each 2 h session, the most frequently occupied temperature was identified per mouse, and the mean of these modal temperatures across mice was 34.2 ± 0.3 °C in vehicle-treated sessions and 37.2 ± 0.2 °C following DCZ administration (n = 6 mice, P < 0.001, two-way repeated measures ANOVA; Figure 4C). This hyperthermia was accompanied by a marked increase in thermogenesis, as reflected by an elevation in interscapular TBAT from 34.5 ± 0.2 °C to 36.3 ± 0.2 °C. Across the 2 h post-injection period, DCZ treatment significantly increased TBAT relative to vehicle treatment (n = 5 mice, P < 0.0001, two-way repeated measures ANOVA followed by Sidak’s multiple comparisons test; Figure 4D). Because the tail was obscured beneath the body, tail temperature could not be reliably quantified (Figure 4E).
Table 1 shows excellent agreement between automated and manual measurements for both TBAT and Tp. Mean ICC values were 0.959 ± 0.031 for TBAT and 0.996 ± 0.003 for Tp, indicating excellent agreement. Bland–Altman analysis showed small mean biases (−0.217 °C and −0.074 °C, respectively) with relatively narrow 95% LoA. RMSE and MAE were also low for both metrics, further supporting the accuracy of the automated measurements.
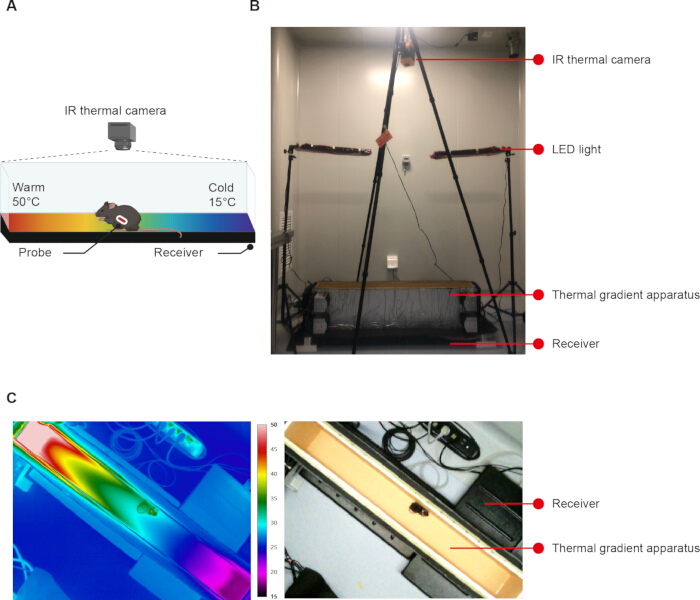
Figure 1: Simultaneous recordings of Tc and Tp in the thermal gradient apparatus. (A–B) Schematic diagram (A) and representative photograph (B) of the thermal gradient apparatus. An IR thermal camera (integrated IR and visible-light sensors) was mounted above the apparatus to track the animals' position and record local ambient temperature (Tp) in real time. Concurrently, a telemetry receiver beneath the apparatus continuously recorded core body temperature (Tc) from an intraperitoneally implanted probe. (C) Representative IR image (left) showing the thermal gradient and the corresponding visible-light image (right) used for automated position tracking and Tp determination. Cooler colors indicated lower temperatures, and warmer colors represented higher temperatures according to the accompanying IR temperature scale (15–50 °C). Please click here to view a larger version of this figure.
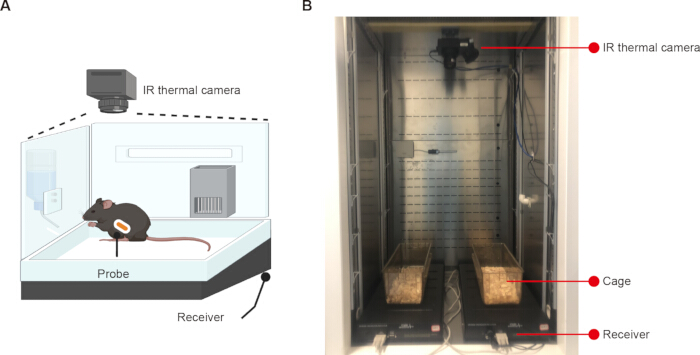
Figure 2: Simultaneous recordings of Tc, TBAT, and Ttail in a climate chamber. (A–B) Schematic diagram (A) and representative photograph (B) of the experimental setup. An IR thermal camera was mounted above the cage to record interscapular brown adipose tissue surface temperature (TBAT) and tail skin temperature (Ttail). Concurrently, a telemetry receiver under the cage continuously recorded Tc from an intraperitoneally implanted probe. Please click here to view a larger version of this figure.
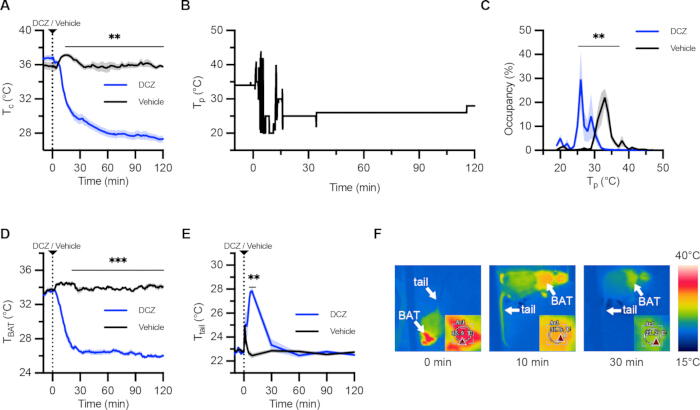
Figure 3: Chemogenetic activation of MPAEP3R is consistent with an inferred downward shift of the Tc set-point. (A) Quantified result showing the time course of Tc following DCZ (10 µg/kg) or vehicle injections in hM3Dq-expressing mice during thermal gradient experiments (n = 7). (B) Representative Tp results from an hM3Dq-expressing mouse. Following DCZ injection, the mouse showed a shift in Tp toward cooler ambient temperatures. (C) Quantified result showing Tp during the 2 h session following DCZ or vehicle injections in hM3Dq-expressing mice (n = 7). Tp was defined as the local ambient temperature occupied by the mouse and was calculated from occupancy within 1 °C temperature bins spanning the thermal gradient. Curves represented the mean fraction of time spent at each ambient temperature across animals. (D–E) Quantified result showing the time course of interscapular surface TBAT (D) and Ttail (E) following DCZ or vehicle injections in hM3Dq-expressing mice (n = 7). (F) Representative thermal images from an hM3Dq-expressing mouse at 0, 10, and 30 min after DCZ injection, showing changes in surface temperature distributions. White arrows indicated the interscapular BAT and tail regions. Insets show enlarged views of the interscapular BAT region with the corresponding ROI used for manual TBAT calculation and the software-displayed surface temperature within the ROI. Cooler colors indicated lower surface temperatures, and warmer colors represented higher surface temperatures according to the accompanying IR temperature scale (15–40 °C). The color scale represented pixel-level surface temperatures, whereas TBAT was calculated by the algorithm as the mean surface temperature across all pixels within the predefined interscapular BAT ROI and served as an indirect proxy for BAT thermogenic activity. Ttail was defined as the mean temperature within the visible tail region. Following DCZ injection, representative images showed reduced TBAT and elevated Ttail. Each individual mouse was treated as the biological replicate. Each mouse received both vehicle and DCZ treatments in a randomized crossover design. Data are presented as mean ± SEM. Solid lines indicated the mean, shaded areas indicated the SEM, and the dashed line denoted the time of injection (0 min). For summary values reported in the Representative Results, pre-injection measurements were averaged over −10 to 0 min and post-injection measurements over 30 to 120 min. Statistical analyses were performed using two-way repeated measures ANOVA with treatment and time (A, D, E) or treatment and temperature bin (C) as within-subject factors, followed by Sidak’s multiple comparisons test. ns, not significant. Asterisks indicate significant differences between DCZ and vehicle treatments at individual time points. **P < 0.01; ***P < 0.001. Please click here to view a larger version of this figure.
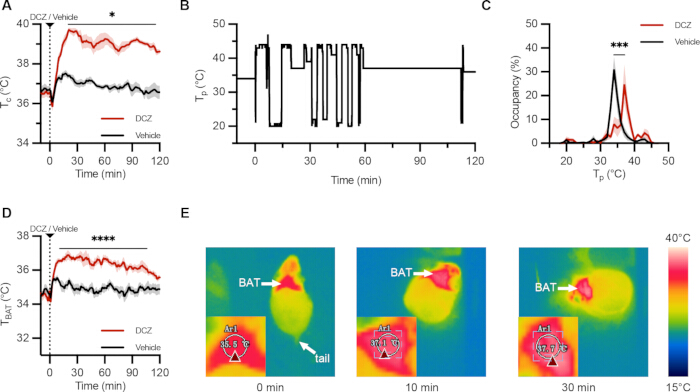
Figure 4: Chemogenetic inhibition of MPAEP3R is consistent with an inferred upward shift of the Tc set-point. (A) Quantified result showing the time course of Tc following DCZ (10 µg/kg) or vehicle injections in hM4Di-expressing mice during thermal gradient experiments (n = 6). (B) Representative Tp results from an hM4Di-expressing mouse. Following DCZ injection, the mouse showed a shift in Tp toward warmer ambient temperatures. (C) Quantified result showing Tp during the 2 h session following DCZ or vehicle injections in hM4Di-expressing mice (n = 6). Tp was defined as the local ambient temperature occupied by the mouse and was calculated from occupancy within 1 °C temperature bins spanning the thermal gradient. Curves represented the mean fraction of time spent at each ambient temperature across animals. (D) Quantified result showing the time course of interscapular TBAT following DCZ or vehicle injections in hM4Di-expressing mice (n = 5). (E) Representative thermal images from an hM4Di-expressing mouse at 0, 10, and 30 min after DCZ injection, showing surface temperature distributions. Insets show enlarged views of the interscapular BAT region with the corresponding ROI used for manual TBAT calculation and the software-displayed surface temperature within the ROI. Cooler colors indicated lower surface temperatures, and warmer colors represented higher surface temperatures according to the accompanying IR temperature scale (15–40 °C). The color scale represented pixel-level surface temperatures, whereas TBAT was calculated by the algorithm as the mean surface temperature across all pixels within the predefined interscapular BAT ROI and served as an indirect proxy for BAT thermogenic activity. Ttail was defined as the mean temperature within the visible tail region. Following inhibition, representative images showed increased TBAT. In these images, the tail was frequently obscured, preventing reliable recording of tail temperature. Each individual mouse was treated as the biological replicate. Each mouse received both vehicle and DCZ treatments in a randomized crossover design. Data were presented as mean ± SEM. Solid lines indicated the mean, shaded areas indicated the SEM, and the dashed line denoted the time of injection (0 min). For summary values reported in the Representative Results, pre-injection measurements were averaged over −10 to 0 min and post-injection measurements over 30 to 120 min. Statistical analyses were performed using two-way repeated measures ANOVA with treatment and time (A, D) or treatment and temperature bin (C) as within-subject factors, followed by Sidak’s multiple comparisons test. Asterisks indicate significant differences between DCZ and vehicle treatments at individual time points. *P < 0.05; ***P < 0.001; ****P < 0.0001. Please click here to view a larger version of this figure.
| Metric | Mean ICC across mice | Mean bias (°C) | 95% LoA (°C) | Mean RMSE (°C) | Mean MAE (°C) |
| BAT Temperature | 0.959 ± 0.031 | −0.217 | −0.831 to 0.396 | 0.336 ± 0.194 | 0.296 ± 0.180 |
| Temperature Preference | 0.996 ± 0.003 | −0.074 | −0.513 to 0.365 | 0.230 ± 0.053 | 0.195 ± 0.070 |
Table 1: Agreement between automated and manual temperature measurements. Agreement between automated and manual measurements was evaluated using the intraclass correlation coefficient [ICC(A,1)], Bland–Altman analysis, root mean square error (RMSE), and mean absolute error (MAE). ICC values were presented as mean ± SD across mice. For the Bland–Altman analysis, the mean bias (Automated − Manual) and 95% limits of agreement (LoA; mean bias ± 1.96 SD of differences) were calculated using all paired observations pooled across mice.
Supplementary Figure 1: Validation of Ptger3-iCre expression specificity. (A) PCR genotyping strategy for the Ptger3-iCre mouse line. Representative gel images showed the 5’-arm PCR (top) and the wild-type (WT)/targeted allele PCR (bottom). A 2,000 bp DNA ladder was used as a molecular weight marker. WT mice were identified by the absence of the 559 bp band and the presence of only the 416 bp band. Heterozygous mice showed the 559-bp and 416-bp bands. Homozygous mice showed the 559 bp band and the absence of the 416 bp band. Mouse identification numbers were indicated below each lane. (B) Multiplex fluorescent in situ hybridization (RNAscope) for Ptger3 mRNA (red) and iCre mRNA (green) in the medial preoptic area (MPA) from Ptger3-iCre mice. Nuclei were counterstained with DAPI (blue). The percentage of Ptger3⁺/iCre⁺ cells represented the proportion of Ptger3-expressing cells that also expressed iCre mRNA. The percentage of iCre⁺/Ptger3⁺ cells represented the proportion of iCre-expressing cells that also expressed Ptger3 mRNA. A total of 809 cells were quantified across three mice, with individual animal counts of 256, 272, and 281 cells (n = 3 mice). Data were presented as mean ± SEM. Scale bar: 50 µm.Please click here to download this file.
Supplementary Figure 2: Characterization of the thermal gradient in the apparatus. (A) Schematic of measurement positions along the floor of the apparatus. Temperature detector positions were indicated for the three measurement locations: floor center, air 2 cm above the floor center, and the side wall of the apparatus. Measurements were taken at 5 cm intervals starting from the cold end. (B) Temperature profiles as a function of distance from the cold end for the three measurement positions. The coefficient of determination (R2) was shown for each profile. An R2 ≥ 0.95 confirms good linearity of the gradient. Solid lines represented linear regressions for each dataset. (C) Temperature profiles obtained from repeated calibrations 1 year (left) and 3 years (right) after the calibration shown in (B), showing comparable spatial temperature distributions and supporting the long-term repeatability of the thermal gradient.Please click here to download this file.
Supplementary Figure 3: Circadian rhythm of Tc in a representative mouse. Representative 24 h profile of Tc under a 12 h light/12 h dark cycle. The white area indicated the light phase (ZT0–12) and the gray shaded area indicated the dark phase (ZT12–24). Rapid changes in Tc baseline were observed around the light–dark transitions (ZT12 and ZT24). Abbreviations: ZT = Zeitgeber time.Please click here to download this file.
Supplementary Figure 4: Verification of viral expression and injection site. (A) Representative coronal brain sections from mice injected with Cre-dependent chemogenetic activator virus (hM3Dq-EGFP) in the MPA, showing EGFP expression in 7 individual mice (M1–M7). (B) Representative coronal brain sections from mice injected with Cre-dependent chemogenetic inhibitory virus (hM4Di-EGFP) in the MPA, showing EGFP expression in 6 individual mice (M1–M6). Scale bars: 200 µm.Please click here to download this file.
Supplementary Figure 5: Negative control experiment using an empty vector. (A) Schematic illustration of bilateral injection of AAV-EF1a-DIO-GFP into the MPA. (B) Representative coronal brain section showing GFP expression within the MPA, confirming successful viral transduction at the injection site. Scale bars: 200 µm. (C) Quantified result showing the time course of Tc following DCZ (10 µg/kg) or vehicle (saline) injections in mice (n = 8). Data were presented as mean ± SEM. Solid lines indicated the mean, shaded areas indicated the SEM, and the dashed line denoted the time of injection (0 min). Statistical analyses were performed using two-way repeated measures ANOVA with treatment and time as within-subject factors, followed by Sidak’s multiple comparisons test. “ns” denoted no statistically significant difference. Please click here to download this file.
Supplementary Figure 6: Extended 4-hour recording of Tc following chemogenetic manipulation of MPAEP3R neurons. (A) Quantified result showing the time course of Tc over 4 h following chemogenetic inhibition of MPAEP3R neurons with DCZ (10 µg/kg) or vehicle (saline) injections in mice (n = 6). Tc progressively increased after DCZ injection and gradually returned toward vehicle-treated levels by 4 h post-injection. (B) Quantified result showing the time course of Tc over 4 h following chemogenetic activation of MPAEP3R neurons with DCZ (10 µg/kg) or vehicle (saline) injections in mice (n = 7). Tc remained stably low throughout the entire 4 h recording period. Data were presented as mean ± SEM. Solid lines indicated the mean, shaded areas indicated the SEM, and the dashed line denoted the time of injection (0 min). Statistical analyses were performed using a two-way repeated measures ANOVA with treatment and time as within-subject factors, followed by Sidak’s multiple comparisons test. Asterisks indicate significant differences between DCZ and vehicle treatments at individual time points. ***P < 0.001; ****P < 0.0001.Please click here to download this file.
Supplementary Figure 7: Individual raw traces of Tc and Tp following chemogenetic activation of MPAEP3R neurons. (A) Raw traces of Tc for each individual mouse (M1–M7) during chemogenetic activation of MPAEP3R neurons. The dashed line denotes the time (0 min) of DCZ (10 µg/kg) or vehicle (saline) injections. (B) Individual traces of Tp for each individual mouse (M1–M7) during chemogenetic activation of MPAEP3R neurons. Tp was calculated from occupancy within 1 °C temperature bins spanning the thermal gradient.Please click here to download this file.
Supplementary Figure 8: Individual raw traces of Tc and Tp following chemogenetic inhibition of MPAEP3R neurons. (A) Raw traces of Tc for each individual mouse (M1–M6) during chemogenetic inhibition of MPAEP3R neurons. The dashed line denotes the time (0 min) of DCZ (10 µg/kg) or vehicle (saline) injections. (B) Individual traces of Tp for each individual mouse (M1–M6) during chemogenetic inhibition of MPAEP3R neurons. Tp was calculated from occupancy within 1 °C temperature bins spanning the thermal gradient.Please click here to download this file.
Supplementary Figure 9: Individual raw traces of TBAT and Ttail following chemogenetic activation of MPAEP3R neurons. (A) Raw traces of TBAT for each individual mouse (M1–M7) during chemogenetic activation of MPAEP3R neurons. (B) Raw traces of Ttail for each individual mouse (M1–M7) during chemogenetic activation of MPAEP3R neurons. The dashed line denotes the time (0 min) of DCZ (10 µg/kg) or vehicle (saline) injections.Please click here to download this file.
Supplementary Figure 10: Individual raw traces of TBAT following chemogenetic inhibition of MPAEP3R neurons. Raw traces of TBAT for each individual mouse (M2–M6) during chemogenetic inhibition of MPAEP3R neurons. The dashed line denotes the time (0 min) of DCZ (10 µg/kg) or vehicle (saline) injections.Please click here to download this file.
Discussion
Temperature set-point dynamics are classically defined as coordinated adjustments of autonomic and behavioral thermoeffector outputs that maintain Tc within a regulated range. However, direct measurement of the Tc set-point is not possible in vivo. In this study, we developed an experimental framework in which Tc set-point changes are inferred from the directional relationship between Tc and Tp within a thermal gradient. This Tc–Tp coupling forms the core analytical principle of the assay, enabling identification of coordinated physiological and behavioral thermoregulatory states under defined experimental conditions. A key feature of the assay is that interpretation does not rely on either variable alone but on their coordinated directionality. Specifically, concordant decreases or increases in Tc and Tp are interpreted as consistent with downward or upward shifts in the inferred Tc set-point, respectively. This dual-variable approach provides a practical strategy for distinguishing coordinated changes in the thermoregulatory state from isolated alterations in core temperature.
To strengthen interpretation, additional physiological and behavioral readouts were incorporated as supportive indicators of thermoeffector engagement. These include TBAT, a measure of interscapular surface temperature and an indirect proxy for BAT thermogenic activity, and Ttail, an indicator of cutaneous heat dissipation. These measures are not required for Tc–Tp-based inference of set-point dynamics, but they provide complementary evidence that autonomic and behavioral effector systems are recruited in a coordinated manner consistent with inferred thermoregulatory states.
Several key aspects of the protocol ensure reliable results. First, when using the thermal gradient apparatus to assess temperature preference, the dual-sensor camera should be aligned carefully to ensure that ambient temperature is accurately assigned to the animal’s position. Second, adequate habituation to the thermal gradient apparatus is essential for obtaining reliable behavioral data. Stress or excessive locomotion may confound temperature preference recordings. Animals that continue to exhibit signs of anxiety or abnormal activity after habituation may require additional acclimation or should be excluded from analysis. Third, bedding type and depth must be strictly controlled to ensure clear visibility of the mouse in IR images. Corncob bedding is recommended and should be used as a single-layer just sufficient to cover the cage floor (≤ 0.5 cm). Lightweight materials, such as wood shavings, should be avoided because they can be easily displaced by the animal and may obscure the tail or interscapular region. Excessive bedding may also allow mice to burrow and hide from the IR video camera, compromising accurate surface temperature measurements. Finally, shaving the interscapular region is necessary to expose the skin overlying BAT, enabling accurate recording of BAT surface temperature.
In addition to the essential considerations above, several experimental parameters can be adjusted depending on the experiment's purpose. First, the IR camera sampling rate can be adjusted to meet experimental needs. Reducing the sampling rate may be necessary for long-term recordings to reduce data volume and facilitate downstream analysis. However, a maximum sampling interval of 2 min per frame is recommended to ensure reliable skin temperature recording. Second, the environmental temperature during recording can be adjusted according to experimental needs. For example, lower or higher environmental temperatures can be used to examine thermoregulatory responses under cold or warm conditions; however, the thermal gradient apparatus should be recalibrated to ensure a consistent experimental setup.
Several methodological limitations should be considered when interpreting the results. First, the thermal gradient test is dependent on the animal’s locomotor activity. If mice continue to move through the apparatus without sustained occupancy of a specific zone before injection, temperature preference cannot be reliably assessed. In such cases, the experiment should be postponed with additional habituation provided. Second, the IR camera is sensitive to posture and occlusion. If the mouse curls up, covering its tail, or displaces bedding over the body, regions of interest such as interscapular BAT or tail may become obscured, resulting in missing or unreliable temperature measurements. These frames should be labeled as low-confidence detections and excluded from the final temperature time series. Third, BAT surface temperature reflects the peripheral skin temperature overlying thermogenic tissue and should be interpreted as an indirect proxy, influenced by local blood flow, insulation, and environmental conditions, rather than a direct measure of thermogenesis. Nevertheless, infrared thermography has been widely adopted in thermoregulation research as a non-invasive approach for monitoring thermoregulatory responses in freely moving animals15,17,18,19,20. Fourth, brief isoflurane anesthesia used during experimental procedures may transiently affect thermoregulatory responses and should be carefully controlled across experimental groups. Finally, the present study was conducted in adult C57BL/6J mice, including both male and female subjects. Although this increases generalizability within this strain, the applicability of the framework to other mouse strains, developmental stages, or species remains to be systematically evaluated and may require parameter adjustment or retraining of automated analysis modules.
Using this framework, we evaluated the effects of bidirectional chemogenetic manipulation of MPAEP3R neurons. Activation and inhibition of these neurons produced coordinated changes in Tc and Tp, consistent with bidirectional shifts in inferred thermoregulatory state. Specifically, activation resulted in reduced Tc together with a shift toward lower Tp, accompanied by physiological and behavioral signatures consistent with enhanced heat dissipation. Conversely, inhibition increased Tc and shifted Tp toward higher values, accompanied by responses consistent with heat conservation. Importantly, these interpretations are based on coordinated Tc–Tp dynamics, with BAT and tail surface temperature providing supporting evidence for effector engagement rather than serving as independent indicators of set-point control.
More broadly, comparison with existing approaches highlights the advantage of integrating Tc–Tp coupling within a single experimental framework. Telemetry-based Tc measurements alone provide high temporal resolution but cannot distinguish thermoregulatory state from effector dysfunction. Thermal preference assays capture behavioral regulation but do not directly report core temperature dynamics. Infrared thermography provides spatially resolved surface temperature measurements but lacks direct information about the central thermoregulatory state. By integrating Tc and Tp measurements as the primary inferential axis, with complementary physiological readouts for validation, the present assay enables a more comprehensive assessment of coordinated thermoregulatory responses than single-modality approaches, while maintaining clear interpretability of the underlying inference logic.
Several neuronal populations across multiple brain regions have been implicated in thermoregulation, including glutamatergic26,27,28,29 and GABAergic neurons30,31,32,33, as well as populations expressing specific neuropeptides or receptors. For example, BDNF/PACAP34 and galanin neurons35 in the preoptic area, Erα-expressing neurons36 in the ventromedial hypothalamus, and leptin receptor neurons37,38,39 in the dorsomedial hypothalamus all contribute to thermoregulatory control. In addition, thermoregulatory pathways outside the hypothalamus, such as orexin-A receptor signaling in the raphe pallidus40,41, have also been implicated in thermoregulation. Although these neurons respond to environmental or brain temperature changes, it remains unclear which populations actively establish and regulate the Tc set-point. Our study suggests that MPAEP3R neurons participate in thermoregulatory control of the inferred Tc set-point. Similar approaches can be applied in future studies to dissect the specific roles of different neuronal populations in thermal homeostasis.
Disclosures
The authors have nothing to disclose.
Acknowledgements
We thank Mr. Qingjie Zhu for developing algorithms for temperature preference and thermal imaging analysis. We thank Ms. Xiaoqing Hao for technical assistance with stereotactic viral injections. We also thank the following CIBR cores for their support: the Vector Core for viral packaging; the Instrumentation Core for designing and fabricating the thermal preference apparatus; the Computing and Data Science Core for institutional support; and the Laboratory Animal Resource Center for animal breeding and maintenance. This work was supported by the National Natural Science Foundation of China (NSFC, 32271229) and the Beijing Key Laboratory of Brain Science and Brain-Machine Interface. The authors used ChatGPT (OpenAI, San Francisco, CA, USA) to assist with language polishing. All scientific content, analysis, and conclusions were determined solely by the authors.
Materials
| Name | Company | Catalog Number | Comments |
|---|---|---|---|
| 2× Taq Master Mix | Vazyme | P112-03 | PCR master mix used for genotyping Ptger3-iCre mice. |
| 4% paraformaldehyde | Biosharp | BL539A | Fixative used for transcardial perfusion and overnight post-fixation of brain tissue. |
| AAV2/9-EF1a-DIO-GFP | CIBR Vector Core | BV01003 | Cre-dependent control viral vector used for empty-vector control experiments. |
| AAV2/9-EF1a-DIO-hM3Dq-EGFP | CIBR Vector Core | BV03005 | Cre-dependent excitatory DREADD viral vector used for chemogenetic activation of MPA EP3R neurons. |
| AAV2/9-EF1a-DIO-hM4Di-EGFP | CIBR Vector Core | BV03003 | Cre-dependent inhibitory DREADD viral vector used for chemogenetic inhibition of MPA EP3R neurons. |
| Absorbable Surgical Suture | Jinhuan | 5-0 | Used to close surgical incisions following stereotaxic injection and telemetry probe implantation. |
| Agarose | Aladdin | A118880 | Used to prepare 1.5% agarose gels for electrophoretic separation of genotyping PCR products. |
| Climate Chamber | Ningbo Jiangnan Instrument Factory | JNR-518A | Temperature-controlled chamber maintained at 22 ± 1 °C during thermal-imaging experiments. |
| Cryostat microtome | Leica | CM3050S | Used to prepare coronal brain sections for histological verification of viral expression and injection sites. |
| Deschloroclozapine | MCE | HY-42110 | DREADD agonist administered intraperitoneally at 10 µg/kg for chemogenetic manipulation. |
| DNA Marker | Vazyme | MD101-01 | 2,000 bp DNA molecular-weight marker used for identification of PCR products during agarose gel electrophoresis. |
| Dual-modal IR Camera | Fluke | RSE600 | Integrated infrared/visible-light camera used to record the thermal gradient and track mouse position for Tp determination. |
| Erythromycin Eye Ointment | Beijing Twinluck Pharmaceutical | 0.5% | Applied during anesthesia to prevent corneal desiccation. |
| Ethylenediamine tetraacetic acid | Sinopharm Chemical Reagent | 10009617 | Component of the alkaline tail-tissue lysis solution used for preparation of genomic DNA for genotyping. |
| Fluorescence microscope | Olympus | BX43 | Used to verify viral fluorescence expression and injection-site localization in the MPA. |
| Gel doc system | Shenhua Science Technology | SH-Magic 510 | Used to visualize and document stained genotyping PCR products after agarose gel electrophoresis. |
| Glass Micropipette | Sutter | B120-69-10 | Pulled glass pipette used for bilateral stereotaxic microinjection of viral vectors into the MPA. |
| High-Walled Housing Cage | Exo Terra | 370 mm x 220 mm x 250 mm | Used to house freely moving mice during simultaneous thermal-imaging and telemetry recordings. |
| Isoflurane | RWD Life Science | R510-22-8 | Inhalational anesthetic used for surgery and brief anesthesia during DCZ or vehicle administration. |
| Meloxicam | Qilu Animal Health Products | 20 ml : 40 mg | Analgesic administered subcutaneously before and after surgery. |
| Microdrill | RWD Life Science | 78001 | Used to create bilateral cranial openings for stereotaxic viral injection. |
| Nanoliter Injector | WPI | Nanoliter 2020 | Used for controlled delivery of 30 nL viral vector at 10 nL/min during stereotaxic injection. |
| NaOH | Aladdin | S111501 | Component of the alkaline tail-tissue lysis solution used for genomic DNA preparation. |
| PCR primer | GENEWIZ | custom-built | Primer sets used to distinguish wild-type and Ptger3-iCre alleles during genotyping PCR. |
| Penicillin G Sodium | Shandong Shengwang Pharmaceutical | 0.96 g (16,000 units per kilogram) | Antibiotic administered subcutaneously for perioperative prophylaxis. |
| RNAscope Multiplex Fluorescent Detection Kit v2 | Advanced Cell Diagnostics | 323100 | Multiplex fluorescent in situ hybridization kit used to assess Ptger3 and iCre mRNA colocalization. |
| RNAscope probe-iCre | Advanced Cell Diagnostics | 423321 | RNAscope probe used to detect iCre mRNA in Ptger3-iCre brain sections. |
| RNAscope probe-Ptger3 | Advanced Cell Diagnostics | 504481 | RNAscope probe used to detect Ptger3 mRNA in brain sections. |
| Stereotaxic Instrument | RWD Life Science | 71001 | Used to position mice and guide bilateral viral injections into the medial preoptic area. |
| Sucrose | Sinopharm Chemical Reagent | 10021418 | 30% sucrose solution used for cryoprotection of fixed brain tissue before sectioning. |
| TAE buffer | Solarbio | T1060 | Electrophoresis buffer used for preparation and running of agarose gels. |
| Telemetry Receiver | Starr Life Sciences | ER-4000 | Receiver positioned beneath the apparatus or cage for continuous recording of signals from implanted temperature probes. |
| Telemetry Temperature Probe | Starr Life Sciences | E-Mitter-G2 | Implantable probe used for continuous measurement of core body temperature (Tc). |
| Thermal Gradient Apparatus | CIBR Instrumentation Core | custom-built | Custom apparatus generating a 15–50 °C floor temperature gradient for measurement of preferred environmental temperature (Tp). |
| Thermal Imaging Camera | Fotric | 228s | Infrared camera used to measure interscapular surface temperature (TBAT) and tail surface temperature (Ttail). |
| Tris-HCl | Coolaber | SL31X3 | Used to neutralize the NaOH/EDTA tail-tissue lysate during genomic DNA preparation. |
| YeaRed | Yeasen | 10202ES76 | Nucleic-acid stain used to visualize DNA bands following agarose gel electrophoresis. |
References
- Ramsay DS, Woods SC. Clarifying the roles of homeostasis and allostasis in physiological regulation. Psychol Rev. 2014;121(2):225-247.
- Morrison SF, Nakamura K. Central mechanisms for thermoregulation. Annu Rev Physiol. 2019;81:285-308.
- Mitchell D, et al. Revisiting concepts of thermal physiology: understanding negative feedback and set-point in mammals, birds, and lizards. Biol Rev Camb Philos Soc. 2025;100(3):1317-1346.
- Aten S, Lynch N, Saper CB, Machado NLS. A brain-body perspective on thermoregulatory adaptation. Curr Biol. 2025;35(20):R1016-R1028.
- Sullivan ZA, Dulac C. Sickness and the brain. Curr Biol. 2025;35(20):R973-R979.
- Hammel HT, et al. Temperature regulation by hypothalamic proportional control with an adjustable set point. J Appl Physiol. 1963;18:1146-1154.
- Hammel HT. Regulation of internal body temperature. Annu Rev Physiol. 1968;30:641-710.
- Sammons M, et al. Brain-body physiology: local, reflex, and central communication. Cell. 2024;187(21):5877-5890.
- Petzschner FH, et al. Computational models of interoception and body regulation. Trends Neurosci. 2021;44(1):63-76.
- O'Connor FG. Heat-related illnesses. Ann Intern Med. 2025;178(7):ITC97-ITC112.
- Barletta JF, et al. Society of Critical Care Medicine guidelines for the treatment of heat stroke. Crit Care Med. 2025;53(2):e490-e500.
- Bouchama A, et al. Classic and exertional heatstroke. Nat Rev Dis Primers. 2022;8(1):8.
- Machado NLS, et al. Preoptic EP3R neurons constitute a two-way switch for fever and torpor. Nature. 2025;644(8076):463-472.
- Osterhout JA, et al. A preoptic neuronal population controls fever and appetite during sickness. Nature. 2022;606(7916):937-944.
- Boltana S, et al. Behavioural fever is a synergic signal amplifying the innate immune response. Proc Biol Sci. 2013;280(1766):20131381.
- Boulant JA. Neuronal basis of Hammel's model for set-point thermoregulation. J Appl Physiol (1985). 2006;100(4):1347-1354.
- Cheng M, et al. Brainstem catecholaminergic neurons induce torpor during fasting by orchestrating cardiovascular and thermoregulation changes. Nat Commun. 2025;16(1):5954.
- Meng JJ, et al. Light modulates glucose metabolism by a retina-hypothalamus-brown adipose tissue axis. Cell. 2023;186(2):398-412.e17.
- Qian S, et al. A temperature-regulated circuit for feeding behavior. Nat Commun. 2022;13(1):4229.
- Feng C, et al. Cold-sensitive ventromedial hypothalamic neurons control homeostatic thermogenesis and social interaction-associated hyperthermia. Cell Metab. 2022;34(6):888-901.e5.
- Tan CL, Knight ZA. Regulation of body temperature by the nervous system. Neuron. 2018;98(1):31-48.
- Lazarus M, et al. EP3 prostaglandin receptors in the median preoptic nucleus are critical for fever responses. Nat Neurosci. 2007;10(9):1131-1133.
- Ushikubi F, et al. Impaired febrile response in mice lacking the prostaglandin E receptor subtype EP3. Nature. 1998;395(6699):281-284.
- Nakamura Y, et al. Prostaglandin EP3 receptor-expressing preoptic neurons bidirectionally control body temperature via tonic GABAergic signaling. Sci Adv. 2022;8(51):eadd5463.
- Koo TK, Li MY. A guideline of selecting and reporting intraclass correlation coefficients for reliability research. J Chiropr Med. 2016;15(2):155-163.
- Machado NLS, et al. EP3R-expressing glutamatergic preoptic neurons mediate inflammatory fever. J Neurosci. 2020;40(12):2573-2588.
- Hrvatin S, et al. Neurons that regulate mouse torpor. Nature. 2020;583(7814):115-121.
- Yu S, et al. Glutamatergic preoptic area neurons that express leptin receptors drive temperature-dependent body weight homeostasis. J Neurosci. 2016;36(18):5034-5046.
- Kataoka N, Hioki H, Kaneko T, Nakamura K. Psychological stress activates a dorsomedial hypothalamus-medullary raphe circuit driving brown adipose tissue thermogenesis and hyperthermia. Cell Metab. 2014;20(2):346-358.
- Su Z, et al. The DMH(GABA) neurons play a crucial role in the regulation of cold-induced white adipose browning through DMH to LPO projection. Adv Sci (Weinh). 2026;13(5):e08513.
- Jung S, et al. A forebrain neural substrate for behavioral thermoregulation. Neuron. 2022;110(2):266-279.e9.
- Zhao ZD, et al. A hypothalamic circuit that controls body temperature. Proc Natl Acad Sci U S A. 2017;114(8):2042-2047.
- Morrison SF, Sved AF, Passerin AM. GABA-mediated inhibition of raphe pallidus neurons regulates sympathetic outflow to brown adipose tissue. Am J Physiol. 1999;276(2):R290-R297.
- Tan CL, et al. Warm-sensitive neurons that control body temperature. Cell. 2016;167(1):47-59.e15.
- Kroeger D, et al. Galanin neurons in the ventrolateral preoptic area promote sleep and heat loss in mice. Nat Commun. 2018;9(1):4129.
- Ye H, et al. An estrogen-sensitive hypothalamus-midbrain neural circuit controls thermogenesis and physical activity. Sci Adv. 2022;8(3):eabk0185.
- Francois M, et al. Leptin receptor neurons in the dorsomedial hypothalamus require distinct neuronal subsets for thermogenesis and weight loss. Metabolism. 2025;163:156100.
- Rezai-Zadeh K, et al. Leptin receptor neurons in the dorsomedial hypothalamus are key regulators of energy expenditure and body weight, but not food intake. Mol Metab. 2014;3(7):681-693.
- Zhang Y, et al. Leptin-receptor-expressing neurons in the dorsomedial hypothalamus and median preoptic area regulate sympathetic brown adipose tissue circuits. J Neurosci. 2011;31(5):1873-1884.
- Hitrec T, et al. Activation of orexin-A (hypocretin-1) receptors in the raphe pallidus at different ambient temperatures in the rat: effects on thermoregulation, cardiovascular control, sleep, and feeding behavior. Front Neurosci. 2024;18:1458437.
- Tupone D, Madden CJ, Cano G, Morrison SF. An orexinergic projection from perifornical hypothalamus to raphe pallidus increases rat brown adipose tissue thermogenesis. J Neurosci. 2011;31(44):15944-15955.
Reprints and Permissions
This article has been published
Video Coming Soon