The impedance-based real-time cell analysis (RTCA) approach enables real-time, label-free quantification of virus-induced cytopathic effects, providing a rapid method to evaluate antiviral compounds and monoclonal antibodies through an integrated, software-driven assay workflow.
Method Article
A Label-Free, Real-Time Impedance-Based Method for High-Throughput Antiviral Screening
In This Article
Summary
Abstract
Impedance-based technologies provide a robust and objective means to quantify cytopathic effects (CPE) in cell culture monolayers, overcoming the limitations of traditional endpoint or visually subjective assays. Cytolytic viruses typically induce pronounced morphological changes and cell death in infected cultures, making impedance measurements, reflecting changes in cell adhesion, morphology, and viability, a sensitive and dynamic indicator of viral infection and progression. As a result, impedance-based readouts offer a powerful and efficient approach for evaluating the protective effects of antiviral interventions. This study presents a real-time, label-free screening platform that leverages advanced impedance measurement systems to monitor virus-induced CPE continuously. This approach enables rapid, quantitative assessment of antiviral efficacy for both small-molecule drugs and monoclonal antibodies, without additional labeling or staining steps. The protocol details the complete assay workflow, from cell seeding and viral infection to data acquisition and analysis. Furthermore, the system-integrated software, specifically tailored for virology applications, streamlines data processing and interpretation, facilitating the determination of monoclonal antibody neutralizing potency and antiviral compound activity.
Introduction
When confronted with the threat of a viral outbreak, vaccines and antiviral therapeutics represent the primary strategies for limiting viral transmission and treating infected patients1. Vaccines prevent infection by priming the immune system to recognize pathogens and provide proactive and long-term protection. Antiviral therapeutics have various uses depending on the drug's modality and design. Similar to vaccines, monoclonal antibodies can provide proactive, sustained protection (weeks to many months) and can also be used as a tool for post-exposure control. Both monoclonal antibodies and antiviral small-molecule therapeutics are used to treat established infections by directly targeting or inhibiting viral components, thereby reducing disease severity and serving as a reactive, short-term intervention.
The conventional approach for functionally assessing antiviral activity in biological systems is the virus reduction neutralization test (VRNT), which quantifies reductions in plaque formation in plaque reduction neutralization tests (PRNT), foci via immunostaining in focus reduction neutralization test (FRNT), or cytopathic effects (CPE) using cell viability–based assays. The PRNT is considered the gold standard phenotypic method for determining the inhibitory activity of antiviral agents against a wide range of viral infections2. However, PRNT is time-consuming and labor-intensive, and interpreting the results can be subjective, particularly when plaque overgrowth or fusion occurs during prolonged incubation. The objectivity of assay readouts can be improved using FRNT, which relies on the detection of virus-specific antigens or reporter gene expression. However, this approach may be limited by the availability and performance of high-quality antibodies or detection enzymes. Several reagents and assay protocols are well-established and widely used for cell viability assessment, measuring certain aspects of CPE. Enzymatic reduction of the mono-tetrazolium salt MTT colorimetric reagent (3-(4,5-dimethylthiazol-2-yl)-2,5-diphenyl-2H-tetrazolium bromide) by mitochondrial dehydrogenases in living cells produces a quantifiable colorimetric signal caused by the colored formazan product. The viability assay reagent (which lyses cells and releases intracellular ATP that drives a luciferase-catalyzed reaction, converting the substrate luciferin into oxyluciferin) is a homogeneous luminescent assay. Such cell viability assays can be employed to quantify the decrease in CPE during antiviral agent screening3. However, these methods also require multiple washing and staining steps and, like PRNT and FRNT assays, are endpoint assays. As a result, partially effective antiviral agents that exert delayed effects on viral infection may be overlooked if the antiviral assay is terminated at a suboptimal time point. Therefore, there is a strong need for an automated, mid- to high-throughput assay that enables real-time monitoring of cellular responses to viral infections.
Real-time cell analysis (RTCA) systems enable continuous monitoring of CPE development and antiviral responses in permissive cell models through a label-free, noninvasive impedance-based readout. Virus-induced CPE includes not only cell death but also alterations in cellular morphology and adhesion, all of which can be sensitively detected by changes in electrical impedance4,5. These impedance measurements are obtained using gold microelectrode sensors embedded in a specialized 96-well cell culture plate, allowing quantitative assessment of dynamic cellular responses without the need for labels or reporter gene expression. RTCA technology has been widely reported for CPE detection across various cell models infected with viruses from multiple families, and for the evaluation of antibody neutralizing activity6–10.
Here, the critical steps of this real-time and label-free impedance-based in vitro antiviral assay were defined. This approach was informed by the previous studies involving the screening of antiviral compounds in adenovirus 5–infected HEK293A cells and the evaluation of neutralizing antibodies using a replication-competent recombinant vesicular stomatitis virus expressing the Lassa glycoprotein (rVSV-LASV(Lin IV)) in Vero CCL-81 cells11. All these experiments were performed on an RTCA MP system, which supports running up to 6× 96-well plates simultaneously. The goal of this work was to establish a foundation for impedance-based antiviral screening. The method can be readily extended to a broad range of virus–cell models once optimal assay conditions have been defined using the protocol described here.
Protocol
The reagents and the equipment used are listed in the Table of Materials.
1. Permissive cell culturing and passaging
NOTE: In this protocol, Vero CCL-81 cells are used for antibody neutralization, whereas HEK293A cells are used for antiviral compound screening. To reduce variation across experiments, it is highly recommended to make a cell bank of permissive cells at the same passage for the assay.
- Prewarm the cell growth medium—Dulbecco’s Modified Eagle Medium (DMEM) supplemented with 10% fetal bovine serum (FBS) and 1% penicillin–streptomycin—in a 37°C water bath before use.
- Thaw a vial of cryopreserved permissive cells in a 37°C water bath until only a small piece of ice crystal remains; do not submerge the cap in the water bath.
- Place the vial containing revived cells into the biosafety cabinet (BSC) after wiping the exterior with 70% ethanol.
- Gently transfer the cells to a new 50 mL conical tube and dropwise add 9 mL of warm growth medium to the cells. Mix gently.
- Spin down the cell suspension at 200 × g for 5 min at room temperature (RT).
- Transfer the resuspended cells in 5 mL of prewarmed growth medium to a new T-25 flask.
- Grow cells to 80%–90% confluency in a 37°C incubator with 5% CO2 before the next cell subculture.
- Passage the cells.
- Aspirate the medium and gently wash the cell monolayer twice with 3 mL of 1× calcium- and magnesium-free Phosphate-Buffered Saline (PBS) to remove residual growth medium.
- Add 2 mL of 0.25% trypsin-EDTA to the flask to cover the cells.
- After 2–5 min of incubation at 37°C, neutralize the trypsin by adding a 5-fold volume of prewarmed growth medium.
- Resuspend cells by gently pipetting the cell suspension up and down against the side of the flask.
- Seed the cells at the desired cell seeding density or split ratio with fresh medium.
NOTE: The desired cell seeding density is determined empirically by cell growth rate, passage frequency, and target confluency at the time of passaging. For example, seeding Vero CCL-81 cells at a minimum of 0.4 × 10⁴ cells/cm2 allows cells to be passaged every 3 days before they reach 90% confluency.
2. Antiviral agent screening
NOTE: Figure 1 illustrates the workflow of the impedance-based antiviral screening assay. Briefly, permissive cells are seeded into microelectrode-integrated 96-well microplates, and cell performance is monitored for approximately 24 h before the assay. For antibody neutralization tests, viruses at a fixed multiplicity of infection (MOI) are mixed with antibodies and preincubated for 1 h before being added to the cells. In contrast, for antiviral compound screening, viruses at a fixed MOI and compounds are added to the cells simultaneously. Virus-induced CPE is continuously monitored using impedance-based readouts, and data analysis can be performed either during the assay or after its completion.
- Day 0: Measure plate background and seed permissive cells
- To start an experiment, open the instrument software (RTCA Pro) and select the desired cradle for the assay. Next, choose the Virology module before initiating the experiment.
- Enter any relevant notes in the Exp Notes tab (e.g., Experiment Name, Device SN, Device Type, or other pertinent details). These fields are optional and may be left blank if not applicable.
- Navigate to the Layout tab and define the wells used in the experiment. If certain wells will not be used, select the unused wells, right-click within the plate layout interface, and select Turn Off Well(s) from the dropdown menu to exclude them from the assay.
- Measurement of the microelectrode-integrated 96-well microplate background
- Dispense 50 µL of assay medium to each well of the plate using a multichannel pipette in reverse pipetting mode to minimize bubble formation.
NOTE: The assay medium selection should be optimized before screening to minimize interference with assay sensitivity and to ensure accurate assessment of treatment efficacy. For example, antibody neutralization assays were performed in DMEM containing 2% FBS and 1% penicillin–streptomycin, whereas antiviral compound screening assays used cell growth medium, DMEM containing 10% FBS and 1% penicillin–streptomycin. - Place the plate into the instrument cradle located inside a 37 °C incubator with 5% CO2. Ensure that the plate is oriented correctly with well A1 positioned as indicated. Next, check the Message tab for any error notifications.
NOTE: Each time the plate is placed into the cradle, verify that the message ‘‘Plate scanned. Connections okay’’ is displayed. If an error occurs, remove the plate and reseat it in the cradle. - Navigate to the Schedule tab; Step 1 appears by default, as it is a required step for plate background measurement. Click on the Start button to initiate recording from the wells. The step automatically concludes after a single background impedance measurement has been recorded.
NOTE: This background step must be performed before each experiment. All wells used in the experiment should contain assay medium only (i.e., before cell seeding).
- Dispense 50 µL of assay medium to each well of the plate using a multichannel pipette in reverse pipetting mode to minimize bubble formation.
- Permissive cell seeding to the microelectrode-integrated 96-well plate
- Trypsinize the permissive cells in the T25 flask following the steps described in the permissive cell passaging section.
- Count the cells resuspended in the assay medium and perform the following calculations:
- Calculate the total number of viable cells in the suspension using the viable cell density: Total viable cells = viable cell density × suspension volume
- Adjust the cell suspension to a final density (e.g., 0.30–0.35 × 10⁶ cells/mL for Vero CCL-81, equivalent to approximately 15,000–18,000 cells per 50 µL, or 0.12 × 10⁶ cells/mL for HEK293A, equivalent to 6,000 cells per 50 µL).
NOTE: These seeding densities were previously determined to be optimal for each virus–cell model. Proper cell seeding density is essential, as using too many or too few cells could affect assay sensitivity.
- Remove the microplate containing 50 µL of assay medium from the instrument and transfer it to the BSC for cell seeding.
- Dispense 50 µL of the cell suspension to each well of the plate using a multichannel pipette in reverse pipetting mode to minimize bubble formation, bringing the final volume of each well to 100 µL.
- After cell addition, leave the plate in the BSC at RT for 30 min to allow even distribution of cells on the bottom of each well.
- Return the plate to the instrument cradle located inside a 37 °C incubator with 5% CO2.
NOTE: If multiple plates are used, label each plate clearly and ensure that it is returned to the same cradle used during the background measurement. - Navigate to the Layout tab and open the Cell subtab. Select the appropriate wells, enter the permissive cell Name and Number, and click on Apply to save the information. Cell information may also be entered into or updated at any point during the experiment.
- Add Step 2 on the Schedule tab using the default recording settings (100 sweeps and a 15‑min interval), then click on Start to initiate continuous overnight monitoring of cell attachment and proliferation.
NOTE: This step serves as a cell quality control (QC) measure before virus inoculation. As the Cell Index (CI) reflects cell attachment and proliferation, CI values obtained during the 18–24‑h post‑seeding period are used as a key QC metric. Reproducible cell behavior across experiments is essential for optimal assay reproducibility. Notably, both CI amplitude and kinetic profiles are cell‑type specific. For example, after overnight culture, healthy Vero CCL-81 cells seeded at 18,000 cells/well typically exhibit a Cell Index of 6–8, whereas healthy HEK293A cells seeded at 6,000 cells/well generally exhibit a Cell Index of 0.8–1.2.
- Day 1: Impedance-based antiviral agent screening
NOTE: Before conducting the screening assay, the virus should be appropriately titrated to determine the optimal working dilution. This step establishes a virus concentration that supports robust, reproducible assay performance while meeting user-defined requirements, such as the desired assay duration. For example, in the antibody neutralization protocol11, a multiplicity of infection (MOI) of 0.01 was chosen for the neutralization assay, as it produced complete (100%) CPE within 40 h post-inoculation. In the impedance-based assay, complete CPE is indicated by a reduction of the Cell Index or Normalized Cell Index to zero. During antiviral compound screening, an MOI of 1 was used, and 100% CPE was observed within 70 h post-inoculation. The viral titration protocol followed established procedures described in a prior report12. If infectious viruses are used in the assay, ensure all applicable safety precautions are followed. Refer to the safety guidance for infectious virus handling section.- Prepare the virus at the predetermined concentration and prepare serial dilutions of the antibody or antiviral compound in assay medium.
- For monoclonal antibody neutralization assays, mix 60 µL of virus at 4× the final assay concentration with 60 µL of antibody at 4× the final assay concentration and incubate at 37 °C for 1 h before addition to the permissive cells. Following mixing, the virus and antibody are present at 2× their final assay concentrations. In contrast, no virus–compound preincubation is required for antiviral compound screening assays.
- Navigate to the Layout tab and select the Treatment subtab to enter treatment information on antiviral agents in the appropriate wells.
- Select the wells for the same treatment, then enter the Name of the agents and enter the starting Dilution or Concentration. For example, if the starting concentration is 10 µg/mL, enter 10 and select µg/mL as the “Unit”. Enter 3 as the Dilution Factor and specify the Direction of dilution (e.g., Top to Bottom).
NOTE: After clicking on Apply, the antiviral agent concentrations or dilutions will be automatically calculated and saved based on the plate layout input and displayed in the corresponding wells. The calculated values are also saved for subsequent data analysis. Entering virus information (e.g., Name and Dilution) is optional, as the assay uses a single fixed MOI for all virus-treated wells. - Assign virus-only-treated wells as positive controls by selecting the appropriate wells and choosing Positive ctrl under Well Type.
- Assign uninfected wells as negative controls by following the step described above and checking Negative ctrl under Well Type.
NOTE: Correct assignment of virus-only and uninfected wells as Positive ctrl and Negative ctrl, respectively, using the Well Type setting is critical, as the CI values from these wells are used in all neutralization-related calculations (e.g., %Neutralization). For CPE-related calculations (e.g., %CPE), explicitly designated negative-control wells are required. For antibody neutralization assays, inclusion of both positive and negative control antibodies on the same plate is strongly recommended to ensure accurate data interpretation. However, these control antibodies should be designated as Samples under Well Type. - When the assay is ready for antiviral agent addition, press the Abort Current Step button to skip the remaining sweeps in Step 2 and proceed to the next step.
- Click on the Unlock Plate button, then remove the plate from the cradle and place it in the BSC.
- Gently dispense 100 µL of the virus–antibody mixture or virus–antiviral compound mixture into each well using a multichannel pipette, resulting in a final well volume of 200 µL. The inoculum contains virus and antibody or antiviral compound at 2× their final assay concentrations, which are diluted to the final working concentrations upon addition to the cells.
- After returning the plate to the cradle, navigate to the Schedule tab and add Step 3. Specify the number of Sweeps and the Interval between sweeps. Ensure that the total sweep duration (number of sweeps × interval) exceeds the expected treatment duration. Click on Start to resume data acquisition and continue the assay.
NOTE: Designating a separate step (e.g., Step 3) following antiviral agent addition facilitates easy identification of the post-treatment monitoring period. Always program each step (except Step 1) to run longer than the expected assay duration. If the programmed run time is reached, the instrument will stop acquiring measurements, resulting in missing data points.
- Day 1 and beyond: Data analysis
- To review the real-time recording and/or analysis of cellular responses during data acquisition, navigate to the Data Analysis tab, select a specific time point or time interval, and then select and add the wells to be included in the analysis for display on the plot chart.
- Select parameters from the Y-axis dropdown menu. When Normalized Cell Index (NCI) is selected, specify the Normalization Time, the time point immediately before treatment, from the time dropdown list. %CPE or %Neutralization can also be displayed by selecting the corresponding option from the Y-axis dropdown menu.
NOTE: The instrument uses a unitless parameter, Cell Index (CI), to represent impedance. The Normalized Cell Index (NCI) is recommended for evaluating treatment differences while minimizing the impact of inherent well‑to‑well variation. - Navigate to the Parameter section on the Data Analysis tab to calculate and generate different types of figures, such as a bar graph and 4-parameter logistic (4PL, variable slope) regression dose–response curves at a specific time point (e.g., at the midpoint or endpoint of the assay). Alternatively, the IC₅₀ derived from the area under the curve (AUC) of the Cell Index or Normalized Cell Index after treatment provides a measure of the overall dose–response of antiviral agents throughout the treatment period.
- At the end of the test, click on Pause, then press the Unlock Plate button. Remove the plate from the cradle and electronically Release it via the Plate menu.
3. Safety guidance for infectious virus handling
- Wear proper PPE through double gloving, a face shield, and a lab coat. This is strongly recommended for handling viruses.
- Handle the virus-containing materials and add to plates exclusively inside an operating BSC.
- Transport the virus vials and any plates containing viruses to and from the BSC inside a sealed biosafety carrier.
- Before and after handling virus-containing materials in the BSC, thoroughly spray all interior surfaces with a disinfectant and allow a 5 min contact time to ensure complete viral inactivation. Wipe the surfaces clean and then disinfect them with 70% ethanol to remove any residual disinfectant.
- Upon completion of the impedance-based antiviral screening assay, remove all plates from the instrument and transport them with a sealed biosafety carrier directly into a clean BSC.
- Prepare a fresh 20% bleach solution and add to every well on the assay plates. Allow the bleach to sit for 10 min before aspirating from all wells and disposing of the plates.
- Decontaminate all assay plates, serological pipettes, pipette tips, tubes, and other disposable plastics that may have come into contact with the virus with bleach, and dispose of them in designated biohazard waste bags.
- Spray non-disposable plastics, such as tube racks and pipettes with a disinfectant and wipe them.
Results
Label‑Free, real‑time impedance readout reveals virus‑Induced CPE and antiviral protection
As shown in Figure 2A, HEK293A host cells were seeded into a microelectrode-integrated 96-well plate at a density of 6,000 cells per well13. After a 24‑h incubation, adenovirus type 5 was added at an MOI of 1 in the presence or absence of antiviral compounds. Cellular responses to viral infection and antiviral treatment were continuously monitored using real‑time, label‑free impedance measurements. In the absence of the virus, cells proliferated continuously over the 80‑h monitoring period, reaching confluence as indicated by a steady increase in impedance followed by a plateau. Adenovirus infection initially permitted cell growth for approximately 20 h, after which a pronounced CPE was observed, resulting in a rapid decline of the impedance signal to baseline by approximately 65 h post‑infection. Treatment with stavudine (50 µM) or ribavirin (20 µM) had minimal impact on virus‑induced CPE, with impedance traces closely resembling those of virus‑only infected cells. Ganciclovir (50 µM) exhibited modest antiviral activity, evidenced by a partial recovery of the Normalized Cell Index. In contrast, cidofovir (50 µM) and brincidofovir (1 µM) markedly attenuated CPE, producing impedance profiles comparable to those observed in uninfected negative control cells. Notably, none of the compounds significantly affected the Cell Index compared to the vehicle-treated controls at the tested concentrations in preliminary studies (data not shown).
In an impedance-based antibody neutralization assay, Vero CCL-81cells were seeded at a density of 18,000 cells per well on the microelectrode-integrated 96-well plate and cultured for 24 h before infection. On the day of the assay, monoclonal antibodies were preincubated with rVSV–LASV at an MOI of 0.01 for 1 h before addition to the cells. Distinct neutralization profiles were observed across the tested monoclonal antibodies (mAbs). For clarity, Figure 2B presents representative results from antibodies exhibiting potent, partial, or no neutralizing activity. Non-neutralizing antibodies induced full CPE, with impedance traces overlapping those of virus-only controls. Antibodies with intermediate neutralizing activity partially reduced virus-induced cytotoxicity, resulting in diminished but detectable CPE. In contrast, fully neutralizing antibodies completely inhibited CPE, maintaining impedance signals comparable to uninfected cell controls. Together, these impedance profiles enabled clear differentiation between non-neutralizing, partially neutralizing, and fully neutralizing monoclonal antibodies.
Quantification and characterization of antiviral activity
Having demonstrated the ability of the impedance-based RTCA assay to identify “hits” from a library of drugs and mAbs, the study next sought to characterize the efficacy of the lead compounds and antibodies. Progressively increasing the concentration of the antiviral drug brincidofovir from 15.6 nM to 1,000 nM results in a stepwise increase in the impedance signal; the higher the drug concentration, the more cells behave like the uninfected control (Figure 3A). Additionally, treatment with brincidofovir alone resulted in a marginal increase in NCI only at the highest concentration tested (1100 nM). However, at concentrations below 1100 nM, NCI moderately decreased, although the effect was not dose-dependent. This result indicates that the recovery of the Cell Index was attributable solely to the antiviral activity of the drug rather than to any direct enhancement of cell proliferation or attachment (Figure 3B). Plotting the area under the Normalized Cell Index (AUC) as a function of brincidofovir concentration yields the dose-response curve, which provides an excellent fit (R2 of 0.99) and indicates an IC50 of 265 nM (Figure 3C). In the antibody neutralization assay, at the end of the assay (approximately 50 h post-treatment), the system software automatically calculated the neutralization percentages at each mAb concentration, and IC50 values were subsequently derived. As shown in Figure 3D, in contrast to the negative control antibody rANDV-5, the other three mAbs, r37.2D, r25.1C, and r12.1F, demonstrated high antiviral potency, with IC₅₀ values of 4,315 ng/mL, 83 ng/mL, or 232 ng/mL, respectively14,15.
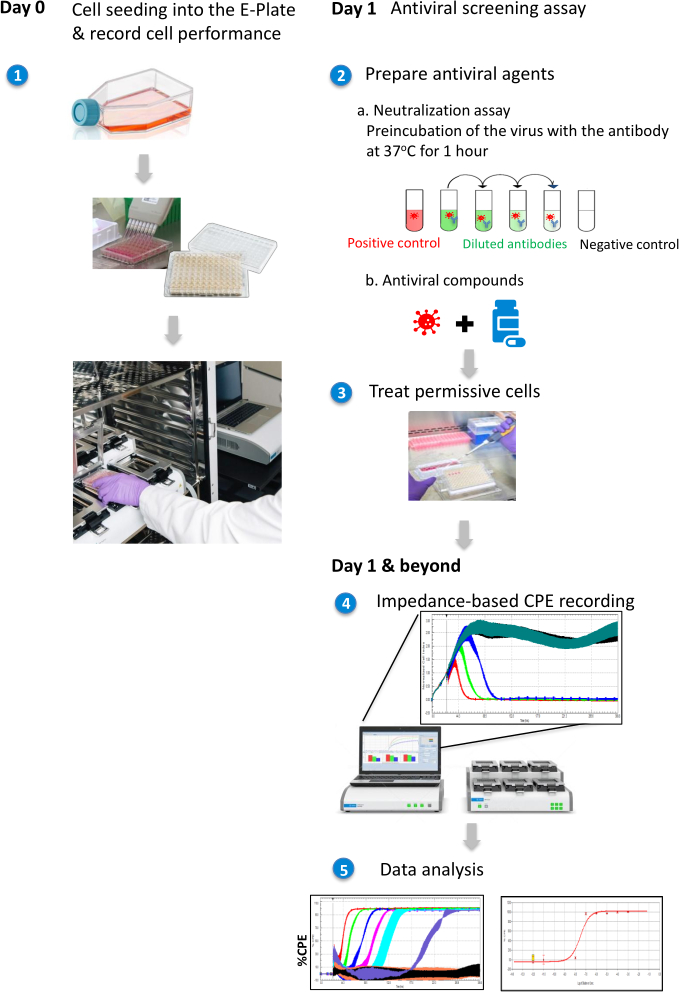
Figure 1: Schematic illustration of the workflow for the impedance-based antiviral screening assay. Day 0, Step 1: Permissive cells were seeded into microplates, and cell growth was monitored in the instrument cradle located in a 37 °C incubator with 5% CO2 for approximately 24 h. Day 1, Step 2: The virus was prepared at a fixed MOI and serial dilutions of antiviral agents. For antibody neutralization assays, the virus was preincubated with antibodies at 37 °C for 1 h before adding the mixture to the cells. Step 3: Virus-antiviral agent mixtures were added to the cells. Day 1 and thereafter, Step 4: The virus-induced CPE was continuously monitored using impedance-based measurements over several days. Step 5: The data was analyzed in real time or after assay completion. Please click here to view a larger version of this figure.
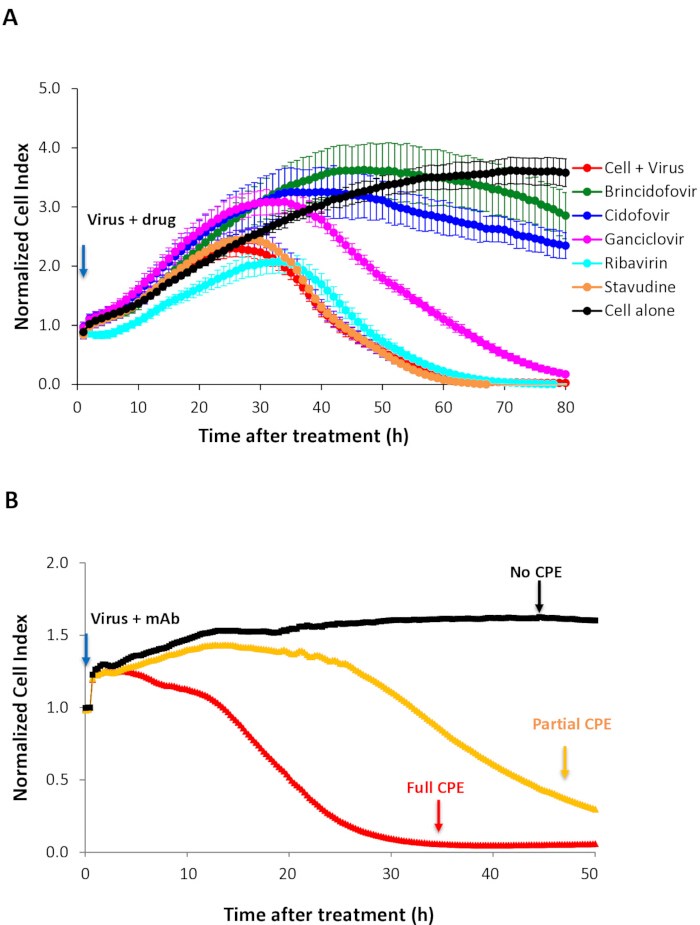
Figure 2: Real-time monitoring of antiviral activity using impedance-based Cell Index measurements. (A) Antiviral drug screening assessed by impedance analysis. All compounds were tested at 50 µM, except for ribavirin (20 µM) and brincidofovir (1 µM) in the presence of adenovirus type 5 at an MOI of 1. Data are presented as mean ± SD from three replicate wells. The figure is adapted from Zhang et al.13. (B) Impedance-based monoclonal antibody neutralization assay. Representative Cell Index profiles are shown for monoclonal antibodies exhibiting no neutralization (full CPE, red), partial neutralization (partial CPE, orange), or potent neutralization (no detectable CPE, black). Please click here to view a larger version of this figure.
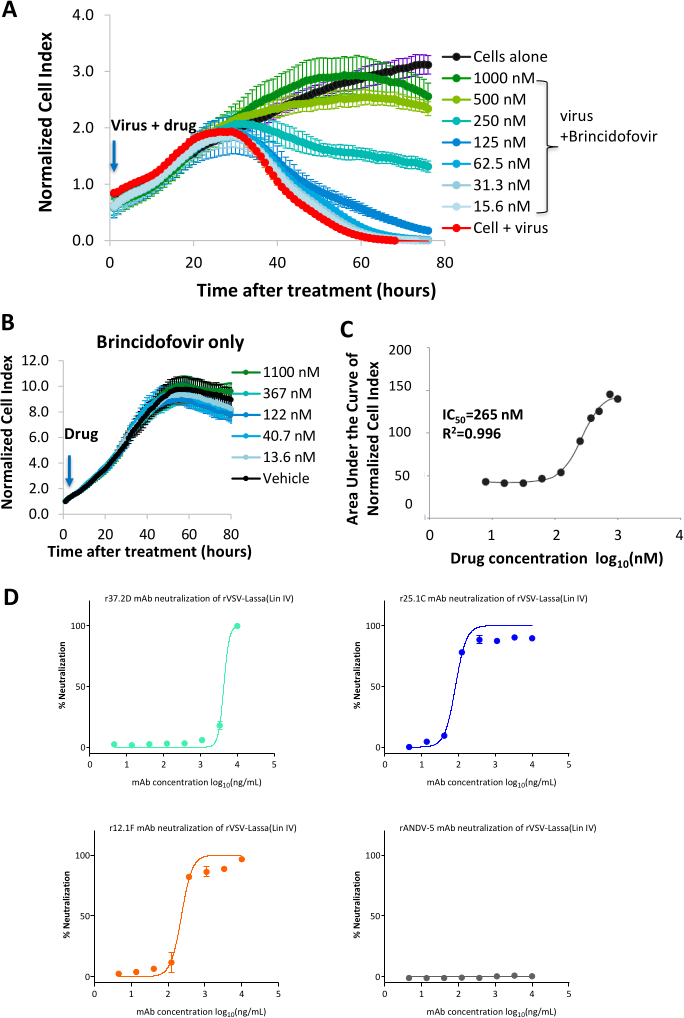
Figure 3: Quantification of antiviral activity using impedance. (A) Dynamic changes of the real-time Normalized Cell Index following treatment with increasing concentrations of brincidofovir in combination with adenovirus type 5 infection at an MOI of 1. (B) Dynamic changes of the real-time Normalized Cell Index following treatment with increasing concentrations of brincidofovir alone. (C) The area under the impedance traces was plotted as a function of brincidofovir to yield a dose-response curve. (A) and (C) are adapted from Zhang et al.13. (D) Representative rVSV–LASV Lineage IV (Josiah) neutralization curves for monoclonal antibodies r37.2D, r25.1C, r12.1F, and rANDV-5 included as a negative control. Monoclonal antibodies 37.2D, 25.1C, 12.1F, and ANDV-5 were produced recombinantly based on existing literature (see Results section). The data shown are representative curves from two independent experiments and are reported as the mean ± SD from three replicate wells. Please click here to view a larger version of this figure.
Discussion
Like all cell-based assays, the RTCA antiviral screening assay requires optimization for each virus–cell system. Because the assay detects virus-induced CPE through impedance changes, it depends on a permissive cell model that supports viral replication and measurable CPE. Viruses that do not generate impedance-detectable CPE may not be suitable for this approach; in such cases, alternative methods such as FRNT may be used when virus-specific antibodies are available. Another important consideration is that changes in Cell Index are not exclusively caused by virus-induced cytolysis. Alterations in cell morphology, adhesion, proliferation, and attachment can also influence impedance signals and potentially confound the assessment of antiviral activity. Therefore, the effects of antiviral agents on Cell Index should be evaluated in preliminary studies or through appropriate agent-only controls. In the present study, to maximize the number of agents evaluated per plate, antiviral agent–only controls were tested before the screening assay to establish baseline effects of each candidate in the absence of viral infection. Assay performance is also influenced by factors such as cell seeding density, virus inoculation timing, and medium conditions, which can affect cell growth, viral replication, CPE development, and assay reproducibility7,10,16. Consequently, systematic optimization is essential for robust and reliable RTCA-based antiviral screening.
After optimal assay conditions have been established, successful implementation of impedance-based real-time antiviral assays requires consistent cell seeding, healthy cells, and stable assay conditions. High well-to-well variability is often caused by uneven cell distribution or inaccurate pipetting; therefore, cell suspensions should be mixed thoroughly before seeding, and plates should be left at RT for 30 min after seeding to promote uniform cell settling and reduce edge effects. A minimum of three replicates per treatment is recommended, while additional replicates for negative (non-infected) and positive (virus-only) controls are strongly encouraged, as these values serve as the reference points for %CPE and %Neutralization calculations across all treatment conditions. If virus-induced CPE is weak or inconsistent, verify the quality of the virus stock and the health of the permissive cell line. To maintain viral infectivity, avoid repeated freeze–thaw cycles by preparing single-use virus aliquots for each experiment. Finally, the use of a cell bank containing permissive cells at a consistent passage number is highly recommended to minimize experimental variability and improve assay reproducibility. If the Cell Index measured immediately before infection (typically approximately 24 h post-seeding) falls below the established benchmark for the permissive cell line, indicating suboptimal cell health or growth, the experiment should be discontinued. In such cases, a fresh vial of cryopreserved cells should be thawed, and the antiviral screening assay should be repeated.
When the antiviral screening assay is performed under well-controlled, optimized conditions, as demonstrated by the screening data presented here, the impedance-based assay can accurately quantify the real-time reduction of CPE by antiviral agents. In contrast to traditional approaches that rely on labor‑intensive endpoint measurements, the continuous and noninvasive impedance readout enables longitudinal monitoring of the full spectrum of virus‑induced cellular damage and the kinetic profiles of antiviral responses. This real‑time measurement capability facilitates identification of optimal temporal windows for detecting not only early‑acting but also delayed antiviral effects that conventional endpoint assays may miss.
Moreover, the RTCA protocol described here provides a faster and substantially simplified workflow for antiviral screening compared with traditional methods. The assay requires only an initial cell-seeding step followed by virus addition in the presence or absence of antiviral agents. No additional handling or post-assay processing is needed. Experimental setup and data analysis are further streamlined by the system’s customized Virology software module, which enables automated calculation of parameters commonly used in VRNT, including %CPE, %neutralization, and the highest dilution or lowest concentration of an antiviral agent that achieves a user-defined level of neutralization. Collectively, these advantages allow for rapid and parallel screening of many more assay conditions (drug comparisons, extended dilutions, etc.) than is typically possible using traditional methods.
Although the assay described here was developed in a 96‑well plate format, with the appropriate assay conditions described above, it can be adapted to a 384‑well plate format. To support this higher‑throughput, impedance‑based assay, an automated impedance-based RTCA system can be employed, which allows the simultaneous processing of up to four 384‑well plates.
Beyond antiviral screening, this RTCA method can be applied to combination therapy studies, serology, and investigations of viral immune escape. By measuring the ability of therapeutic antibodies or immune sera to prevent virus-induced CPE, the assay provides a label-free, real-time assessment of neutralizing activity and protective immune responses following infection or vaccination. In addition, comparing neutralization profiles across viral variants can reveal changes in susceptibility associated with immune escape. When combined with genomic sequencing, this approach may facilitate the identification of antibody-resistant variants and support the development of next-generation vaccines, antibody therapeutics, and antiviral strategies.
Disclosures
J.E.C. has consulted for Moderna and Merck, is the founder of IDBiologics, and receives royalties from UpToDate. The laboratory of J.E.C. received unrelated sponsored research agreements from IDBiologics during the study's conduct.
Acknowledgements
This work was supported in part by grants U19 AI181979 and U19AI181930 from the National Institute of Allergy and Infectious Diseases (NIAID) of the US National Institutes of Health.
Materials
| Name | Company | Catalog Number | Comments |
|---|---|---|---|
| Adenovirus-GFP | Vector Biolabs | 1060 | |
| Brincidofovir (CMX001) | AdooQ | A13326 | |
| CaviCide | Metrex | 13-5024 | disinfectant |
| Cidofovir | Selleck | S1516 | |
| Dulbecco's Modified Eagle's Medium (DMEM) | ATCC | 30-2002 | |
| E-Plate 96 | Agilent | 5232368001 | microelectrode-integrated 96-well plate |
| Fetal bovine serum | Avantor | 97068-085 | |
| Ganciclovir Sodium | Selleck | S5065 | |
| HEK293A cell | Thermo Fisher Scientific | R70507 | |
| Multichannel Viaflo | INTEGRA | VIAFLO 96 | |
| Penicillin-Streptomycin solution | Gibco | 10378016 | |
| Phosphate buffer saline (1x) | HyClone | SH30256.01 | |
| Recombinant mAbs | Crowe Lab | N/A | |
| Ribavirin | Selleck | S2504 | |
| rVSV-LASV (Lin IV) | Crowe Lab | N/A | |
| Stavudine | Selleck | S1398 | |
| 0.25% Trypsin 0.53 mM EDTA (1x ) | ATCC | 30-2101 | |
| 12 Channel reagent reservoirs | VistaLab Technologies | 3054-1011 | |
| Vero CCL-81 | ATCC | CCL-81 | |
| Virology Module | Agilent | S2807-90089 | |
| xCELLigence RTCA MP system | Agilent | 380601040 |
References
- Pardi N, Weissman D. Development of vaccines and antivirals for combating viral pandemics. Nat Biomed Eng. 2020;4(12):1128-1133.
- Rocha VPC, Quadros HC, Fernandes AMS, Gonçalves LP, Badaró R, Soares MBP, et al. An overview of the conventional and novel methods employed for SARS-CoV-2 neutralizing antibody measurement. Viruses. 2023;15(7). doi:10.3390/v15071552.
- Chen CZ, Shinn P, Itkin Z, Eastman RT, Bostwick R, Rasmussen L, et al. Drug repurposing screen for compounds inhibiting the cytopathic effect of SARS-CoV-2. Front Pharmacol. 2021;11:592737.
- Giaever I, Keese CR. A morphological biosensor for mammalian cells. Nature. 1993;366(6455):591-592.
- Giaever I, Keese CR. Micromotion of mammalian cells measured electrically. Proc Natl Acad Sci U S A. 1991;88(17):7896-7900.
- Suryadevara N, Shrihari S, Gilchuk P, VanBlargan LA, Binshtein E, Zost SJ, et al. Neutralizing and protective human monoclonal antibodies recognizing the N-terminal domain of the SARS-CoV-2 spike protein. Cell. 2021;184(9):2316-2331.e15.
- Charretier C, Saulnier A, Benair L, Armanet C, Bassard I, Daulon S, et al. Robust real-time cell analysis method for determining viral infectious titers during development of a viral vaccine production process. J Virol Methods. 2018;252:57-64.
- Ebersohn K, Coetzee P, Venter EH. An improved method for determining virucidal efficacy of a chemical disinfectant using an electrical impedance assay. J Virol Methods. 2014;199:25-28.
- Marlina S, Shu MH, Abubakar S, Zandi K. Development of a real-time cell analysing (RTCA) method as a fast and accurate screen for the selection of chikungunya virus replication inhibitors. Parasit Vectors. 2015;8:240.
- Teng Z, Kuang X, Wang J, Zhang X. Real-time cell analysis—a new method for dynamic, quantitative measurement of infectious viruses and antiserum neutralizing activity. J Virol Methods. 2013;193(2):364-370.
- Suryadevara N, Gilchuk P, Zost SJ, Mittal N, Zhao LL, Crowe JE Jr, et al. Real-time cell analysis: a high-throughput approach for testing SARS-CoV-2 antibody neutralization and escape. STAR Protoc. 2022;3(2):101387.
- Zhang J, Abassi YA, Li N, Wang X, Zhang X. A streamlined, label-free real-time 50% tissue culture infectious dose (TCID50) assay using impedance for automated viral titer quantification. J Vis Exp. 2026;(227). doi:10.3791/73686.
- Zhang J, Giang C, Li N, Abassi YA, Lamarche BJ. Screening and characterizing antiviral drugs in real time using xCELLigence RTCA eSight's combination of impedance and imaging. Agilent Technologies; 2022.
- Engdahl TB, Kuzmina NA, Ronk AJ, Mire CE, Hyde MA, Kose N, et al. Broad and potently neutralizing monoclonal antibodies isolated from human survivors of New World hantavirus infection. Cell Rep. 2021;35(5):109086.
- Robinson JE, Hastie KM, Cross RW, Yenni RE, Elliott DH, Rouelle JA, et al. Most neutralizing human monoclonal antibodies target novel epitopes requiring both Lassa virus glycoprotein subunits. Nat Commun. 2016;7:11544.
- Piret J, Goyette N, Boivin G. Novel method based on real-time cell analysis for drug susceptibility testing of herpes simplex virus and human cytomegalovirus. J Clin Microbiol. 2016;54(8):2120-2127.
Reprints and Permissions
This article has been published
Video Coming Soon