本文介绍了中子自旋回波(NSE)研究脂质膜的样品制备、数据约化和数据分析的实验方案。通过对脂质进行合理的氘代标记,可探测介观尺度的膜动力学行为,这些尺度正是重要生命过程发生的时间和空间范围。
需要JoVE订阅才能观看此内容。 请登录或开始免费试用
本文内容
勘误通知
Important: There has been an erratum issued for this article. View Erratum Notice
摘要
摘要
脂质双分子层构成了细胞膜的主要基质,是营养物质交换、蛋白质-膜 相互作用以及病毒出芽等其他重要细胞过程的主要平台。为了实现高效的生物学活性,细胞膜必须具有足够的刚性以维持细胞及其区室的完整性,同时又需具备足够的流动性,以允许膜组分(如蛋白质和功能结构域)扩散并相互作用。这种弹性与流动性的精细平衡及其对生物学功能的影响,要求我们更深入地理解在介观尺度长度和时间范围内的集体膜动力学,例如膜形变和蛋白质结合事件。在能够有效探测这一动态范围的技术中,中子自旋回波(NSE)光谱技术是其中之一。结合氘标记技术,NSE可用于直接探测弯曲和厚度涨落,以及特定膜特征的介观动力学。本文简要描述了NSE技术,并概述了在脂质体膜上进行NSE实验的步骤,包括样品制备和氘化方案的详细信息,以及数据采集与归约的指导说明。本文还介绍了用于提取关键膜参数的数据分析方法,例如弯曲刚度模量、面积可压缩模量和平面内黏度。为了说明NSE研究的生物学意义,本文讨论了NSE探测膜现象的若干典型实例,即添加剂对膜弯曲刚度的影响、结构域形成对膜涨落的影响,以及膜-蛋白质相互作用的动力学特征。
引言
细胞膜及其功能的理解在过去几十年中取得了显著进展。过去认为细胞膜是被动的脂质双分子层,仅用于界定细胞边界并承载膜蛋白1 逐渐转变为一种动态模型,其中脂质双分子层在调控重要的生物过程(包括细胞信号传导、分子交换和蛋白质功能)中发挥着关键作用 — 仅举几例2,3,4,5,6细胞膜具有高度动态性,持续发生重塑和分子重分布,这一认识推动了科学界对膜结构的研究超越平衡态结构的探索7,8,9因此,已开发出多种方法用于研究生物及仿生脂质膜中的各种动态模式。迄今为止,大多数研究主要集中在分子的扩散运动上10,11,12,13 以及宏观形状涨落14,15,16,导致对中间尺度膜动力学的理解存在显著空白,即由数十至数百个脂质分子组成的脂质聚集体的集体涨落。这些动力学过程发生的长度尺度为几十至几百埃,时间尺度为亚纳秒至数百纳秒(参见 图1),这里称之为介观尺度。实际上,膜层面的关键生物活动正是发生在这些尺度上。17。这包括病毒出芽18通道门控19以及膜蛋白相互作用20还需要指出的是,膜蛋白的能量景观同样重要21,22 表明蛋白质的构象变化 — 发挥其调控作用所必需的 — 发生在纳秒时间尺度上23 集体膜波动的重要性,进一步强调了介观动力学在细胞膜及其仿生类似物生物学功能中的关键作用20本文聚焦于脂质膜的两种主要介观动态模式,即弯曲涨落和厚度涨落。
直接探测这些涨落模式的主要挑战在于,使用常规光谱学方法难以同时覆盖其空间和时间尺度。另一个挑战是,直接接触的技术可能会干扰其所要测量的涨落本身16。这一问题因生物膜在组成和结构上的复杂性而进一步加剧24,25,这种复杂性导致膜具有非均质的特征,包括脂质区域的形成26,27,28,29,30以及膜的不对称性31,32,33—因此需要选择性探针来理解不同膜特征的动力学行为。幸运的是,这些挑战可以通过非侵入性的中子散射技术(如中子自旋回波(NSE))加以克服,该方法天然地覆盖了所需的长度和时间尺度,并能够在不改变其物理化学环境的前提下,实现对特定膜特征的研究34。事实上,近年来NSE光谱技术已发展成为研究集体膜动力学的一种独特而强大的工具35。针对脂质膜的NSE研究结果,为脂质膜的力学36,37和黏弹性38,39特性提供了新的认识,并揭示了其在生物学功能中潜在作用的新线索40,41。
中子自旋回波(NSE)谱学技术基于一种干涉仪仪器设计,该设计最初由Mezei提出42,利用一系列自旋翻转器和磁线圈来控制中子通过仪器时其自旋的进动。该设计依赖于相对于样品位置对称分布的磁场元件(即磁镜结构)(图1A)。这意味着,当没有发生中子与样品之间的能量交换时,中子在仪器的前半段和后半段经历相同次数但方向相反的自旋进动(注意两个进动线圈之间有一个π翻转器)。因此,中子的最终自旋态相对于初始态保持不变——这一现象称为自旋回波(见图1A中透明的中子)。然而,当中子与样品发生能量交换时,这种相互作用会改变中子在仪器后半段的自旋进动次数,从而导致最终自旋态发生变化(见图1A)。实验上,这种变化表现为极化的损失,这一点将在本文后续部分展示。关于NSE技术的更多细节,读者可参考专门的技术文献42,43,44,45。
此处提供一个简化的描述,以粗略估计中子自旋回声(NSE)技术可达到的长度和时间尺度。长度尺度由可实现的波矢转移范围 Q = 4π sin θ/λ 决定,其中 2θ 为散射角,λ 为中子波长。可以看出,Q 取决于波长范围以及谱仪第二臂的旋转范围(见图1A)。典型的 NSE 谱仪 Q 范围约为 ~0.02–2 Å-146,47,近期升级后可达 ~0.01–4 Å-148,49,对应的空间尺度约为 ~1–600 Å。另一方面,可探测的时间尺度由中子在磁进动线圈内获得的总进动角(或相位)计算得出,其表达式为50: 。在此表达式中,t 是定义为
  的傅里叶时间,其中
  为中子的旋磁比,
 为线圈长度,
 为线圈磁场强度。值得指出的是,傅里叶时间是一个严格依赖于仪器几何结构、磁场强度和中子波长的量。例如,使用波长
  = 8 Å 的中子,并设置仪器参数为 = 1.2 m 和 = 0.4 T 时,计算得到的傅里叶时间为 t ~ 50 ns。实验上,通过调节进动线圈中的电流(即磁场强度)或使用不同的中子波长来调节傅里叶时间,从而使 NSE 典型的时间尺度达到 ~1 ps 至 100 ns。然而,近期 NSE 谱仪的升级已实现了更长的傅里叶时间,在 Heinz Maier-Leibnitz Zentrum 的 J-NSE-Phoenix 谱仪上可达约 400 ns51,在橡树岭国家实验室的 SNS-NSE 谱仪上也达到类似水平48,而在法国劳厄-朗之万研究所(Institut Laue-Langevin, ILL)的 IN15 NSE 谱仪上甚至可达约 1,000 ns49。
除了能够直接获取膜动力学的长度和时间尺度信息外,中子自旋回声(NSE)还具有固有的中子同位素敏感性52特别是中子与氢元素的不同同位素发生相互作用的能力——氢是生物系统中最丰富的元素——导致中子散射长度密度的差异,34 或NSLD(等效于光学折射率)50),当氕被氘取代时,可采用一种称为对比度调节的方法,该方法常用于突出特定的膜结构特征或掩盖其他部分 — 后一种情况被称为对比度匹配。对比度变化/匹配的一个常见应用是用水(NSLD = -0.56 × 10⁻⁶ Å-2)通过重水或D2O(NSLD = 6.4 × 10⁻⁶ Å-2)以放大来自含氢脂质膜的中子信号(NSLD ~ 0 × 10-6 Å-2)。该方法在膜结构研究中具有很高的有效性,因为D的穿透能力2O进入膜的头部区域可准确测定膜的厚度(参见 图2A,左侧面板)以及应用更复杂模型时不同脂质亚类的位置分布53,54本文重点介绍了一些利用对比度变化研究仿生膜中集体动力学及特定膜特征的实例。
本文通过中子自旋回声(NSE)技术对模型脂质膜和具有生物学意义的脂质膜体系开展研究的具体实例,展示了NSE在揭示膜的动力学和功能特性方面所提供的独特见解,尤其侧重于以脂质体悬浮液形式存在的自由-standing膜的介观尺度动力学。关于膜面内动力学的NSE测量,读者可参考专门针对掠入射中子自旋回声谱学(GINSES)55,56 的出版物以及其他关于取向多层脂质膜堆叠体系的研究57,58,59,60。
为简化起见,本文以一种被广泛研究的、能够形成相分离结构的脂质双分子层体系为例,说明三种不同的膜氘化方案,该体系由1,2-二肉豆蔻酰-sn-甘油-3-磷酸胆碱(DMPC)和1,2-二硬脂酰-sn-甘油-3-磷酸胆碱(DSPC)混合物构成61,62。这两种脂质的烃链长度存在差异(DMPC为每条链14个碳原子,DSPC为每条链18个碳原子),且其凝胶-流体相变温度也不同(Tm, DMPC = 23 °C,Tm, DSPC = 55 °C)。因此,在混合物上下相变温度之间的温度范围内,DMPC:DSPC膜会发生横向相分离63。本文所考虑的氘化方案旨在展示在脂质体膜的中子自旋回声(NSE)测量中可探测的不同动力学模式,即弯曲涨落、厚度涨落,以及横向相区的特异性弯曲/厚度涨落。所有脂质组成均基于摩尔分数为70:30的DMPC:DSPC双分子层,使用市售的全氢化和全氘化DMPC与DSPC变体。所有样品制备均以4 mL重水(D2O)中的脂质体悬浮液为基础,脂质浓度为50 mg/mL,每份样品总脂质质量为Mtot = 200 mg。
访问受限。请登录或开始试用以查看此内容。
方案
1. 实验所需的氘代方案
- 进行弯曲涨落测量时,需在D2O(D 99.9%)或D2O缓冲液(例如用D2O代替H2O配制的磷酸盐缓冲液)中制备完全质子化的脂质体。使用完全质子化的DMPC(C36H72NO8P)和DSPC(C44H88NO8P),其质量按
 计算为133.4 mg,其中XDMPC和XDSPC分别为DMPC和DSPC的摩尔分数,在此分别设为0.7和0.3,MwDMPC和MwDSPC分别为677.9 g/mol和790.1 g/mol。类似地,mDSPC = 66.6 mg。该氘化方案可增强膜(NSLD ~ 0 × 10-6 Å-2)与氘化缓冲液(NSLD ~ 6.4 × 10⁻⁶ Å-2)之间的散射对比度,从而放大来自膜波动的信号(见图2A左图)。
 - 为测量特定侧向膜结构(如相分离DMPC:DSPC膜中的基质动力学)的弯曲动力学,使用质子化的DMPC(C36H72NO8P)和全氘代的DSPC-d83(C44H5NO8PD83,Mw 873.7 g/mol),使得mDMPC = 128.8 mg,mDSPC-d83 = 71.2 mg。该氘化方案可最小化来自非目标DSPC富集区域的散射,从而实现对DMPC富集基质弯曲涨落的特异性测量(见图2B中图)。
注意:为确定特定对比度匹配方案所需的最优脂质氘化程度,可使用现有的基于网络的散射长度密度(SLD)计算器,例如美国国家标准与技术研究院中子研究中心(NIST Center for Neutron Research)开发的工具64。这些网络界面配备了用户友好的工具,便于轻松计算不同氘化程度脂质及其混合物的SLD。 - 对于平均膜厚度涨落的NSE测量(无侧向对比度),使用组分脂质的尾链氘代变体,即DMPC-d54(C36H18NO8PD54,732.3 g/mol)和DSPC-d70(C44H18NO8PD70,860.1 g/mol)35,38,使得mDMPC-d54 = 133.0 mg,mDSPC-d70 = 67.0 mg。该对比度方案(图2A右图)通过将尾链区域(NSLD ~ 6.4 × 10⁻⁶ Å-2)与氘化缓冲液匹配,使脂质头基区域(NSLD ~ 4.5 × 10⁻⁶ Å-2)的散射信号得到增强,从而可检测膜厚度的涨落。
- 对于特定膜区室(如DMPC富集基质)的厚度涨落研究,采用与步骤1.2相同的策略,将质子化的DMPC脂质替换为其尾链氘代类似物DMPC-d54,从而使DSPC富集区域与氘化缓冲液达到对比度匹配,主要散射信号来自尾链氘代的DMPC富集基质的头基区域。
2. 挤出用脂质悬浮液的制备
- 根据样品的组成,计算样品中各组分的质量。作为经验法则,对于含有多种分子组分的样品,其组分的质量由其摩尔质量 Mwi 乘以其摩尔分数 Xi 得到,并对所有组分进行归一化处理,即:
 其中 Mtot 为总质量,此处设为 200 mg。参见上述 DMPC-DSPC 脂质双层膜在不同氘化方案下的示例。
 - 使用数字半微量天平称取计算出的脂质质量(及其他样品组分,如蛋白质、纳米颗粒等),并将它们加入小瓶或圆底烧瓶中——请记得事先称量小瓶或烧瓶的质量。在通风橱内手动混合,加入 1 mL 溶剂以溶解所称量的组分。对于纯脂质样品,使用氯仿或乙醇;对于含有其他非脂质组分(如纳米颗粒)的样品,应选择一种能够分散所有组分的共用溶剂。
- 对于少量脂质(<10 mg),可先配制储备液,再用移液器将所需体积加入混合物中。
注意:不要加入过量溶剂,否则会显著延缓下文所述的溶剂干燥步骤。
- 对于少量脂质(<10 mg),可先配制储备液,再用移液器将所需体积加入混合物中。
- 在通风橱内,通过向小瓶中缓慢通入惰性气体(如氮气、氩气)并同时将小瓶倾斜缓慢旋转,使脂质溶液干燥。保持小瓶倾斜,以便在瓶壁上形成一层薄而均匀的干燥脂质膜,从而实现均匀干燥。间歇性地将小瓶置于 35 °C 水浴中,以避免因蒸发冷却导致溶剂蒸发速度减慢。
- 将小瓶置于约 35 °C 的真空烘箱中过夜,以彻底去除残留溶剂。对于不饱和脂质,应在抽真空后通入惰性气体,以尽量减少氧化。
- 为确保完全去除溶剂,在脂质干燥后称量小瓶质量,并确认其质量未超过所加入材料的已知总质量。可通过从干燥后的总质量中减去小瓶自身质量来验证。若存在多余质量,则继续在真空下干燥样品 6 小时。根据需要重复此过程。
- 用 4 mL D2O 或 D2O 缓冲液水合脂质膜,使脂质浓度达到 50 mg/mL。对于相变温度较高的脂质(如 DMPC-DSPC 混合物),应将缓冲液加热至相变温度以上(60 °C),以确保充分混合。
注意:由于中子自旋回声(NSE)实验需要相对较大的样品体积(约 4 mL),可考虑先用所需缓冲液的一半体积(即 2 mL)进行水合,以减少每个样品所需的挤出次数(见第 3 节)。在此情况下,剩余一半缓冲液可在挤出后加入。请注意,用于挤出的注射器容量限制为 1 mL,因此若使用 4 mL 缓冲液水合,则需进行四轮挤出操作。 - 涡旋振荡水合后的脂质溶液,直至脂质膜完全溶解且瓶壁上不再可见。此时,水合脂质形成多层囊泡及微米级的多层堆叠结构,悬浮液呈乳白色。
- 为促进脂质堆叠结构的破裂并降低多层性,将装有水合脂质溶液的小瓶置于实验室级冷冻机(优选 -80 °C 冷冻机)中,直至完全冻结,然后转移至 35 °C 水浴中,直至脂质溶液完全解冻,进行五次冻融循环。解冻后涡旋振荡至溶液均匀。重复该过程四次。
注意:也可通过将丙酮与干冰混合制备干冰浴,实现快速冷冻。
3. 水合脂质溶液的挤出
- 使用聚碳酸酯膜置于两个膜支撑件之间,并在每侧各添加两张滤纸,以提供额外支撑,组装挤出装置。选择孔径与目标脂质体尺寸相匹配的聚碳酸酯膜(NSE实验常用的孔径为50 nm和100 nm——通常,直径为100 nm的脂质体允许膜波动更少受限,但较小的50 nm脂质体可用于曲率研究)。在完成组装并拧紧外部挤出器外壳之前,确保聚碳酸酯膜已完全拉伸。
- 使用气密玻璃注射器将约0.3 mL的D2O或D2O缓冲液多次通过膜组件,以润湿聚碳酸酯膜。使用与样品制备过程中相同的缓冲液。静置至少10分钟,然后在引入样品前将缓冲液完全吸出。
- 用已制备的脂质溶液填充一支1 mL气密注射器,并插入挤出装置的一端。然后将一支空注射器插入另一端。当注射器连接至挤出组件后,将其放入挤出器块中。
- 如果挤出需要较高温度,例如对于具有高相变温度的饱和脂质(如DSPC,Tm = 55 °C),请将加热块置于加热板上或使用循环水浴(如图3A所示),将挤出器加热块预热至高于脂质相变温度(例如60 °C)。
注意:此步骤至关重要,以确保脂质均匀混合,并避免在挤出过程中施加过高压力而导致聚碳酸酯膜破裂。对于相变温度较低(<25 °C)的脂质样品,应在室温下进行挤出。 - 为挤出脂质溶液,将挤出装置连接至带有铝/钢框架的可编程注射泵(如图3A所示)。对于温度控制的挤出过程,使用带有流体通道的定制挤出底座,并连接至循环水浴。
- 根据制造商手册,编程注射泵执行15–20次挤出循环。挤出后,脂质溶液的颜色从乳白色变为透明的乳光蓝色(图3B、C),表明最终脂质体尺寸小于可见光波长,符合预期。对于如图3A所示类型的注射泵,请遵循以下步骤:
- 首先调整泵的设置。按住速率 按钮并输入挤出速率(50.99 mL/h),然后按下直径 按钮并输入注射器直径(4.606 mm)。使用屏幕上每个数字下方的向上箭头来更改该数字的值。
- 将装有样品注射器的挤出装置放置在右侧(见图3A)。按下抽取 按钮,直到抽取指示灯亮起。按下启动 按钮,等待样品被推入左侧(空)注射器中。
- 在样品(右侧)注射器即将完全排空前,按下停止 按钮。记录排出的体积,并用该值编程挤出循环。按住速率 按钮,直到屏幕上显示第一阶段(PH:01)。按下体积 按钮,输入之前记录的排出体积。在此阶段,确保抽取指示灯关闭——这将使样品朝正确方向排出。
- 再次按下速率 按钮,并使用最右侧的向上箭头进入第二阶段(PH:02)。按下体积按钮,输入与之前记录的排出体积相同的数值。在此阶段,按下抽取按钮,直到抽取 指示灯亮起——这将使样品向左排出。
- 为重复此循环,再次按下速率 按钮,并使用最右侧的向上箭头进入第三阶段(PH:03)。按下体积 按钮,直到屏幕上显示LP:SE,并将其设置为20。这是泵将执行的循环次数或重复次数。最后,按下速率 按钮,进入第四阶段(PH:04),然后按下体积 按钮,进入停止 功能。此时,泵已设置为自动挤出模式。
- 按下启动 按钮,开始挤出循环。
- 将含有挤出后脂质悬浮液的注射器排入洁净小瓶中,并准备储存或进行测量。对于高熔点温度的脂质样品,应将样品储存在高于其液相相变温度的条件下直至测量。否则,将样品保存在室温下。
- 切勿冷冻挤出后的样品,因为冷冻会导致囊泡破裂(悬浮液将再次变为乳白色)。
4. 样品的中子自旋回声测量及所收集数据的处理
- 在进行NSE实验之前,使用可及的方法对步骤3.7中制备的挤出脂质体样品进行表征,以确保样品质量合格。可用于评估NSE实验用脂质体悬浮液质量的潜在表征方法(如粒径分布、多层性、膜侧向结构等)已在讨论部分列出。
- 确定实验所需的 Q 范围及相应的仪器设置。对于脂双层弯曲刚性的测量,使用约 (0.04 - 0.2) Å 的 Q 范围。-1对于膜厚度涨落的研究,应使用约 (0.04 - 0.2) Å 的 Q 范围。-1 对应于膜的厚度35,66,67.
注意:在实验开始前,须与仪器科学家讨论实验设置。如前所述,对样品进行小角中子散射(SANS)表征是必要的,尤其是在缺乏散射信号先验信息的情况下,例如在选择性氘代膜中。或者,可在中子自旋回声(NSE)仪器上对有限的Q范围进行静态(也称为衍射)测量,但需注意此类测量所需时间远长于SANS测量。 - 使用注射器或移液管,将挤出的脂质体悬浮液加入中子自旋回声(NSE)束线指定的样品池中。注意,标准的NSE样品池厚度包括1、2、3和4 mm。应选择合适的样品池厚度,以在优化散射信号的同时,使非相干背景信号保持在合理强度范围内。
注意:通常情况下,在氘代缓冲液中测定含质子化脂质体时,应使用光程为1或2 mm的样品池——使用更厚的样品池可能导致难以校正的多重散射效应。对于氘化程度较高的脂质体(例如尾部对比度匹配的脂质体,或具有单层质子化叶层的不对称脂质体),若样品量充足,可考虑使用更厚的样品池(例如3或4 mm光程),以提高计数统计性——但有时这可能因成本过高而受限。 - 为缓冲液制备一个相同的样品池。使用与脂质体悬浮液相同的缓冲液。对缓冲液进行测量是进行强度归一化和背景(BKG)校正所必需的。
- 将样品池放入NSE谱仪的样品架中,设定测量程序并采集回波数据。如果是首次使用NSE仪器,请与仪器科学家协商测量程序的设定。
- 执行数据处理所需的另外两组测量:分辨率(R)和传播(T)测量。
- 执行分辨率(R在弹性散射参考样品(如碳)上进行测量 — 在相同的设置下进行测试,即与样品和缓冲液测量相同的波矢量和傅里叶时间。
- 进行透射(T) 对样品和缓冲液进行测量,以计算透射中子束的强度(参见下文步骤4.9)。透射率计算公式为样品或缓冲液的中子计数与空白束(即样品位置为空时)中子计数的比值。
- 使用执行测量的NSE谱仪专用数据还原软件来处理所采集的数据。
注意:不同的光谱仪可能使用不同的软件或用户界面。以下是使用数据分析与可视化环境(DAVE)进行中子自旋回声(NSE)数据归约的示例68 为美国国家标准与技术研究院中子研究中心的NSE谱仪专门编写的软件。- 打开 DAVE 软件并选择 降低 NSE 数据 从数据缩减菜单中选择。将出现多个弹出窗口。
- 通过文件菜单中的“打开.echo文件”功能,上传不同Q值的数据文件。这些文件对应包含自旋回波信号的原始数据文件,文件名扩展名为.echo。文件上传完成后,将在可用数据集列表中显示。
- 右键单击所选文件,并根据其对应的测量类型进行命名,例如:样品、空白池(或缓冲液)或分辨率。
- 将探测器像素以 2 x 2 为一组进行合并,以提高信噪比 数据集 对所有文件应用相同的合并方式,即分辨率、晶胞和样品。
- 检查所有像素组的数据,并对信号较差的像素组进行掩膜处理(参见 图4B) 通过按压 m 键盘上的键。按下 输入 弹出窗口可用于将相同掩膜应用于所有傅里叶时间点或后续傅里叶时间点。在数据处理过程中的任意时刻,也可对单个像素应用掩膜。被掩膜的像素将显示为绿色。
- 确保所采集的数据为回波信号形式,即每个探测器像素上的相位电流呈余弦函数形式(参见 图4A).
注意:相电流与中子自旋的进动角成正比;因此,通常将相电流表示为相位角,如图所示 图4A对于脉冲源的测量,需对数据应用额外的飞行时间计算,以获得中子脉冲内作为入射中子波长函数的回波信号。 - 首先拟合分辨率文件。从已上传的文件列表中选择一个分辨率文件,右键点击该文件,然后选择 拟合运算:拟合回波(分辨率) 从弹出菜单中。
- 确保对回波信号的拟合得到一系列拟合参数,包括该参数, A,步骤4.8中所需。拟合将自动使用以下表达式进行。

此处,ζ 是回波信号的周期(即余弦函数的周期) 图4A),σ 是由入射中子束的平均波长和波长展宽决定的高斯包络的宽度, Φc 是相电流,且 Φ0 是取决于中子所经历的场路径的回波点50样品的物理信息被编码在振幅中, A,即公式(1)中余弦函数的
注意:高斯包络的宽度基于仪器科学家预先设定的数值,不应更改。其他参数为变量,需针对每个像素上的特定回波信号进行拟合。 - 通过单击每个像素来检查拟合结果,以显示相应的拟合参数、拟合质量以及拟合的均方偏差。要检查每个拟合参数在整个探测器范围内的误差,请选择 图像选项 然后选择感兴趣的拟合参数,这将生成一幅显示每个像素上该拟合参数值的图。在探测器图像上右键单击,将弹出一个窗口,显示所选拟合参数的误差棒图。
- 如果某个特定像素的拟合结果不理想(例如,拟合参数的误差棒较大),请对该像素的信号重新拟合。选择该 像素,按下 拟合 标签,然后按 像素拟合输入该阶段的新起始参数Φ0)和周期(ζ)在 拟合 切换以获得更满意的拟合效果。
注意:将拟合相位作为傅里叶时间的函数进行绘图是很有帮助的。为此,请进入主绘图窗口并选择 相位拟合法与傅里叶时间法该曲线应平滑且连续。检查该曲线中的不连续处,并重新拟合其所对应的像素。
- 通过从已上传并标注的文件列表中选择相应的文件,来减少样本或细胞文件。
- 检查所有像素,并按照步骤 4.7.5 中所述,对统计结果不良的像素进行掩膜处理。
- 右键单击文件,然后选择 拟合操作:导入相位(样品、细胞). 这将从分辨率文件中导入相位和应用的掩模。
- 使用之前针对分辨率文件所述的相同步骤(4.7.8–4.7.10)对回波信号进行拟合。在拟合样品文件和细胞文件时,不得更改从分辨率拟合中导入的周期和回波相位点数值。这些参数取决于仪器设置,不应随样品变化。
- 在进行数据约简之前,为所有数据文件输入光束中心。选择数据文件,然后进入 常规 输入 X 和 Y 方向的光束中心值。这些值在实验过程中记录。
- 拟合完样品、样品池和分辨率文件后,计算归一化的中间散射函数,以供后续数据分析与解释使用。为此,请在已拟合文件列表中右键单击待处理的样品文件,然后选择 计算 I(Q) 从弹出菜单中选择。随后将出现一个窗口,可输入分辨率和Cell(即缓冲液)文件,以及Q-arcs的数量(见步骤4.9)。输入所有必要信息后,按下 好的 按钮。结果将在新窗口中显示。
注意:根据以下公式进行数据归约,以获得归一化的中间散射函数69.

其中 t 是傅里叶时间, N向上 和 N向下 分别为非自旋翻转和自旋翻转构型下的中子计数(分别在π/2翻转器关闭、π翻转器关闭和开启的条件下测量),上标 BKG 和 R,分别对应于步骤 4.4 和 4.6 中定义的背景和分辨率测量。请注意光束偏振 因此,中子与样品之间因能量交换导致的自旋态变化被检测为极化度的下降(从1开始降低)。
- 最后,将探测器像素分组为 Q-如图所示的弧线 图4B 以获得 Q归一化中间散射函数的依赖性, S(Q,t) / S(Q,0)。这在技术上称为数据分箱,应谨慎进行,即需考虑样本的计数统计特性以及分组像素上数据的预期标准偏差。
- 对于强散射样品,在保持所得中间散射函数的误差棒合理的前提下,将探测器划分为更多的Q弧区域。 S(Q,t) / S(Q,0)。这将获得更多的Q数据点,对下文所述的数据分析过程至关重要。需注意,对于散射较弱的样品,过度合并数据会导致衰减信号质量下降,即误差棒显著增大 S(Q,t) / S(Q,0),这可能导致较大的不确定性。
5. 数据分析与解释
- 将上述数据约化得到的归一化中间散射函数 S(Q,t) / S(Q,0) 拟合为具有 2/3 拉伸指数的拉伸指数函数70。

注:此类拟合示例见图 5B。将 S(Q,t) / S(Q,0) 拟合至方程 (3) 可得到 Q 依赖的弛豫速率 Γ(Q)。 - 绘制 Γ(Q) 随 Q 的变化关系,并拟合至适当的模型以提取相关的膜参数。
访问受限。请登录或开始试用以查看此内容。
结果
通过中子自旋回声(NSE)研究膜弯曲涨落时,通常在约 (0.04 - 0.2) Å-1 的 Q 范围内进行。该 Q 范围对应于介于膜厚度与脂质体半径之间的中间长度尺度,此处弯曲动力学占主导地位。在更宽的 Q 范围内测量可揭示其他动态模式,包括脂质体扩散和膜内动力学。有关 NSE 可探测的膜动力学转变的更多细节,请参阅以下相关文献25,71。需要特别强调的是,NSE 信号与以下表达式成正比: ,其中 Icoh 和 Iinc 分别代表样品的相干散射强度和非相干散射强度。因此,建议将 NSE 脂质体样品制备在氘代缓冲液中(即使用 D2<...
访问受限。请登录或开始试用以查看此内容。
讨论
中子自旋回声(NSE)是一种在多种条件下测量脂质膜介观动力学的强大且独特的技术。NSE的有效应用取决于样品质量、中子对比度以及在给定样品中可探测的动力学范围。因此,要成功进行NSE实验并采集高质量数据,必须完成若干关键步骤。在NSE实验前,使用实验室常规方法对脂质体悬浮液进行表征,是确保中子束时间高效利用的关键步骤。例如,通过动态光散射(DLS)可测定挤出法制备的脂质体的粒径分布(或扩散系数),该方法在各实验室或共享平台中普遍可用84。冷冻电子显微镜是近年来在脂质体样品上得到验证的另一种表征方法,通过获取脂质体悬浮液冷冻超薄切片的高分辨率显微图像,可有效评估脂质体的单层结构65、结构域形成85,86,或添加剂(如纳米颗粒76和蛋白质87)的掺入情况。此外,小角X射线散射(SAXS)也可用于表征膜结构
访问受限。请登录或开始试用以查看此内容。
披露
作者声明无利益冲突,无可披露内容。
致谢
R. Ashkar 感谢 M. Nagao、L.-R. Stingaciu 和 P. Zolnierczuk 提供了许多有益的讨论,以及在他们各自束线上的中子自旋回波实验中给予的频繁协助。作者承认使用了美国国家标准与技术研究院(NIST)和美国橡树岭国家实验室(ORNL)的中子自旋回波谱仪。NIST 的中子自旋回波谱仪由高分辨率中子散射中心资助,该中心是美国国家标准与技术研究院与美国国家科学基金会根据协议号 DMR-1508249 建立的合作项目。ORNL 散裂中子源的中子自旋回波谱仪由美国能源部基础能源科学办公室下属的科学用户设施部门资助。橡树岭国家实验室由 UT-Battelle, LLC 根据美国能源部合同号 DE-AC05-00OR22725 进行管理。
访问受限。请登录或开始试用以查看此内容。
材料
| 姓名 | 公司 | 目录编号 | 评论 |
|---|---|---|---|
| 氯仿(生物技术级) | Sigma Aldrich | 496189 | 生物技术级,≥99.8%,含0.5-1.0%乙醇作为稳定剂 |
| 循环水浴锅 | Julabo | SE-12 | 带智能泵的加热循环器,可编程温度设置,并配有外部传感器接口用于测量与控制 |
| 氧化氘 | Cambridge Isotopes Laboratories | DLM-4 | 氘代水;重水(D2O)(D,99.9%) |
| 数字半微量天平 | Mettler Toledo | MS105 | 半微量天平,量程120 g,可读性0.01 mg,配备高分辨率称重传感器、符合人体工学的门设计以及移液器校验功能 |
| 乙醇(分子生物学级) | Sigma Aldrich | E7023 | 200 proof乙醇,适用于分子生物学应用 |
| 玻璃移液管 | VWR | 36360-536 | 一次性钠钙玻璃巴斯德移液管 |
| 玻璃小瓶 | Thermo Scientific | B7990-1 | 硼硅酸盐玻璃小瓶,配有PTFE/硅胶隔垫盖 |
| 实验室级冷冻柜 | Fisher Scientific | IU2886D | 超低温冷冻柜(-86 至 -50 °C),用于脂质和蛋白质的长期储存 |
| 脂质(部分氘代或全氘代) | Avanti Polar Lipids | 根据脂质种类而定 | 脂质可从Avanti公司购买粉末形式或氯仿溶液形式,可根据需要选择特定含量和氘代模式 |
| Millipore纯水器 | Millipore Sigma | ZRQSVP3US | Direct-Q® 3 UV纯水系统,内置紫外灯,可提供纯水和超纯水,降低有机物含量,适用于生物 应用 |
| 小型挤出器套装 | Avanti Polar Lipids | 610020 | 小型挤出器套装包括小型挤出器、加热模块、2支气密型注射器、2个O型圈、聚碳酸酯膜和滤膜支撑装置 |
| 快接接头 | Grainger | 2YDA1 和 2YDA7 | 按钮式管路接头,适用于QuickConnect水循环应用,例如高温囊泡挤出 |
| 注射泵 | SyringePump.com | New Era-1000 | 完全可编程注射泵,支持注入和回吸操作;可设置多达41个泵送阶段,调节泵送速率、分配体积和挤出循环次数 |
| 超声波清洗仪 | Fisher Scientific | CPX2800 | 温度可控的超声波清洗仪,具备可编程功能,适用于脱气和超声处理 |
| 真空烘箱 | Thermo Scientific | 3608 | 0.7立方英尺真空烘箱,内置高温限温器,防止过热 |
| 涡旋混合器 | Fisher Scientific | 02-215-414 | 可变转速模拟控制,支持低转速启动以实现温和振荡,或高速混合以实现样品的剧烈涡旋 |
参考文献
- Singer, S. J., Nicolson, G. L. The fluid mosaic model of the structure of cell membranes. Science. 175 (4023), 720-731 (1972).
- Andersen, O. S., Koeppe, R. E. Bilayer thickness and membrane protein function: an energetic perspective. Annual Review of Biophysics and Biomolecular Structure. 36, 107-130 (2007).
- Lundbæk, J. A., Collingwood, S. A., Ingólfsson, H. I., Kapoor, R., Andersen, O. S. Lipid bilayer regulation of membrane protein function: gramicidin channels as molecular force probes. Journal of The Royal Society Interface. 7 (44), 373-395 (2010).
- Bradley, R. P., Radhakrishnan, R. Curvature-undulation coupling as a basis for curvature sensing and generation in bilayer membranes. Proceedings of the National Academy of Sciences of the United States of America. 113 (35), 117-124 (2016).
- Perozo, E., Cortes, D. M., Sompornpisut, P., Kloda, A., Martinac, B. Open channel structure of MscL and the gating mechanism of mechanosensitive channels. Nature. 418 (6901), 942-948 (2002).
- Jensen, M. Ø, Mouritsen, O. G. Lipids do influence protein function-the hydrophobic matching hypothesis revisited. Biochimica et Biophysica Acta (BBA) - Biomembranes. 1666 (1-2), 205-226 (2004).
- Rajendran, L., Simons, K. Lipid rafts and membrane dynamics. Journal of Cell Science. 118 (6), 1099-1102 (2005).
- Katchalsky, A., Spangler, R. Dynamics of membrane processes. Quarterly Reviews of Biophysics. 1 (2), 127-175 (1968).
- Rheinstädter, M. C. Collective molecular dynamics in proteins and membranes (Review). Biointerphases. 3 (2), 83-90 (2008).
- Fujiwara, T., Ritchie, K., Murakoshi, H., Jacobson, K., Kusumi, A. Phospholipids undergo hop diffusion in compartmentalized cell membrane. The Journal of Cell Biology. 157 (6), 1071-1082 (2002).
- Hac, A. E., Seeger, H. M., Fidorra, M., Heimburg, T. Diffusion in two-component lipid membranes--a fluorescence correlation spectroscopy and monte carlo simulation study. Biophysical Journal. 88 (1), 317-333 (2005).
- Heinrich, M., Tian, A., Esposito, C., Baumgart, T. Dynamic sorting of lipids and proteins in membrane tubes with a moving phase boundary. Proceedings of the National Academy of Sciences of the United States of America. 107 (16), 7208-7213 (2010).
- Hormel, T. T., Kurihara, S. Q., Brennan, M. K., Wozniak, M. C., Parthasarathy, R. Measuring lipid membrane viscosity using rotational and translational probe diffusion. Physical Review Letters. 112 (18), 188101(2014).
- Dimova, R. Recent developments in the field of bending rigidity measurements on membranes. Advances in Colloid and Interface Science. 208, 225-234 (2014).
- Bassereau, P., Sorre, B., Lévy, A. Bending lipid membranes: Experiments after W. Helfrich's model. Advances in Colloid and Interface Science. 208, 47-57 (2014).
- Monzel, C., Sengupta, K. Measuring shape fluctuations in biological membranes. Journal of Physics D: Applied Physics. 49 (24), 243002(2016).
- Deserno, M. Mesoscopic membrane physics: concepts, simulations, and selected applications. Macromolecular Rapid Communications. 30 (9-10), 752-771 (2009).
- Reynwar, B. J., et al. Aggregation and vesiculation of membrane proteins by curvature-mediated interactions. Nature. 447 (7143), 461-464 (2007).
- Haswell, E. S., Phillips, R., Rees, D. C. Mechanosensitive channels: what can they do and how do they do it. Structure. 19 (10), 1356-1369 (2011).
- Phillips, R., Ursell, T., Wiggins, P., Sens, P. Emerging roles for lipids in shaping membrane-protein function. Nature. 459 (7245), 379-385 (2009).
- Dill, K. A., Chan, H. S. From Levinthal to pathways to funnels. Nature Structural Biology. 4 (1), 10-19 (1997).
- Henzler-Wildman, K., Kern, D. Dynamic personalities of proteins. Nature. 450 (7172), 964-972 (2007).
- Grimaldo, M., Roosen-Runge, F., Zhang, F., Schreiber, F., Seydel, T. Dynamics of proteins in solution. Quarterly Reviews of Biophysics. 52, 7(2019).
- Lyman, E., Hsieh, C. -L., Eggeling, C. From dynamics to membrane organization: experimental breakthroughs occasion a "modeling manifesto". Biophysical Journal. 115 (4), 595-604 (2018).
- Arriaga, L. R., et al. Dissipative curvature fluctuations in bilayer vesicles: Coexistence of pure-bending and hybrid curvature-compression modes. The European Physical Journal. E, Soft Matter. 31 (1), 105-113 (2010).
- Honerkamp-Smith, A. R., Veatch, S. L., Keller, S. L. An introduction to critical points for biophysicists; observations of compositional heterogeneity in lipid membranes. Biochimica et Biophysica Acta (BBA) - Biomembranes. 1788 (1), 53-63 (2009).
- Veatch, S. L., Keller, S. L. Organization in lipid membranes containing cholesterol. Physical Review Letters. 89 (26), 268101(2002).
- Heberle, F. A., et al. Bilayer thickness mismatch controls domain size in model membranes. Journal of the American Chemical Society. 135 (18), 6853-6859 (2013).
- Nickels, J. D., et al. The in vivo structure of biological membranes and evidence for lipid domains. PLOS Biology. 15 (5), 2002214(2017).
- Simons, K., Ikonen, E. Functional rafts in cell membranes. Nature. 387 (6633), 569-572 (1997).
- van Meer, G., Voelker, D. R., Feigenson, G. W. Membrane lipids: where they are and how they behave. Nature Reviews. Molecular Cell Biology. 9 (2), 112-124 (2008).
- Liu, S. -L., et al. Orthogonal lipid sensors identify transbilayer asymmetry of plasma membrane cholesterol. Nature Chemical Biology. 13, 268(2016).
- Rothman, J., Lenard, J. Membrane asymmetry. Science. 195 (4280), 743-753 (1977).
- Ashkar, R., et al. Neutron scattering in the biological sciences: progress and prospects. Acta Crystallographica Section D. 74 (12), 1129-1168 (2018).
- Woodka, A. C., Butler, P. D., Porcar, L., Farago, B., Nagao, M. Lipid bilayers and membrane dynamics: insight into thickness fluctuations. Physical Review Letters. 109 (5), 058102(2012).
- Chakraborty, S., et al. How cholesterol stiffens unsaturated lipid membranes. Proceedings of the National Academy of Sciences of the United States of America. 117 (36), 21896-21905 (2020).
- Arriaga, L. R., et al. Stiffening effect of cholesterol on disordered lipid phases: a combined neutron spin echo + dynamic light scattering analysis of the bending elasticity of large unilamellar vesicles. Biophysical Journal. 96 (9), 3629-3637 (2009).
- Nagao, M., Kelley, E. G., Ashkar, R., Bradbury, R., Butler, P. D. Probing elastic and viscous properties of phospholipid bilayers using neutron spin echo spectroscopy. The Journal of Physical Chemistry Letters. 8 (19), 4679-4684 (2017).
- Kelley, E. G., Butler, P. D., Ashkar, R., Bradbury, R., Nagao, M. Scaling relationships for the elastic moduli and viscosity of mixed lipid membranes. Proceedings of the National Academy of Sciences of the United States of America. 117 (38), 23365-23373 (2020).
- Rickeard, B. W., et al. Transverse lipid organization dictates bending fluctuations in model plasma membranes. Nanoscale. 12 (3), 1438-1447 (2020).
- Nickels, J. D., et al. Mechanical properties of nanoscopic lipid domains. Journal of the American Chemical Society. 137 (50), 15772-15780 (2015).
- Mezei, F. Neutron spin echo: A new concept in polarized thermal neutron techniques. Zeitschrift für Physik A Hadrons and Nuclei. 255 (2), 146-160 (1972).
- Hayter, J. B., Penfold, J. Neutron spin-echo integral transform spectroscopy. Zeitschrift für Physik B Condensed Matter. 35 (2), 199-205 (1979).
- Monkenbusch, M., Richter, D. Neutrons in Soft Matter. Imae, T., Kanaya, T., Furusaka, M., Torikai, N. , Wiley. ch6 147-182 (2011).
- Pynn, R. Neutron Spin Echo. Mezei, F., Pappas, C., Gutberlet, T. , Springer. Berlin Heidelberg. 159-177 (2003).
- Holderer, O., et al. The JCNS neutron spin-echo spectrometer J-NSE at the FRM II. Measurement Science and Technology. 19 (3), 034022(2008).
- Schleger, P., et al. The long-wavelength neutron spin-echo spectrometer IN15 at the Institut Laue-Langevin. Physica B: Condensed Matter. 241-243, 164-165 (1997).
- Holderer, O., Zolnierczuk, P., Pasini, S., Stingaciu, L., Monkenbusch, M. A better view through new glasses: Developments at the Jülich neutron spin echo spectrometers. Physica B: Condensed Matter. 562, 9-12 (2019).
- Farago, B., et al. The IN15 upgrade. Neutron News. 26 (3), 15-17 (2015).
- Ashkar, R. Selective dynamics in polymeric materials: Insights from quasi-elastic neutron scattering spectroscopy. Journal of Applied Physics. 127 (15), 151101(2020).
- Pasini, S., Holderer, O., Kozielewski, T., Richter, D., Phoenix Monkenbusch, M. J-NSE- Phoenix, a neutron spin-echo spectrometer with optimized superconducting precession coils at the MLZ in Garching. Review of Scientific Instruments. 90 (4), 043107(2019).
- Svergun, D. I., Koch, M. H. J., Timmins, P. A., May, R. P. Small Angle X-Ray and Neutron Scattering from Solutions of Biological Macromolecules. , Oxford University Press. (2013).
- Eicher, B., et al. Joint small-angle X-ray and neutron scattering data analysis of asymmetric lipid vesicles. Journal of Applied Crystallography. 50 (2), 419-429 (2017).
- Heberle, F. A., et al. Model-based approaches for the determination of lipid bilayer structure from small-angle neutron and X-ray scattering data. European Biophysics Journal. 41 (10), 875-890 (2012).
- Jaksch, S., Koutsioubas, A., Mattauch, S., Holderer, O., Frielinghaus, H. Long-range excitations in phospholipid membranes. Chemistry and Physics of Lipids. 225, 104788(2019).
- Jaksch, S., et al. Influence of ibuprofen on phospholipid membranes. Physical Review E. 91 (2), 022716(2015).
- Armstrong, C. L., et al. Effect of cholesterol on the lateral nanoscale dynamics of fluid membranes. European Biophysics Journal. 41 (10), 901-913 (2012).
- Rheinstädter, M. C., Häußler, W., Salditt, T. Dispersion relation of lipid membrane shape fluctuations by neutron spin-echo spectrometry. Physical Review Letters. 97 (4), 048103(2006).
- Armstrong, C. L., Häußler, W., Seydel, T., Katsaras, J., Rheinstädter, M. C. Nanosecond lipid dynamics in membranes containing cholesterol. Soft Matter. 10 (15), 2600-2611 (2014).
- Nickels, J. D., et al. Lipid rafts: buffers of cell membrane physical properties. The Journal of Physical Chemistry B. 123 (9), 2050-2056 (2019).
- Michonova-Alexova, E. I., Sugár, I. P. Component and state separation in DMPC/DSPC lipid bilayers: a Monte Carlo simulation study. Biophysical Journal. 83 (4), 1820-1833 (2002).
- Sugár, I. P., Thompson, T. E., Biltonen, R. L. Monte Carlo simulation of two-component bilayers: DMPC/DSPC mixtures. Biophysical Journal. 76 (4), 2099-2110 (1999).
- Mabrey, S., Sturtevant, J. M. Investigation of phase transitions of lipids and lipid mixtures by sensitivity differential scanning calorimetry. Proceedings of the National Academy of Sciences. 73 (11), 3862-3866 (1976).
- Neutron activation and scattering calculator. , Available from: https://www.ncnr.nist.gov/resources/activation/ (2021).
- Scott, H. L., et al. On the mechanism of bilayer separation by extrusion, or why your LUVs are not really unilamellar. Biophysical Journal. 117 (8), 1381-1386 (2019).
- Ashkar, R., et al. Tuning membrane thickness fluctuations in model lipid bilayers. Biophysical Journal. 109 (1), 106-112 (2015).
- Carrillo, J. -M. Y., Katsaras, J., Sumpter, B. G., Ashkar, R. A computational approach for modeling neutron scattering data from lipid bilayers. Journal of Chemical Theory and Computation. 13 (2), 916-925 (2017).
- Azuah, R. T. DAVE: a comprehensive software suite for the reduction, visualization, and analysis of low energy neutron spectroscopic data. Journal of Research of the National Institute of Standards and Technology. 114 (6), 341-358 (2009).
- Van Hove, L. Correlations in space and time and born approximation scattering in systems of interacting particles. Physical Review. 95 (1), 249-262 (1954).
- Zilman, A. G., Granek, R. Undulations and dynamic structure factor of membranes. Physical Review Letters. 77 (23), 4788-4791 (1996).
- Kelley, E. G., Butler, P. D., Nagao, M. Collective dynamics in model biological membranes measured by neutron spin echo spectroscopy. , Walter de Gruyter, Inc. 131-176 (2019).
- Zheng, Y., Michihiro, N., Dobrin, P. B. Bending elasticity of saturated and monounsaturated phospholipid membranes studied by the neutron spin echo technique. Journal of Physics: Condensed Matter. 21 (15), 155104(2009).
- Sharma, V. K., Qian, S. Effect of an antimicrobial peptide on lateral segregation of lipids: a structure and dynamics study by neutron scattering. Langmuir. 35 (11), 4152-4160 (2019).
- Boggara, M. B., Faraone, A., Krishnamoorti, R. Effect of pH and Ibuprofen on the Phospholipid Bilayer Bending Modulus. The Journal of Physical Chemistry B. 114 (24), 8061-8066 (2010).
- Lee, J. -H., et al. Thermal fluctuation and elasticity of lipid vesicles interacting with pore-forming peptides. Physical Review Letters. 105 (3), 038101(2010).
- Chakraborty, S., Abbasi, A., Bothun, G. D., Nagao, M., Kitchens, C. L. Phospholipid bilayer softening due to hydrophobic gold nanoparticle inclusions. Langmuir. 34 (44), 13416-13425 (2018).
- Hoffmann, I., et al. Softening of phospholipid membranes by the adhesion of silica nanoparticles - as seen by neutron spin-echo (NSE). Nanoscale. 6 (12), 6945-6952 (2014).
- Watson, M. C., Brown, F. L. H. Interpreting membrane scattering experiments at the mesoscale: the contribution of dissipation within the bilayer. Biophysical Journal. 98 (6), 9-11 (2010).
- Seifert, U., Langer, S. A. Viscous modes of fluid bilayer membranes. Europhysics Letters (EPL). 23 (1), 71-76 (1993).
- Bingham, R. J., Smye, S. W., Olmsted, P. D. Dynamics of an asymmetric bilayer lipid membrane in a viscous solvent. EPL (Europhysics Letters). 111 (1), 18004(2015).
- Rawicz, W., Olbrich, K. C., McIntosh, T., Needham, D., Evans, E. Effect of chain length and unsaturation on elasticity of lipid bilayers. Biophysical Journal. 79 (1), 328-339 (2000).
- Doktorova, M., LeVine, M. V., Khelashvili, G., Weinstein, H. A new computational method for membrane compressibility: bilayer mechanical thickness revisited. Biophysical Journal. 116 (3), 487-502 (2019).
- Evans, E., Needham, D. Physical properties of surfactant bilayer membranes: thermal transitions, elasticity, rigidity, cohesion and colloidal interactions. The Journal of Physical Chemistry. 91 (16), 4219-4228 (1987).
- Lesieur, S., Grabielle-Madelmont, C., Paternostre, M. T., Ollivon, M. Size analysis and stability study of lipid vesicles by high-performance gel exclusion chromatography, turbidity, and dynamic light scattering. Analytical Biochemistry. 192 (2), 334-343 (1991).
- Heberle, F. A., et al. Direct label-free imaging of nanodomains in biomimetic and biological membranes by cryogenic electron microscopy. Proceedings of the National Academy of Sciences of the United States of America. 117 (33), 19943-19952 (2020).
- Cornell, C. E., Mileant, A., Thakkar, N., Lee, K. K., Keller, S. L. Direct imaging of liquid domains in membranes by cryo-electron tomography. Proceedings of the National Academy of Sciences of the United States of America. 117 (33), 19713-19719 (2020).
- Yao, X., Fan, X., Yan, N. Cryo-EM analysis of a membrane protein embedded in the liposome. Proceedings of the National Academy of Sciences of the United States of America. 117 (31), 18497-18503 (2020).
- Kučerka, N., Nieh, M. -P., Katsaras, J. Fluid phase lipid areas and bilayer thicknesses of commonly used phosphatidylcholines as a function of temperature. Biochimica et Biophysica Acta (BBA) - Biomembranes. 1808 (11), 2761-2771 (2011).
- Nielsen, J. E., Bjørnestad, V. A., Lund, R. Resolving the structural interactions between antimicrobial peptides and lipid membranes using small-angle scattering methods: the case of indolicidin. Soft Matter. 14 (43), 8750-8763 (2018).
- Kučerka, N., et al. Lipid bilayer structure determined by the simultaneous analysis of neutron and X-ray scattering data. Biophysical Journal. 95 (5), 2356-2367 (2008).
- Kelley, E. G., Butler, P. D., Nagao, M. Scaling of lipid membrane rigidity with domain area fraction. Soft Matter. 15 (13), 2762-2767 (2019).
- Brüning, B. -A., et al. Bilayer undulation dynamics in unilamellar phospholipid vesicles: Effect of temperature, cholesterol and trehalose. Biochimica et Biophysica Acta (BBA) - Biomembranes. 1838 (10), 2412-2419 (2014).
- Kučerka, N., et al. Areas of monounsaturated diacylphosphatidylcholines. Biophysical Journal. 97 (7), 1926-1932 (2009).
- Sharma, V. K., Mamontov, E., Anunciado, D. B., O'Neill, H., Urban, V. S. Effect of antimicrobial peptide on the dynamics of phosphocholine membrane: role of cholesterol and physical state of bilayer. Soft Matter. 11 (34), 6755-6767 (2015).
- Kelley, E. G., Butler, P. D., Nagao, M. Collective dynamics in lipid membranes containing transmembrane peptides. Soft Matter. , (2021).
- Yu, J., et al. Structure and dynamics of lipid membranes interacting with antivirulence end-phosphorylated polyethylene glycol block copolymers. Soft Matter. 16 (4), 983-989 (2020).
- Stingaciu, L. -R., et al. Revealing the dynamics of thylakoid membranes in living cyanobacterial cells. Scientific Reports. 6 (1), 19627(2016).
- Stingaciu, L. -R., O'Neill, H. M., Liberton, M., Pakrasi, H. B., Urban, V. S. Influence of chemically disrupted photosynthesis on cyanobacterial thylakoid dynamics in synechocystis sp. PCC 6803. Scientific Reports. 9 (1), 5711(2019).
- Miller, I. R. Energetics of fluctuation in lipid bilayer thickness. Biophysical Journal. 45 (3), 643-644 (1984).
- Nagao, M. Observation of local thickness fluctuations in surfactant membranes using neutron spin echo. Physical Review E. 80 (3), 031606(2009).
访问受限。请登录或开始试用以查看此内容。
重印与许可
勘误
Formal Correction: Erratum: Neutron Spin Echo Spectroscopy as a Unique Probe for Lipid Membrane Dynamics and Membrane-Protein Interactions
Posted by JoVE Editors on 8/06/2021. Citeable Link.
An erratum was issued for: Neutron Spin Echo Spectroscopy as a Unique Probe for Lipid Membrane Dynamics and Membrane-Protein Interactions. The Introduction, Protocol, and Representative Results sections have been updated.
In the Introduction, the fith pargraph was updated from:
Besides direct access to the length and time scale of membrane dynamics, NSE has the inherent capabilities of neutron isotope sensitivity52. Specifically, the ability of neutrons to interact differently with the isotopes of hydrogen, the most abundant element in biological systems, results in a different neutron scattering length density,34 or NSLD (the equivalent of the optical index of refraction50), when protium is substituted by deuterium. This enables an approach known as contrast variation, which is commonly used to highlight specific membrane features or conceal others — the latter scenario is referred to as contrast matching. A frequent application of contrast variation/matching is the substitution of water (NSLD = -0.56 × 10⁻⁶ Å-2) by heavy water or D2O (NSLD = 6.4 × 10⁻⁶ Å-2) to amplify the neutron signal from protiated lipid membranes (NSLD ~ 2 × 10⁻⁶ Å-2). This approach is highly effective in studies of membrane structure because the penetration of D2O into the headgroup region of the membrane allows accurate determination of the membrane thicknesses (see Figure 2A, left panel) and of the location of different lipid subgroups when more sophisticated models are applied53,54. This paper highlights some examples on the use of contrast variation for studies of collective dynamics in biomimetic membranes and select membrane features.
to:
Besides direct access to the length and time scale of membrane dynamics, NSE has the inherent capabilities of neutron isotope sensitivity52. Specifically, the ability of neutrons to interact differently with the isotopes of hydrogen, the most abundant element in biological systems, results in a different neutron scattering length density,34 or NSLD (the equivalent of the optical index of refraction50), when protium is substituted by deuterium. This enables an approach known as contrast variation, which is commonly used to highlight specific membrane features or conceal others — the latter scenario is referred to as contrast matching. A frequent application of contrast variation/matching is the substitution of water (NSLD = -0.56 × 10⁻⁶ Å-2) by heavy water or D2O (NSLD = 6.4 × 10⁻⁶ Å-2) to amplify the neutron signal from protiated lipid membranes (NSLD ~ 0 × 10-6 Å-2). This approach is highly effective in studies of membrane structure because the penetration of D2O into the headgroup region of the membrane allows accurate determination of the membrane thicknesses (see Figure 2A, left panel) and of the location of different lipid subgroups when more sophisticated models are applied53,54. This paper highlights some examples on the use of contrast variation for studies of collective dynamics in biomimetic membranes and select membrane features.
In the Protocol, step 1.1 was updated from:
For bending fluctuation measurements, make fully protiated liposomes in D2O (D 99.9%) or D2O-buffer (e.g., phosphate buffer prepared with D2O instead of H2O). Use fully protiated DMPC (C36H72NO8P) and DSPC (C44H88NO8P) with 133.4 mg, where XDMPC and XDSPC are the mole fractions of DMPC and DSPC, here set to 0.7 and 0.3, respectively, and MwDMPC and MwDSPC are the molar weights given by 677.9 g/mol and 790.1 g/mol, respectively. Similarly, mDSPC = 66.6 mg. This deuteration scheme increases the scattering contrast between the membrane (NSLD ~ 2 × 10⁻⁶ Å-2) and the deuterated buffer (NSLD ~ 6.4 × 10⁻⁶ Å-2) and amplifies the signal from membrane undulations (see Figure 2A left panel).
to:
For bending fluctuation measurements, make fully protiated liposomes in D2O (D 99.9%) or D2O-buffer (e.g., phosphate buffer prepared with D2O instead of H2O). Use fully protiated DMPC (C36H72NO8P) and DSPC (C44H88NO8P) with 133.4 mg, where XDMPC and XDSPC are the mole fractions of DMPC and DSPC, here set to 0.7 and 0.3, respectively, and MwDMPC and MwDSPC are the molar weights given by 677.9 g/mol and 790.1 g/mol, respectively. Similarly, mDSPC = 66.6 mg. This deuteration scheme increases the scattering contrast between the membrane (NSLD ~ 0 × 10-6 Å-2) and the deuterated buffer (NSLD ~ 6.4 × 10⁻⁶ Å-2) and amplifies the signal from membrane undulations (see Figure 2A left panel).
In the Representative Results, the fist pagargaph was updted from:
NSE studies accessing bending fluctuations are typically performed over a Q-range of ~ (0.04 - 0.2) Å-1. This Q-range corresponds to intermediate length scales between the membrane thickness and the liposomal radius, where bending dynamics dominate. Measurement over an extended Q-range can give access to additional dynamic modes, including liposomal diffusion and intramembrane dynamics. For more details on the cross-over in membrane dynamics accessed by NSE, check these relevant publications25,71. It is important to emphasize that NSE signals are proportional to: , where Icoh and Iinc are, respectively, the coherent and incoherent scattering intensity from the sample. Therefore, it is advisable to prepare NSE liposomal samples in deuterated buffers (i.e., buffers prepared with D2O instead of H2O) to minimize the incoherent scattering signal, mainly contributed by the hydrogen content of the sample. However, in some cases intermediate deuteration schemes (i.e., using mixtures of D2O and H2O) might be necessary to obtain optimal contrast conditions. Typically, NSE measurements of membrane bending fluctuations are performed on fully protiated liposomes in deuterated buffer, referred to as fully contrasted liposomes in Figure 5. This deuteration scheme results in a large NSLD difference between the membrane core (~2 × 10⁻⁶ Å-2) and its deuterated fluid environment (~6.4 × 10⁻⁶ Å-2), which significantly enhances the scattering signal from the liposomal membranes and improves the measurement statistics of bending dynamics. This contrast scheme (Figure 2A left panel) is frequently utilized in studies of bending rigidity of lipid membranes with single38,72 and multiple39,66 lipid components and in studies of membrane softening/stiffening by biological inclusions (e.g., cholesterol, drug molecules, peptides/proteins)36,37,73,74,75, and synthetic additives (e.g., nanoparticles)76,77.
to:
NSE studies accessing bending fluctuations are typically performed over a Q-range of ~ (0.04 - 0.2) Å-1. This Q-range corresponds to intermediate length scales between the membrane thickness and the liposomal radius, where bending dynamics dominate. Measurement over an extended Q-range can give access to additional dynamic modes, including liposomal diffusion and intramembrane dynamics. For more details on the cross-over in membrane dynamics accessed by NSE, check these relevant publications25,71. It is important to emphasize that NSE signals are proportional to: , where Icoh and Iinc are, respectively, the coherent and incoherent scattering intensity from the sample. Therefore, it is advisable to prepare NSE liposomal samples in deuterated buffers (i.e., buffers prepared with D2O instead of H2O) to minimize the incoherent scattering signal, mainly contributed by the hydrogen content of the sample. However, in some cases intermediate deuteration schemes (i.e., using mixtures of D2O and H2O) might be necessary to obtain optimal contrast conditions. Typically, NSE measurements of membrane bending fluctuations are performed on fully protiated liposomes in deuterated buffer, referred to as fully contrasted liposomes in Figure 5. This deuteration scheme results in a large NSLD difference between the membrane core (~0 × 10-6 Å-2) and its deuterated fluid environment (~6.4 × 10⁻⁶ Å-2), which significantly enhances the scattering signal from the liposomal membranes and improves the measurement statistics of bending dynamics. This contrast scheme (Figure 2A left panel) is frequently utilized in studies of bending rigidity of lipid membranes with single38,72 and multiple39,66 lipid components and in studies of membrane softening/stiffening by biological inclusions (e.g., cholesterol, drug molecules, peptides/proteins)36,37,73,74,75, and synthetic additives (e.g., nanoparticles)76,77.
In the Representative Reults, Figure 2 was updated from:
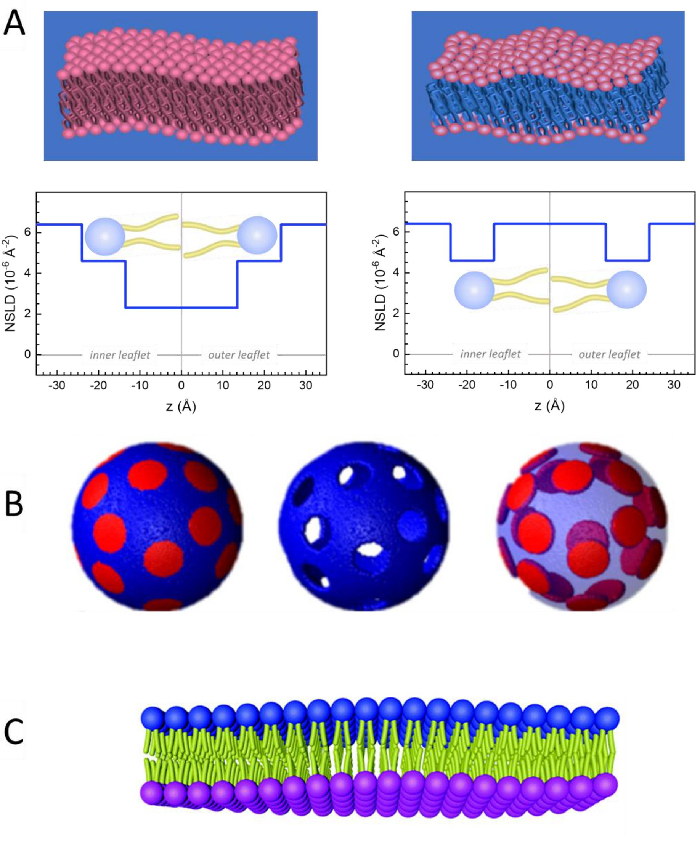
Figure 2: Examples of possible deuteration schemes in NSE experiments on lipid membranes. (A) Left: Fully contrasted membranes, e.g., protiated membranes in deuterated buffer, showing the NSLD profile along the normal to the membrane surface. The difference in the NSLD between the headgroup (~2 × 10⁻² Å-2) and tail region (~4.5 × 10⁻⁶ Å-2) of the membrane is due to the headgroup hydration with deuterated buffer. Right: Tail-contrast matched membranes such that the hydrocarbon tail region of the membrane has the same NSLD as the buffer, as shown in the corresponding NSLD profile along the membrane normal. (B) Domain-forming membranes with two neutron contrast schemes where the domains (center) or the matrix (left) are contrast-matched to the buffer, enabling selective studies of matrix or domain dynamics, respectively. This figure has been modified from Nickels et al., JACS 201541. (C) Asymmetric membranes prepared by cyclodextrin exchange between protiated and deuterated lipid vesicles, resulting in the deuteration of one membrane leaflet while keeping the other leaflet protiated. This allows studies of the bending dynamics of the protiated leaflet and provides insights into the mechanical coupling between opposing leaflets in asymmetric membranes. This figure has been modified from Rickeard et al., Nanoscale 202040. Please click here to view a larger version of this figure.
to:
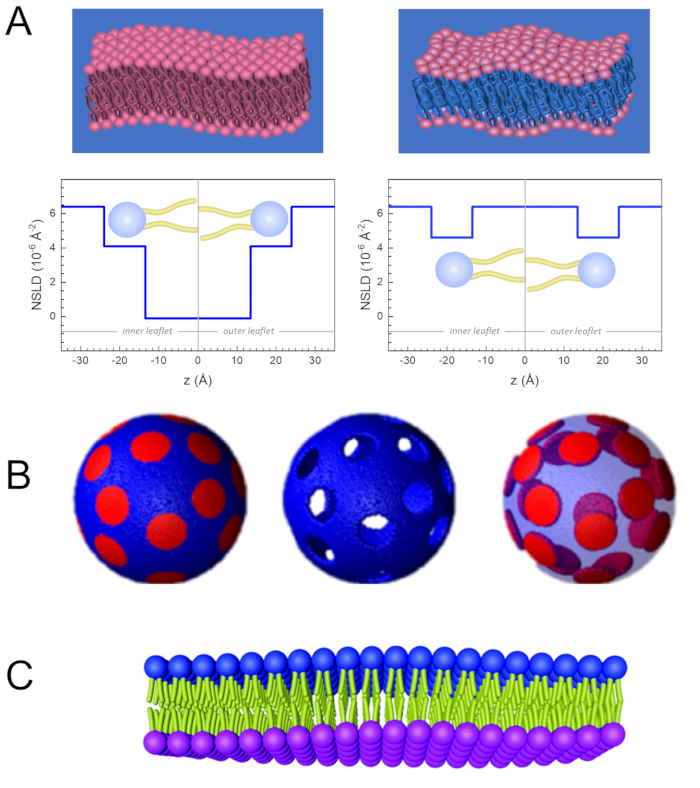
Figure 2: Examples of possible deuteration schemes in NSE experiments on lipid membranes. (A) Left: Fully contrasted membranes, e.g., protiated membranes in deuterated buffer, showing the NSLD profile along the normal to the membrane surface. The difference in the NSLD between the tail region (~0 × 10-2 Å-2) and headgroup region (~4.5 × 10⁻⁶ Å-2) of the membrane is due to the headgroup hydration with deuterated buffer. Right: Tail-contrast matched membranes such that the hydrocarbon tail region of the membrane has the same NSLD as the buffer, as shown in the corresponding NSLD profile along the membrane normal. (B) Domain-forming membranes with two neutron contrast schemes where the domains (center) or the matrix (left) are contrast-matched to the buffer, enabling selective studies of matrix or domain dynamics, respectively. This figure has been modified from Nickels et al., JACS 201541. (C) Asymmetric membranes prepared by cyclodextrin exchange between protiated and deuterated lipid vesicles, resulting in the deuteration of one membrane leaflet while keeping the other leaflet protiated. This allows studies of the bending dynamics of the protiated leaflet and provides insights into the mechanical coupling between opposing leaflets in asymmetric membranes. This figure has been modified from Rickeard et al., Nanoscale 202040. Please click here to view a larger version of this figure.
