在本方案中,我们介绍了如何制备哺乳动物细胞以进行单细胞蛋白质组学分析 通过 使用市售试剂和设备进行质谱分析,支持手动和自动移液操作。
方法文章
基于冻融裂解与等压载体的单细胞蛋白质组学样品制备及质谱分析
* These authors contributed equally
本文内容
摘要
摘要
单细胞蛋白质组学分析需要具备高灵敏度、定量准确、广泛可及且稳健的方法。为满足这些要求,单细胞蛋白质组学(SCoPE2)方案被开发为第二代技术,可用于从微量样本(少至单个细胞)中定量数百至数千种蛋白质。采用该方法的实验已在10天的质谱仪运行时间内,实现了对1,500个单个哺乳动物细胞中超过3,000种蛋白质的定量(每个细胞可鉴定500–1,000种蛋白质)。SCoPE2利用冻融循环实现细胞裂解,免除了对单细胞进行纯化的步骤,从而减少了样品损失,同时加快了样品制备并简化了自动化流程。此外,该方法使用等压载体,有助于蛋白质鉴定并降低样品损失。
本视频方案提供了详细的指导,旨在仅使用广泛可及的设备和试剂即可实现自动化的单细胞蛋白质分析。我们演示了为蛋白质组学分析制备单细胞过程中的关键步骤,从细胞收获到进样进行液相色谱-串联质谱(LC-MS/MS)分析的完整流程。此外,观众还将学习到关于等压标签载体的实验设计原理、等压标签载体及单细胞样品制备的质量控制方法,以及代表性结果,并讨论该方法的局限性。
引言
单细胞分析被广泛用于研究生物系统内部的异质性水平,而这种异质性通常无法通过 群体测量1,2,3加以分辨。此类细胞多样性可能产生功能性后果,有助于加深对基本生物学过程的理解,从癌细胞的治疗耐药性4,5,6到糖尿病中的细胞间异质性7,8,9,10均是如此。许多研究聚焦于通过检测基因组或转录组水平来测量单个细胞中的核酸,从而实现细胞类型和状态的分类。然而,核酸研究领域的此类进展尚无法填补转录后调控方面的知识空白11,因此迫切需要在单细胞中实现类似高通量的蛋白质检测12,13,14,15。
我们开发了 SCoPE216,17,以满足对哺乳动物体系进行严谨且稳健的单细胞蛋白质组学研究的需求。该方法是一种多重化技术,可通过并行标记和分析多个细胞来提高通量18,与一次仅分析一个细胞的无标记方法19,20形成对比。该方法的样品制备流程、质谱分析策略以及后续的数据分析步骤,能够实现对每个单细胞中数百至数千种蛋白质的准确定量。该方法通过使用等压载体21,使单细胞的质谱分析成为可能;等压载体是指少量群体细胞(通常为 25–200 个)构成的小量样本,其生物学特性与目标单细胞群体相似。该载体材料与相同材料的参考通道及单细胞一起,利用串联质谱标签(TMT 标签)在同一组中实现多重化。载体通道可减少样品在表面区域的损失,并提供肽段鉴定所需的离子骨架碎片。参考通道以大量制备后稀释至每组单细胞相当于 5–10 个细胞的水平,有助于控制分析过程中的技术变异。具体而言,参考通道可用于校正由液相色谱-串联质谱(LC-MS/MS)相关效应(如离子采样效率和电离效率)引起的变异。通常情况下,参考通道和载体通道来源于相同的细胞群体。
该样品制备方案是在 SCoPE-MS22 基础上发展的第二代方法,通过多项协同优化实现性能提升。这些改进包括一种避免样品纯化的细胞裂解方法,而样品纯化是质谱蛋白质组学样品制备中的常见步骤。本方法采用 mPOP(最小化蛋白质组样品制备)23,即一种冻融-加热裂解法。该方法可在更小体积中实现单细胞裂解,并可在多孔板中而非离心管中进行,从而有利于使用热循环仪实现高通量和自动化操作。总体而言,与 SCoPE-MS16,24 相比,该方法降低了单细胞分析的成本,并提高了定量准确性。
本方案描述了如何制备用于蛋白质组学分析的单个细胞,包括如何使用 TMTpro 18-plex 同重同位素标签制备载体通道和参考通道。处于单细胞悬液状态并可分离至 384 孔板中的哺乳动物细胞通常适用于本方案。文中还展示了成功单细胞样本集的代表性结果,呈现了由 R Shiny 应用程序 DO-MS25 生成的多个质量控制图。其他已发表的软件工具26,27 和实验指南17,21 已促进了该方案的广泛应用。我们希望本可视化指南能进一步帮助研究人员开展单细胞蛋白质组学实验。
方案
注意:本方案中室温(RT)为 18-22 °C。
1. 载体与参考材料的制备
- 细胞分离
- 将目标细胞收集到预冷的1×PBS溶液中,制成细胞悬液。
注意:如果可能,载体和参考物质应从拟在单细胞水平研究的细胞群体中制备。不同实验条件下的细胞(如刺激与未刺激的免疫细胞)应以相似数量构成载体和参考物质。当无法收获足够数量的此类细胞时,应基于生物学相似性选择合适的细胞群体。 - 使用血细胞计数板或其他细胞计数方法(如FACS)对悬液中的细胞数量进行计数。
- 将每种细胞类型的22,000个细胞离心后重悬于11 µL HPLC级水中,分别加入PCR管(标准250 µL PCR管)。
注意:此处建议的细胞数量足以满足从一个装满单细胞的384孔板所能制备的多组实验所需的载体和参考物质。此步骤中的细胞投入量及后续试剂用量可根据所需组数按比例放大。离心速度取决于实验室的细胞培养操作习惯。典型离心条件为:300 × g,5分钟。 - 将样品转移至-80 °C冰箱中冷冻至少30分钟。
暂停点:样品可在冷冻状态下保存数月,不会影响单细胞数据质量。
- 将目标细胞收集到预冷的1×PBS溶液中,制成细胞悬液。
- 细胞裂解
- 将含有细胞的PCR管在90 °C加热10分钟(热循环仪盖温设为105 °C),加热结束后立即让管子冷却至12 °C。
- 短暂涡旋振荡管子,然后在室温下使用台式PCR管离心机离心,使所有液体聚集于管底。
- 将PCR管置于水浴超声仪中,超声处理5分钟,随后在室温下置于冰上。
- 胰蛋白酶消化
- 在冰上向每个样品管中加入2.2 µL主混合液(组分见表1)。
注意:胰蛋白酶可能引起皮肤、呼吸道和眼睛刺激。务必佩戴个人防护装备,并在化学通风橱中操作。 - 短暂涡旋振荡各管以混匀,然后在室温下使用台式PCR管离心机离心,使液体全部沉降至管底。
- 将样品在37 °C孵育3小时(热循环仪盖温设为52 °C)。
- 在冰上向每个样品管中加入2.2 µL主混合液(组分见表1)。
- TMT标记反应
- 消化完成后,在室温下使用台式PCR管离心机对样品进行离心。
- 将每个样品均分为两份,每份6.6 µL,使每管含有11,000个细胞。
- 向用于载体的管中加入3.3 µL浓度为85 mM的TMT标签126。
- 向用于参考物质的管中加入3.3 µL浓度为85 mM的TMT标签127N。
- 短暂涡旋振荡各管,然后在室温下使用台式PCR管离心机离心,使液体沉降至管底。
- 将管子在室温下静置1小时。
- TMT标记反应淬灭
- 向每管中加入1.65 µL 0.5%羟胺溶液。
注意:羟胺可能引起皮肤刺激。务必佩戴个人防护装备。 - 短暂涡旋振荡各管,然后在室温下使用台式PCR管离心机离心,使液体沉降至管底。
- 将管子在室温下静置30分钟。
- 向每管中加入1.65 µL 0.5%羟胺溶液。
- 载体与参考物质的混合
- 若构成载体的样品已分别标记,则按等比例混合。
- 若构成参考物质的样品已分别标记,则按等比例混合。
- 将载体与参考物质混合,使最终载体浓度为100–200个细胞/µL,参考物质浓度为5–10个细胞/µL。
- 在将载体和参考物质与单细胞样本组合前,应对其质量进行评估。
注意:载体和参考物质的质量控制可通过多种方法进行,但推荐使用DO-MS软件 (网址:do-ms.slavovlab.net17)。关键质量指标包括错切率(<25%,该指标计算方式为含有漏切位点的高置信度肽段数除以总高置信度肽段数)和标记效率(>99%,该指标计算方式为被标记的位点数(即肽段N端和赖氨酸)除以总标记位点数)。
暂停点:载体和参考物质可在-80 °C保存,直至需要使用。
| 组分 | 混合浓度 | 每管终浓度 |
| Trypsin Gold | 50 ng/µL | 8.33 ng/µL |
| TEAB, pH = 8.5 | 500 mM | 83.33 mM |
| Benzonase 核酸酶 | 1.2 units | 0.2 units |
表1:主混合液的试剂用量。 列出了胰蛋白酶消化所需的试剂最终浓度。
2. SCoPE2 样品制备
- 细胞分离
- 在每条肽段中补充25 fmol的HPLC级水 µL 一种合成肽溶液
注意:Waters MassPrep 肽溶液是可选用试剂的一个示例,由七种电离效果较差的肽组成。这一特性正是该溶液的关键优势:这些肽不会干扰单细胞质谱定量的准确性。任何高度纯化的、少量且不太可能存在于目标样品中的肽混合物均适用于此目的。 - 添加 1 µL 使用液体分配机器人或手动移液器将该混合液加入384孔板的每孔中。
- 密封培养板,并在室温下使用台式板架离心机离心,使液体聚集于孔底。
暂停点:含有此溶液的板 可在 -80 °C 直至需要时 - 获取未固定的、分散的单细胞悬液。
注意:如何 获得细胞悬液的具体方法取决于目标细胞类型。以下是一些通用示例:- 悬浮细胞:将细胞离心形成沉淀,并移除细胞培养基。
- 贴壁细胞:通过胰酶消化或刮取的方式从培养皿或培养瓶中收集细胞,随后离心去除细胞培养基。
- 用预冷的1×PBS洗涤细胞悬液两次。第二次洗涤后,将细胞悬浮于1×PBS中。
- 如果384孔板已被冷冻,则在室温下解冻。离心以确保所有液体均位于孔底。
- 使用细胞分选仪或其他可用方法(如手动挑取)将单个细胞分配至相应的孔中。
注意:添加单细胞至孔板时,需留出部分空孔用于阴性对照和阳性对照(见讨论部分)。使用流式细胞术时,采用 流式细胞仪的最低可能流速 较低的流速被认为更有利于细胞操作。此外,喷嘴尺寸应适合目标细胞的使用。建议与流式细胞仪平台合作。 - 向选定的孔中加入 2-5 个细胞当量裂解液的阳性对照,可通过手动移液或液体处理机器人完成。
- 用台式板式离心机在室温下密封并离心已分选细胞的板,使液体聚集于底部。将板置于 -80 °C 尽快。
暂停点:分选后的单细胞板可在 -80 °C 直至需要时
- 在每条肽段中补充25 fmol的HPLC级水 µL 一种合成肽溶液
- 细胞裂解
- 将分选好的单细胞384孔板尽快放入热循环仪中。
- 将培养板加热至 90 °C 10 分钟(将盖子温度设置为 105 °C),然后让培养板冷却至室温 12 °C.
- 在室温下,使用台式平板离心机短暂离心该孔板。
- 在水浴超声仪中,于室温下对培养板进行超声处理5分钟,然后将其置于冰上。
- 胰蛋白酶消化
- 准备 100 µL 主混合液(参见 表1 每384孔板的组分数量
- 向384孔板的每个孔中加入 0.2 µL 使用液体处理仪,加入在步骤2.3.1中配制的主混合液。
注意:若使用手动移液,应使用较大的体积,并确保每孔中试剂的终浓度保持不变。 - 密封培养板,涡旋振荡5秒,然后在室温下使用台式板架离心机离心。
- 将 384 孔板加热 37 °C (盖子温度设定为 52 °C3小时。
- TMT 标记反应
- 将 TMT 标记的 85 mM 储存液(128N 至 135N)从 -80 °C 冷冻机。打开前将管子恢复至室温。
- 将标签物用无水乙腈稀释至 22 mM。
警告:乙腈为易燃液体,可刺激皮肤、眼睛、呼吸道及中枢神经系统。务必佩戴个人防护装备,并在通风橱内操作。 - 使用此标记策略,添加 0.5 µL 将稀释的 TMT 标记物分别加入 384 孔板的每孔中。可使用液体分配机器人(若使用液体处理仪,务必配套使用适用于有机溶剂的相关设备)或手动移液器。
注意:参见 表2 用于标记策略。参见 表3 示例板布局。 - 密封培养板,涡旋振荡5秒,然后在室温下使用台式板式离心机离心。
- 在室温下孵育标记反应1小时。
- TMT标记反应的淬灭
- 向384孔板的每个孔中加入 0.2 µL 使用液体处理仪加入0.5%羟胺(用HPLC级水稀释)
注意:若使用手动移液,请使用较大的体积,并确保每孔中试剂的终浓度保持不变。 - 密封培养板,涡旋振荡5秒,并在室温下使用台式板式离心机离心收集。
- 将培养板置于室温下 30 分钟。
- 向384孔板的每个孔中加入 0.2 µL 使用液体处理仪加入0.5%羟胺(用HPLC级水稀释)
- LC-MS/MS 分析前准备:单细胞与对照孔同载体/参考物质的结合
- 从 -80 °C 冷冻机
- 每组样品,用移液器吸取 1 µL 将载体和参考物质加入将构成单个组合的第一孔中。用移液器将第一孔的全部体积转移至下一孔。继续将每孔的全部体积依次转移至下一孔,直至所有将被纳入单个组合的孔均已在最后一孔中合并。
注意:载体和参照物质的浓度应分别为200个细胞和5个细胞当量,但如前所述21,这些量可能会有所变化。每组的具体用量请参见标记策略(见 表 2),应包含载体、参照样本以及最多12个或14个单细胞或对照样本,分别对应使用TMTpro-16plex或TMTpro-18plex的情况(见步骤2.4.3)。 - 每组添加 5 µL 向每组中第一个单细胞孔加入50%乙腈(用HPLC级水稀释),然后将该孔中的全部液体转移至下一个孔。依次将每个孔中的全部液体转移至下一个细胞孔,直至该组所有待合并的孔均被转移至最后一个孔中。
注意:此洗涤步骤有助于从孔中回收样品。 - 将每组样品分别转移至各自的自动进样器玻璃插件中。
注意:这些样本集也可合并至384孔板的单个孔中,并直接放入自动进样器中进行上样。28. - 将所有样品集合并转移至玻璃插件后,干燥样品。
暂停点:干燥后的样本集可在 -80 °C 在上样至质谱仪前至少一周 - 在进行液相色谱-串联质谱(LC-MS/MS)分析之前,添加 1.2 µL 用0.1%甲酸(用HPLC级水稀释)重悬每组标记的肽段。
警告:甲酸为易燃液体,可造成严重眼部损伤或皮肤灼伤。务必佩戴个人防护装备,在通风良好的区域操作。 - 将自动进样器插件放入玻璃自动进样瓶中,并用瓶盖密封每个样品。
- 每管涡旋振荡5秒,确保重悬完全,然后在室温下用管架离心机离心。
- 确保每个样本位于插入件底部,而非溅到侧壁上。
- 将小瓶放入自动进样器样品盘中。
- 每组样品分别进样 1 µL 用于液相色谱-串联质谱(LC-MS/MS)分析。
| 标签 | 126 | 127N | 127C | 128N | 128C | 129N | 129C | 130N | 130C | .... | 135N |
| 样本类型 | 载体 | 参照 | 空白 | 空白 | 单细胞/对照 | 单细胞/对照 | 单细胞/对照 | 单细胞/对照 | 单细胞/对照 | .... | 单细胞/对照 |
表2:SCoPE2 TMTpro-18重标记方案示例。 载体和参考样本通常标记在前两个TMT标签中。随后的两个标签通常跳过,以避免可能的同位素污染,从而影响定量准确性。其余标签用于单细胞或对照样本。
| 128C | 129N | 129C | 130N | 130C | 131N | 131C | 132N | 132C | 133N | 133C | 134N | 128C | 129N | 129C | 130N | 130C | 131N | 131C | 132N | 132C | 133N | 133C | 134N | |
| 1 | 2 | 3 | 4 | 5 | 6 | 7 | 8 | 9 | 10 | 11 | 12 | 13 | 14 | 15 | 16 | 17 | 18 | 19 | 20 | 21 | 22 | 23 | 24 | |
| A | 单细胞蛋白质组学分析需要具备高灵敏度、定量准确、广泛可及且稳健的方法。为满足这些要求,单细胞蛋白质组学(SCoPE2)方案被开发为第二代技术,可用于从微量样本(少至单个细胞)中定量数百至数千种蛋白质。采用该方法的实验已在10天的质谱仪运行时间内,实现了对1,500个单个哺乳动物细胞(每个细胞500–1,000种蛋白质)中超过3,000种蛋白质的定量。SCoPE2利用冻融-加热循环实现细胞裂解,省去了单细胞纯化步骤,从而减少了样品损失,同时加快了样品制备速度并简化了自动化流程。此外,该方法使用等压载体,有助于蛋白质鉴定并减少样品损失。本视频方案提供了详细操作指导,使研究者仅需使用广泛可及的设备和试剂即可开展自动化的单细胞蛋白质分析。我们演示了从细胞收获到进样进行液相色谱-串联质谱(LC-MS/MS)分析的蛋白质组学样品制备过程中的关键步骤。此外,观众还将学习等压载体实验设计的基本原理、等压载体与单细胞样品制备的质量控制方法,以及代表性结果与该方法局限性的讨论。 | 单细胞蛋白质组学分析需要具备高灵敏度、定量准确、广泛可及且稳健的方法。为满足这些要求,开发了单细胞蛋白质组学(SCoPE2)方案,作为第二代技术,可用于从微量样本(少至单个细胞)中定量数百至数千种蛋白质。采用该方法的实验已在10天的质谱仪运行时间内,实现了对1,500个单个哺乳动物细胞(每个细胞500–1,000种蛋白质)中超过3,000种蛋白质的定量。SCoPE2利用冻融循环实现细胞裂解,无需对单细胞进行纯化处理,从而减少了样品损失,同时加快了样品制备速度并简化了自动化流程。此外,该方法使用等压载体,有助于蛋白质鉴定并减少样品损失。本视频协议提供了详细的指导,以帮助采用仅使用广泛可及的设备和试剂的自动化单细胞蛋白质分析。我们演示了从细胞收获到液相色谱-串联质谱(LC-MS/MS)分析进样前,用于蛋白质组学分析的单细胞制备过程中的关键步骤。此外,还指导观众了解等压载体实验设计的原理、等压载体与单细胞样品制备的质量控制,以及代表性结果与该方法局限性的讨论。 | - | 单细胞蛋白质组学分析需要具备高灵敏度、定量准确、广泛可及且稳健的方法。为满足这些要求,单细胞蛋白质组学(SCoPE2)技术被开发为第二代方法,可用于从少量样本(少至单个细胞)中定量数百至数千种蛋白质。采用该方法的实验已在10天的质谱仪运行时间内,实现了对1,500个单个哺乳动物细胞(每个细胞500–1,000种蛋白质)中超过3,000种蛋白质的定量。SCoPE2利用冻融-加热循环实现细胞裂解,免除了对单细胞进行纯化的步骤,从而减少了样品损失,同时加快了样品制备速度并简化了自动化流程。此外,该方法使用等压载体,有助于蛋白质鉴定并减少样品损失。本视频协议提供了详细指导,使研究者仅使用广泛可及的设备和试剂即可开展自动化的单细胞蛋白质分析。我们演示了从细胞收获到进样至液相色谱-串联质谱(LC-MS/MS)分析的单细胞蛋白质组学分析准备过程中的关键步骤。此外,观众还将了解等压载体实验设计的原理、等压载体与单细胞样品制备的质量控制,以及代表性结果与该方法局限性的讨论。 | 单细胞蛋白质组学分析需要具备高灵敏度、定量准确、广泛可及且稳健的方法。为满足这些要求,开发了单细胞蛋白质组学(SCoPE2)方案,作为第二代技术,可用于从微量样本(少至单个细胞)中定量数百至数千种蛋白质。采用该方法的实验已在10天的质谱仪运行时间内,实现了对1,500个单个哺乳动物细胞(每个细胞500–1,000种蛋白质)中超过3,000种蛋白质的定量。SCoPE2利用冻融循环实现细胞裂解,无需对单细胞进行纯化处理,从而减少了样品损失,同时加快了样品制备速度并简化了自动化流程。此外,该方法使用等压载体,有助于蛋白质鉴定并减少样品损失。本视频方案提供了详细操作指导,使研究者仅使用广泛可及的设备和试剂即可开展自动化单细胞蛋白质分析。我们演示了从细胞收获到进样进行液相色谱-串联质谱(LC-MS/MS)分析的蛋白组学样品制备过程中的关键步骤。此外,还指导观众了解等压载体实验设计原理、等压载体与单细胞样品的质量控制,以及代表性结果,并讨论了该方法的局限性。 | 单细胞蛋白质组学分析需要具备高灵敏度、定量准确、广泛可及且稳健的方法。为满足这些要求,单细胞蛋白质组学(SCoPE2)方案被开发为第二代技术,可用于从微量样本(少至单个细胞)中定量数百至数千种蛋白质。采用该方法的实验已在10天的质谱仪运行时间内,实现了对1,500个单个哺乳动物细胞(每个细胞500–1,000种蛋白质)中超过3,000种蛋白质的定量。SCoPE2利用冻融-加热循环实现细胞裂解,省去了单细胞纯化步骤,从而减少了样品损失,同时加快了样品制备速度并简化了自动化流程。此外,该方法使用等压载体,有助于蛋白质鉴定并减少样品损失。本视频方案提供了详细操作指导,使研究者仅需使用广泛可及的设备和试剂即可开展自动化的单细胞蛋白质分析。我们演示了从细胞收获到进样进行液相色谱-串联质谱(LC-MS/MS)分析的蛋白质组学样品制备过程中的关键步骤。此外,观众还将学习等压载体实验设计的基本原理、等压载体及单细胞样品的质量控制方法,以及代表性结果与该方法局限性的讨论。 | 单细胞蛋白质组学 | 单细胞蛋白质组学分析需要具备高灵敏度、定量准确、广泛可及且稳健的方法。为满足这些要求,单细胞蛋白质组学(SCoPE2)技术被开发为第二代方法,可用于从少量样本(少至单个细胞)中定量数百至数千种蛋白质。采用该方法的实验已在10天的质谱仪运行时间内,实现了对1,500个单个哺乳动物细胞(每个细胞500–1,000种蛋白质)中超过3,000种蛋白质的定量。SCoPE2利用冻融循环实现细胞裂解,避免了对单细胞进行纯化的步骤,从而减少了样品损失,同时加快了样品制备速度并简化了自动化流程。此外,该方法使用等压载体,有助于蛋白质鉴定并减少样品损失。本视频协议提供了详细的指导,使研究者仅使用广泛可及的设备和试剂即可开展自动化单细胞蛋白质分析。我们演示了从细胞收获到进样进行液相色谱-串联质谱(LC-MS/MS)分析的蛋白质组学样品制备过程中的关键步骤。此外,观众还将了解等压载体实验设计的基本原理、等压载体与单细胞样品的质量控制方法,以及代表性结果与该方法局限性的讨论。 | + | 单细胞蛋白质组学 | 单细胞蛋白质组学分析需要具备高灵敏度、定量准确、广泛可及且稳健的方法。为满足这些要求,单细胞蛋白质组学(SCoPE2)技术被开发为第二代方法,可用于从少量样本(少至单个细胞)中定量数百至数千种蛋白质。采用该方法的实验已在10天的质谱仪运行时间内,实现了对1,500个单个哺乳动物细胞(每个细胞500–1,000种蛋白质)中超过3,000种蛋白质的定量。SCoPE2利用冻融循环实现细胞裂解,避免了对单细胞进行纯化的步骤,从而减少了样品损失,同时加快了样品制备速度并简化了自动化流程。此外,该方法使用等压载体,有助于蛋白质鉴定并减少样品损失。本视频协议提供了详细的指导,使研究者仅使用广泛可及的设备和试剂即可开展自动化单细胞蛋白质分析。我们演示了从细胞收获到进样进行液相色谱-串联质谱(LC-MS/MS)分析的蛋白质组学样品制备过程中的关键步骤。此外,观众还将了解等压载体实验设计的基本原理、等压载体与单细胞样品的质量控制方法,以及代表性结果与该方法局限性的讨论。 | 单细胞蛋白质组学 | 单细胞蛋白质组学分析需要具备高灵敏度、定量准确、广泛可及且稳健的方法。为满足这些要求,单细胞蛋白质组学(SCoPE2)技术被开发为第二代方法,可用于从少量样本(少至单个细胞)中定量数百至数千种蛋白质。采用该方法的实验已在10天的质谱仪运行时间内,实现了对1,500个单个哺乳动物细胞(每个细胞500–1,000种蛋白质)中超过3,000种蛋白质的定量。SCoPE2利用冻融循环实现细胞裂解,无需对单细胞进行纯化处理,从而减少了样品损失,同时加快了样品制备速度并简化了自动化流程。此外,该方法使用等压载体,有助于蛋白质鉴定并减少样品损失。本视频协议提供了详细的指导,使研究者仅使用广泛可及的设备和试剂即可开展自动化的单细胞蛋白质分析。我们演示了从细胞收获到进样进行液相色谱-串联质谱(LC-MS/MS)分析的蛋白质组学样品制备过程中的关键步骤。此外,还指导观众了解等压载体实验设计的原理、等压载体与单细胞样品的质量控制,以及代表性结果,并讨论了该方法的局限性。 | 单细胞蛋白质组学 | 单细胞蛋白质组学分析需要具备高灵敏度、定量准确、广泛可及且稳健的方法。为满足这些要求,单细胞蛋白质组学(SCoPE2)技术被开发为第二代方法,可用于从微量样本(少至单个细胞)中定量数百至数千种蛋白质。采用该方法的实验已在10天的质谱仪运行时间内,实现了对1,500个单个哺乳动物细胞(每个细胞500–1,000种蛋白质)中超过3,000种蛋白质的定量。SCoPE2利用冻融循环实现细胞裂解,无需对单细胞进行纯化处理,从而减少了样品损失,同时加快了样品制备速度并简化了自动化流程。此外,该方法使用等压载体,有助于蛋白质鉴定并减少样品损失。本视频协议提供了详细指导,使研究者仅使用广泛可及的设备和试剂即可实现自动化的单细胞蛋白质分析。我们演示了从细胞收获到进样进行液相色谱-串联质谱(LC-MS/MS)分析的蛋白组学样品制备过程中的关键步骤。此外,观众还将了解等压载体实验设计的基本原理、等压载体与单细胞样品的质量控制方法,以及代表性结果与该方法局限性的讨论。 | 单细胞蛋白质组学 | 单细胞蛋白质组学 | 单细胞蛋白质组学 | - | 单细胞蛋白质组学(SCoPE2):利用等压载体进行自动化单细胞蛋白质分析 | + | 单细胞蛋白质组学分析需要具备高灵敏度、定量准确、广泛可及且稳健的方法。为满足这些要求,单细胞蛋白质组学(SCoPE2)技术被开发为第二代方法,可用于从少量样本(少至单个细胞)中定量数百至数千种蛋白质。采用该方法的实验已在10天的质谱仪运行时间内,实现了对1,500个单个哺乳动物细胞(每个细胞500–1,000种蛋白质)中超过3,000种蛋白质的定量。SCoPE2利用冻融循环实现细胞裂解,避免了对单细胞进行纯化的步骤,从而减少了样品损失,同时加快了样品制备速度并简化了自动化流程。此外,该方法使用等压载体,有助于蛋白质鉴定并减少样品损失。本视频协议提供了详细的指导,使研究者仅使用广泛可及的设备和试剂即可开展自动化单细胞蛋白质分析。我们演示了从细胞收获到进样进行液相色谱-串联质谱(LC-MS/MS)分析的蛋白质组学样品制备过程中的关键步骤。此外,观众还将了解等压载体实验设计的基本原理、等压载体与单细胞样品的质量控制方法,以及代表性结果与该方法局限性的讨论。 | 单细胞蛋白质组学 | 单细胞蛋白质组学分析需要具备高灵敏度、定量准确、广泛可及且稳健的方法。为满足这些要求,开发了第二代单细胞蛋白质组学(SCoPE2)方案,用于从微量样本(少至单个细胞)中定量数百至数千种蛋白质。采用该方法的实验已在10天的质谱仪运行时间内,实现了对1,500个单个哺乳动物细胞(每个细胞500–1,000种蛋白质)中超过3,000种蛋白质的定量。SCoPE2利用冻融-加热循环实现细胞裂解,无需对单细胞进行纯化处理,从而减少了样品损失,同时加快了样品制备速度并简化了自动化流程。此外,该方法使用等压载体,有助于蛋白质鉴定并减少样品损失。本视频协议提供了详细指导,使研究者仅使用广泛可及的设备和试剂即可开展自动化的单细胞蛋白质分析。我们演示了从细胞收获到进样进行液相色谱-串联质谱(LC-MS/MS)分析的蛋白组学样品制备过程中的关键步骤。此外,观众还将了解等压载体实验设计的原理、等压载体与单细胞样品的质量控制方法,以及代表性结果与该方法局限性的讨论。 |
| B | 单细胞蛋白质组学 | + | 单细胞蛋白质组学分析需要具备高灵敏度、定量准确、广泛可及且稳健的方法。为满足这些要求,开发了单细胞蛋白质组学(SCoPE2)方案,作为第二代技术,可用于从微量样本(少至单个细胞)中定量数百至数千种蛋白质。采用该方法的实验已在10天的质谱仪运行时间内,实现了对1,500个单个哺乳动物细胞(每个细胞500–1,000种蛋白质)中超过3,000种蛋白质的定量。SCoPE2利用冻融循环实现细胞裂解,无需对单细胞进行纯化处理,从而减少了样品损失,同时加快了样品制备速度并简化了自动化流程。此外,该方法使用等压载体,有助于蛋白质鉴定并减少样品损失。本视频方案提供了详细操作指南,使研究者仅需使用广泛可及的设备与试剂即可开展自动化单细胞蛋白质分析。我们演示了从细胞收获到液相色谱-串联质谱(LC-MS/MS)分析进样前,用于蛋白质组学分析的单细胞制备过程中的关键步骤。此外,还指导观众了解等压载体实验设计的基本原理、等压载体与单细胞样品制备的质量控制,以及代表性结果与该方法局限性的讨论。 | 单细胞蛋白质组学分析需要具备高灵敏度、定量准确、广泛可及且稳健的方法。为满足这些要求,单细胞蛋白质组学(SCoPE2)方案被开发为第二代技术,可用于从微量样本(少至单个细胞)中定量数百至数千种蛋白质。采用该方法的实验已在10天的质谱仪运行时间内,实现了对1,500个单个哺乳动物细胞(每个细胞500–1,000种蛋白质)中超过3,000种蛋白质的定量。SCoPE2利用冻融-加热循环实现细胞裂解,省去了单细胞纯化步骤,从而减少了样品损失,同时加快了样品制备速度并简化了自动化流程。此外,该方法使用等压载体,有助于蛋白质鉴定并减少样品损失。本视频方案提供了详细操作指导,使研究者仅需使用广泛可及的设备和试剂即可开展自动化的单细胞蛋白质分析。我们演示了从细胞收获到进样进行液相色谱-串联质谱(LC-MS/MS)分析的蛋白质组学样品制备过程中的关键步骤。此外,观众还将了解等压载体实验设计的基本原理、等压载体与单细胞样品制备的质量控制方法,以及代表性结果与该方法局限性的讨论。 | 单细胞蛋白质组学 | 单细胞蛋白质组学分析需要具备高灵敏度、定量准确、广泛可及且稳健的方法。为满足这些要求,单细胞蛋白质组学(SCoPE2)技术被开发为第二代方法,可用于从少量样本(少至单个细胞)中定量数百至数千种蛋白质。采用该方法的实验已在10天的质谱仪运行时间内,实现了对1,500个单个哺乳动物细胞(每个细胞500–1,000种蛋白质)中超过3,000种蛋白质的定量。SCoPE2利用冻融循环实现细胞裂解,无需对单细胞进行纯化处理,从而减少了样品损失,同时加快了样品制备速度并简化了自动化流程。此外,该方法使用等压载体,有助于蛋白质鉴定并减少样品损失。本视频协议提供了详细的指导,使研究者仅使用广泛可及的设备和试剂即可开展自动化的单细胞蛋白质分析。我们演示了从细胞收获到进样进行液相色谱-串联质谱(LC-MS/MS)分析的蛋白质组学样品制备过程中的关键步骤。此外,还指导观众了解等压载体实验设计的原理、等压载体与单细胞样品制备的质量控制,以及代表性结果与该方法局限性的讨论。 | 单细胞蛋白质组学 | 单细胞蛋白质组学分析需要具备高灵敏度、定量准确、广泛可及且稳健的方法。为满足这些要求,开发了第二代单细胞蛋白质组学(SCoPE2)方案,用于从微量样本(少至单个细胞)中定量数百至数千种蛋白质。采用该方法的实验已在10天的质谱仪运行时间内,实现了对1,500个单个哺乳动物细胞(每个细胞500–1,000种蛋白质)中超过3,000种蛋白质的定量。SCoPE2利用冻融-加热循环实现细胞裂解,无需对单细胞进行纯化步骤,从而减少了样品损失,同时加快了样品制备并简化了自动化流程。此外,该方法使用等压载体,有助于蛋白质鉴定并减少样品损失。本视频协议提供了详细的指导,使研究者仅使用广泛可及的设备和试剂即可开展自动化的单细胞蛋白质分析。我们演示了从细胞收获到进样进行液相色谱-串联质谱(LC-MS/MS)分析的蛋白组学样品制备过程中的关键步骤。此外,还指导观众了解等压载体实验设计的原理、等压载体与单细胞样品制备的质量控制,以及代表性结果,并讨论了该方法的局限性。 | 单细胞蛋白质组学 | 单细胞蛋白质组学分析需要具备高灵敏度、定量准确、广泛可及且稳健的方法。为满足这些要求,单细胞蛋白质组学(SCoPE2)技术被开发为第二代方法,可用于从微量样本(少至单个细胞)中定量数百至数千种蛋白质。采用该方法的实验已在10天的质谱仪运行时间内,实现了对1,500个单个哺乳动物细胞(每个细胞500–1,000种蛋白质)中超过3,000种蛋白质的定量。SCoPE2利用冻融循环实现细胞裂解,无需对单个细胞进行纯化处理,从而减少了样品损失,同时加快了样品制备速度并简化了自动化流程。此外,该方法使用等压载体,有助于蛋白质鉴定并减少样品损失。本视频协议提供了详细指导,使研究者仅使用广泛可及的设备和试剂即可开展自动化的单细胞蛋白质分析。我们演示了从细胞收获到液相色谱-串联质谱(LC-MS/MS)进样分析的单细胞蛋白质组学样品制备过程中的关键步骤。此外,还指导观众了解等压载体实验设计的原理、等压载体与单细胞样品的质量控制,以及代表性结果,并讨论了该方法的局限性。 | + | 单细胞蛋白质组学 | 单细胞蛋白质组学分析需要具备高灵敏度、定量准确、广泛可及且稳健的方法。为满足这些要求,单细胞蛋白质组学(SCoPE2)技术被开发为第二代方法,可用于从少量样本(少至单个细胞)中定量数百至数千种蛋白质。采用该方法的实验已在10天的质谱仪运行时间内,实现了对1,500个单个哺乳动物细胞(每个细胞500–1,000种蛋白质)中超过3,000种蛋白质的定量。SCoPE2利用冻融循环实现细胞裂解,避免了对单细胞进行纯化的步骤,从而减少了样品损失,同时加快了样品制备速度并简化了自动化流程。此外,该方法使用等压载体,有助于蛋白质鉴定并减少样品损失。本视频协议提供了详细的指导,使研究者仅使用广泛可及的设备和试剂即可开展自动化单细胞蛋白质分析。我们演示了从细胞收获到进样进行液相色谱-串联质谱(LC-MS/MS)分析的蛋白质组学样品制备过程中的关键步骤。此外,观众还将了解等压载体实验设计的基本原理、等压载体与单细胞样品的质量控制方法,以及代表性结果与该方法局限性的讨论。 | 单细胞蛋白质组学分析需要具备高灵敏度、定量准确、广泛可及且稳健的方法。为满足这些要求,单细胞蛋白质组学(SCoPE2)技术被开发为第二代方法,可用于从少量样本(少至单个细胞)中定量数百至数千种蛋白质。采用该方法的实验已在10天的质谱仪运行时间内,实现了对1,500个单个哺乳动物细胞(每个细胞500–1,000种蛋白质)中超过3,000种蛋白质的定量。SCoPE2利用冻融循环实现细胞裂解,无需对单细胞进行纯化处理,从而减少了样品损失,同时加快了样品制备速度并简化了自动化流程。此外,该方法使用等压载体,有助于蛋白质鉴定并减少样品损失。本视频协议提供了详细指导,使研究者仅使用广泛可及的设备和试剂即可开展自动化的单细胞蛋白质分析。我们演示了从细胞收获到进样进行液相色谱-串联质谱(LC-MS/MS)分析的蛋白组学样品制备过程中的关键步骤。此外,还指导观众了解等压载体实验设计的原理、等压载体与单细胞样品的质量控制方法,以及代表性结果与该方法局限性的讨论。 | 单细胞蛋白质组学分析需要具备高灵敏度、定量准确、广泛可及且稳健的方法。为满足这些要求,单细胞蛋白质组学(SCoPE2)方案被开发为第二代技术,可用于从微量样本(少至单个细胞)中定量数百至数千种蛋白质。采用该方法的实验已在10天的质谱仪运行时间内,实现了对1,500个单个哺乳动物细胞(每个细胞500–1,000种蛋白质)中超过3,000种蛋白质的定量。SCoPE2利用冻融-加热循环实现细胞裂解,无需对单细胞进行纯化处理,从而减少了样品损失,同时加快了样品制备速度并简化了自动化流程。此外,该方法使用等压载体,有助于蛋白质鉴定并减少样品损失。本视频方案提供了详细操作指导,使研究者仅需使用广泛可及的设备和试剂即可开展自动化的单细胞蛋白质分析。我们演示了从细胞收获到进样进行液相色谱-串联质谱(LC-MS/MS)分析的蛋白质组学样品制备过程中的关键步骤。此外,观众还将学习等压载体实验设计的基本原理、等压载体与单细胞样品制备的质量控制方法,以及代表性结果与该方法局限性的讨论。 | 单细胞蛋白质组学 | 单细胞蛋白质组学分析需要具备高灵敏度、定量准确、广泛可及且稳健的方法。为满足这些要求,开发了单细胞蛋白质组学(SCoPE2)方案,作为第二代技术,可用于从微量样本(少至单个细胞)中定量数百至数千种蛋白质。采用该方法的实验已在10天的质谱仪运行时间内,实现了对1,500个单个哺乳动物细胞(每个细胞500–1,000种蛋白质)中超过3,000种蛋白质的定量。SCoPE2利用冻融循环实现细胞裂解,无需对单细胞进行纯化处理,从而减少了样品损失,同时加快了样品制备速度并简化了自动化流程。此外,该方法使用等压载体,有助于蛋白质鉴定并减少样品损失。本视频方案提供了详细操作指导,使研究者仅使用广泛可及的设备和试剂即可开展自动化单细胞蛋白质分析。我们演示了从细胞收获到进样进行液相色谱-串联质谱(LC-MS/MS)分析的单细胞蛋白质组学样品制备过程中的关键步骤。此外,还指导观众了解等压载体实验设计的原理、等压载体与单细胞样品的质量控制,以及代表性结果,并讨论了该方法的局限性。 | 单细胞蛋白质组学 | 单细胞蛋白质组学 | 单细胞蛋白质组学分析需要具备高灵敏度、定量准确、广泛可及且稳健的方法。为满足这些要求,单细胞蛋白质组学(SCoPE2)技术被开发为第二代方法,可用于从少量样本(少至单个细胞)中定量数百至数千种蛋白质。采用该方法的实验已在10天的质谱仪运行时间内,实现了对1,500个单个哺乳动物细胞(每个细胞500–1,000种蛋白质)中超过3,000种蛋白质的定量。SCoPE2利用冻融循环实现细胞裂解,避免了单细胞纯化步骤,从而减少了样品损失,同时加快了样品制备速度并简化了自动化流程。此外,该方法使用等压载体,有助于提高蛋白质鉴定效率并减少样品损失。本视频协议提供了详细的指导,使研究者仅使用广泛可及的设备和试剂即可开展自动化的单细胞蛋白质分析。我们演示了从细胞收获到进样进行液相色谱-串联质谱(LC-MS/MS)分析的蛋白质组学样品制备过程中的关键步骤。此外,视频还指导观众了解等压载体实验设计的原理、等压载体与单细胞样品的质量控制方法,并展示代表性结果,讨论该方法的局限性。 | - | 单细胞蛋白质组学 | 单细胞蛋白质组学分析需要具备高灵敏度、定量准确、广泛可及且稳健的方法。为满足这些要求,单细胞蛋白质组学(SCoPE2)技术被开发为第二代方法,可用于从少量样本(少至单个细胞)中定量数百至数千种蛋白质。采用该方法的实验已在10天的质谱仪运行时间内,实现了对1,500个单个哺乳动物细胞(每个细胞500–1,000种蛋白质)中超过3,000种蛋白质的定量。SCoPE2利用冻融循环实现细胞裂解,无需对单细胞进行纯化处理,从而减少了样品损失,同时加快了样品制备速度并简化了自动化流程。此外,该方法使用等压载体,有助于蛋白质鉴定并减少样品损失。本视频协议提供了详细指导,使研究者仅使用广泛可及的设备和试剂即可实现自动化的单细胞蛋白质分析。我们演示了从细胞收获到液相色谱-串联质谱(LC-MS/MS)分析进样前,用于蛋白质组学分析的单细胞制备过程中的关键步骤。此外,还指导观众了解等压载体实验设计的原理、等压载体与单细胞样品的质量控制,以及代表性结果与该方法局限性的讨论。 | + |
| C | 单细胞蛋白质组学分析需要具备高灵敏度、定量准确、广泛可及且稳健的方法。为满足这些要求,开发了第二代单细胞蛋白质组学(SCoPE2)方案,用于从少量样本(少至单个细胞)中定量数百至数千种蛋白质。采用该方法的实验已在10天的质谱仪运行时间内,实现了对1,500个单个哺乳动物细胞(每个细胞500–1,000种蛋白质)中超过3,000种蛋白质的定量。SCoPE2利用冻融-加热循环实现细胞裂解,省去了对单个细胞进行纯化的步骤,从而减少了样品损失,同时加快了样品制备速度并简化了自动化流程。此外,该方法使用等压载体,有助于提高蛋白质鉴定效率并减少样品损失。本视频方案提供了详细的指导,使研究者仅使用广泛可及的设备和试剂即可开展自动化的单细胞蛋白质分析。我们演示了从细胞收获到进样进行液相色谱-串联质谱(LC-MS/MS)分析的单细胞蛋白质组学样品制备过程中的关键步骤。此外,还指导观众了解等压载体实验设计的原理、等压载体与单细胞样品的质量控制,以及代表性结果与该方法局限性的讨论。 | - | 单细胞蛋白质组学分析需要具备高灵敏度、定量准确、广泛可及且稳健的方法。为满足这些要求,单细胞蛋白质组学(SCoPE2)方案被开发为第二代技术,可用于从微量样本(少至单个细胞)中定量数百至数千种蛋白质。采用该方法的实验已在10天的质谱仪运行时间内,实现了对1,500个单个哺乳动物细胞(每个细胞500–1,000种蛋白质)中超过3,000种蛋白质的定量。SCoPE2利用冻融-加热循环实现细胞裂解,无需对单细胞进行纯化处理,从而减少了样品损失,同时加快了样品制备速度并简化了自动化流程。此外,该方法使用等压载体,有助于蛋白质鉴定并减少样品损失。本视频方案提供了详细操作指导,使研究者仅需使用广泛可及的设备和试剂即可开展自动化的单细胞蛋白质分析。我们演示了从细胞收获到进样进行液相色谱-串联质谱(LC-MS/MS)分析的蛋白质组学样品制备过程中的关键步骤。此外,观众还将学习到有关等压载体实验设计的原理、等压载体与单细胞样品制备的质量控制方法,以及代表性结果与该方法局限性的讨论。 | - | 单细胞蛋白质组学 | 单细胞蛋白质组学分析需要具备高灵敏度、定量准确、广泛可及且稳健的方法。为满足这些要求,开发了第二代单细胞蛋白质组学(SCoPE2)方案,用于从微量样本(少至单个细胞)中定量数百至数千种蛋白质。采用该方法的实验已在10天的质谱仪运行时间内,实现了对1,500个单个哺乳动物细胞(每个细胞500–1,000种蛋白质)中超过3,000种蛋白质的定量。SCoPE2利用冻融循环实现细胞裂解,无需对单个细胞进行纯化处理,从而减少了样品损失,同时加快了样品制备速度并简化了自动化流程。此外,该方法使用等压载体,有助于蛋白质鉴定并减少样品损失。本视频方案提供了详细指导,使研究者仅使用广泛可及的设备和试剂即可开展自动化的单细胞蛋白质分析。我们演示了从细胞收获到液相色谱-串联质谱(LC-MS/MS)进样分析的单细胞蛋白质组学样品制备过程中的关键步骤。此外,还引导观众了解等压载体实验设计的原理、等压载体与单细胞样品制备的质量控制,以及代表性结果与该方法局限性的讨论。 | 单细胞蛋白质组学 | + | 单细胞蛋白质组学 | - | 单细胞蛋白质组学 | 单细胞蛋白质组学 | 单细胞蛋白质组学分析需要具备高灵敏度、定量准确、广泛可及且稳健的方法。为满足这些要求,单细胞蛋白质组学(SCoPE2)技术被开发为第二代方法,可用于从少量样本(少至单个细胞)中定量数百至数千种蛋白质。采用该方法的实验已在10天的质谱仪运行时间内,实现了对1,500个单个哺乳动物细胞(每个细胞500–1,000种蛋白质)中超过3,000种蛋白质的定量。SCoPE2利用冻融循环实现细胞裂解,无需对单个细胞进行纯化处理,从而减少了样品损失,同时加快了样品制备速度并简化了自动化流程。此外,该方法使用等压载体,有助于蛋白质鉴定并减少样品损失。本视频协议提供了详细的指导,使研究者仅使用广泛可及的设备和试剂即可开展自动化的单细胞蛋白质分析。我们演示了从细胞收获到进样进行液相色谱-串联质谱(LC-MS/MS)分析的单细胞蛋白质组学样品制备过程中的关键步骤。此外,观众还将了解等压载体实验设计的基本原理、等压载体与单细胞样品制备的质量控制方法,以及代表性结果与该方法局限性的讨论。 | 单细胞蛋白质组学分析需要具备高灵敏度、定量准确、广泛可及且稳健的方法。为满足这些要求,单细胞蛋白质组学(SCoPE2)技术被开发为第二代方法,可用于从微量样本(少至单个细胞)中定量数百至数千种蛋白质。采用该方法的实验已在10天的质谱仪运行时间内,实现了对1,500个单个哺乳动物细胞中超过3,000种蛋白质的定量分析(每个细胞500–1,000种蛋白质)。SCoPE2利用冻融-加热循环实现细胞裂解,无需对单细胞进行纯化处理,从而减少了样品损失,同时加快了样品制备速度并简化了自动化流程。此外,该方法使用等压载体,有助于蛋白质鉴定并减少样品损失。本视频协议提供了详细的指导,使研究者仅使用广泛可及的设备和试剂即可开展自动化的单细胞蛋白质分析。我们演示了从细胞收获到液相色谱-串联质谱(LC-MS/MS)分析进样的单细胞蛋白组学分析准备过程中的关键步骤。此外,还向观众介绍了等压载体实验设计的基本原理、等压载体与单细胞样品的质量控制方法,以及代表性结果,并讨论了该方法的局限性。 | + | 单细胞蛋白质组学 | - | 单细胞蛋白质组学分析需要具备高灵敏度、定量准确、广泛可及且稳健的方法。为满足这些要求,开发了第二代单细胞蛋白质组学(SCoPE2)方案,用于从少量样本(少至单个细胞)中定量数百至数千种蛋白质。采用该方法的实验已在10天的质谱仪运行时间内,实现了对1,500个单个哺乳动物细胞(每个细胞500–1,000种蛋白质)中超过3,000种蛋白质的定量。SCoPE2利用冻融-加热循环实现细胞裂解,无需对单细胞进行纯化处理,从而减少了样品损失,同时加快了样品制备速度并简化了自动化流程。此外,该方法使用等压载体,有助于蛋白质鉴定并减少样品损失。本视频协议提供了详细的指导,使研究者仅使用广泛可及的设备和试剂即可开展自动化的单细胞蛋白质分析。我们演示了从细胞收获到进样进行液相色谱-串联质谱(LC-MS/MS)分析的单细胞蛋白质组学样品制备过程中的关键步骤。此外,还指导观众了解等压载体实验设计的原理、等压载体与单细胞样品制备的质量控制,以及代表性结果与该方法局限性的讨论。 | 单细胞蛋白质组学 | 单细胞蛋白质组学 | 单细胞蛋白质组学分析需要具备高灵敏度、定量准确、广泛可及且稳健的方法。为满足这些要求,开发了单细胞蛋白质组学(SCoPE2)方案,作为第二代技术,用于从微量样本(少至单个细胞)中定量数百至数千种蛋白质。采用该方法的实验已在10天的质谱仪运行时间内,实现了对1,500个单个哺乳动物细胞(每个细胞500–1,000种蛋白质)中超过3,000种蛋白质的定量。SCoPE2利用冻融循环实现细胞裂解,无需对单细胞进行纯化处理,从而减少了样品损失,同时加快了样品制备速度并简化了自动化操作。此外,该方法使用等压载体,有助于蛋白质鉴定并减少样品损失。本视频协议提供了详细的指导,以便仅使用广泛可及的设备和试剂即可实现自动化的单细胞蛋白质分析。我们演示了从细胞收获到进样进行液相色谱-串联质谱(LC-MS/MS)分析的蛋白质组学样品制备过程中的关键步骤。此外,还指导观众了解等压载体实验设计的原理、等压载体与单细胞样品制备的质量控制,以及代表性结果与该方法局限性的讨论。 | 单细胞蛋白质组学 | 单细胞蛋白质组学 | - |
| D | 单细胞蛋白质组学 | 单细胞蛋白质组学分析需要具备高灵敏度、定量准确、广泛可及且稳健的方法。为满足这些要求,开发了第二代单细胞蛋白质组学(SCoPE2)方案,用于从少量样本(少至单个细胞)中定量数百至数千种蛋白质。采用该方法的实验已在10天的质谱仪运行时间内,实现了对1,500个单个哺乳动物细胞(每个细胞500–1,000种蛋白质)中超过3,000种蛋白质的定量。SCoPE2利用冻融循环实现细胞裂解,无需对单个细胞进行纯化步骤,从而减少了样品损失,同时加快了样品制备并简化了自动化流程。此外,该方法使用等压载体,有助于蛋白质鉴定并减少样品损失。本视频方案提供了详细的指导,使研究者仅使用广泛可及的设备和试剂即可开展自动化的单细胞蛋白质分析。我们演示了从细胞收获到进样进行液相色谱-串联质谱(LC-MS/MS)分析的单细胞蛋白质组学样品制备过程中的关键步骤。此外,还指导观众了解等压载体实验设计的原理、等压载体与单细胞样品的质量控制,以及代表性结果,并讨论了该方法的局限性。 | 单细胞蛋白质组学分析需要具备高灵敏度、定量准确、广泛可及且稳健的方法。为满足这些要求,单细胞蛋白质组学(SCoPE2)技术被开发为第二代方法,可用于从少量样本(少至单个细胞)中定量数百至数千种蛋白质。采用该方法的实验已在10天的质谱仪运行时间内,实现了对1,500个单个哺乳动物细胞(每个细胞500–1,000种蛋白质)中超过3,000种蛋白质的定量。SCoPE2利用冻融-加热循环实现细胞裂解,无需对单细胞进行纯化处理,从而减少了样品损失,同时加快了样品制备速度并简化了自动化流程。此外,该方法使用等压载体,有助于蛋白质鉴定并减少样品损失。本视频协议提供了详细指导,使研究者仅使用广泛可及的设备和试剂即可开展自动化单细胞蛋白质分析。我们演示了从细胞收获到进样进行液相色谱-串联质谱(LC-MS/MS)分析的单细胞蛋白质组学样品制备过程中的关键步骤。此外,视频还指导观众了解等压载体实验设计的原理、等压载体与单细胞样品的质量控制方法,并展示代表性结果,讨论该方法的局限性。 | 单细胞蛋白质组学分析需要具备高灵敏度、定量准确、广泛可及且稳健的方法。为满足这些要求,单细胞蛋白质组学(SCoPE2)技术被开发为第二代方法,可用于从微量样本(少至单个细胞)中定量数百至数千种蛋白质。采用该方法的实验已在10天的质谱仪运行时间内,实现了对1,500个单个哺乳动物细胞(每个细胞500–1,000种蛋白质)中超过3,000种蛋白质的定量。SCoPE2利用冻融循环实现细胞裂解,免除了对单细胞样本进行纯化的步骤,从而减少了样本损失,同时加快了样本制备速度并简化了自动化流程。此外,该方法使用等压载体,有助于蛋白质鉴定并减少样本损失。本视频协议提供了详细的指导,使研究者仅使用广泛可及的设备和试剂即可实现自动化单细胞蛋白质分析。我们演示了从细胞收获到进样进行液相色谱-串联质谱(LC-MS/MS)分析的单细胞蛋白质组学样本制备过程中的关键步骤。此外,观众还将了解等压载体实验设计的原理、等压载体与单细胞样本的质量控制方法,以及代表性结果与该方法局限性的讨论。 | 单细胞蛋白质组学分析需要具备高灵敏度、定量准确、广泛可及且稳健的方法。为满足这些要求,单细胞蛋白质组学(SCoPE2)方案被开发为第二代技术,可用于从微量样本(少至单个细胞)中定量数百至数千种蛋白质。采用该方法的实验已在10天的质谱仪运行时间内,实现了对1,500个单个哺乳动物细胞(每个细胞500–1,000种蛋白质)中超过3,000种蛋白质的定量。SCoPE2利用冻融-加热循环实现细胞裂解,省去了单细胞纯化步骤,从而减少了样品损失,同时加快了样品制备速度并简化了自动化流程。此外,该方法使用等压载体,有助于蛋白质鉴定并减少样品损失。本视频方案提供了详细指导,使研究者仅需使用广泛可及的设备和试剂即可开展自动化的单细胞蛋白质分析。我们演示了从细胞收获到进样进行液相色谱-串联质谱(LC-MS/MS)分析的蛋白质组学样品制备过程中的关键步骤。此外,观众还将学习到有关等压载体的实验设计原理、等压载体与单细胞样品的质量控制方法,以及代表性结果与该方法局限性的讨论。 | 单细胞蛋白质组学 | - | 单细胞蛋白质组学分析需要具备高灵敏度、定量准确、广泛可及且稳健的方法。为满足这些要求,单细胞蛋白质组学(SCoPE2)方案被开发为第二代技术,可用于从微量样本(少至单个细胞)中定量数百至数千种蛋白质。采用该方法的实验已在10天的质谱仪运行时间内,实现了对1,500个单个哺乳动物细胞(每个细胞500–1,000种蛋白质)中超过3,000种蛋白质的定量。SCoPE2利用冻融-加热循环实现细胞裂解,无需对单细胞进行纯化处理,从而减少了样品损失,同时加快了样品制备速度并简化了自动化流程。此外,该方法使用等压载体,有助于蛋白质鉴定并减少样品损失。本视频方案提供了详细操作指南,使研究者仅需使用广泛可及的设备和试剂即可开展自动化的单细胞蛋白质分析。我们演示了从细胞收获到进样进行液相色谱-串联质谱(LC-MS/MS)分析的蛋白质组学样品制备过程中的关键步骤。此外,观众还将了解等压载体实验设计的基本原理、等压载体与单细胞样品制备的质量控制方法,以及代表性结果与该方法局限性的讨论。 | 单细胞蛋白质组学 | 单细胞蛋白质组学 | 单细胞蛋白质组学 | + | 单细胞蛋白质组学分析需要具备高灵敏度、定量准确、广泛可及且稳健的方法。为满足这些要求,开发了第二代单细胞蛋白质组学(SCoPE2)方案,用于从少量样本(少至单个细胞)中定量数百至数千种蛋白质。采用该方法的实验已在10天的质谱仪运行时间内,实现了对1,500个单个哺乳动物细胞(每个细胞500–1,000种蛋白质)中超过3,000种蛋白质的定量。SCoPE2利用冻融循环实现细胞裂解,免除了对单细胞进行纯化的步骤,从而减少了样品损失,同时加快了样品制备并简化了自动化操作。此外,该方法使用等压载体,有助于蛋白质鉴定并减少样品损失。本视频方案提供了详细的指导,使研究者仅使用广泛可及的设备和试剂即可开展自动化的单细胞蛋白质分析。我们演示了从细胞收获到进样进行液相色谱-串联质谱(LC-MS/MS)分析的蛋白质组学样品制备过程中的关键步骤。此外,还指导观众了解等压载体实验设计的原理、等压载体与单细胞样品制备的质量控制,以及代表性结果,并讨论了该方法的局限性。 | - | 单细胞蛋白质组学 | 单细胞蛋白质组学 | 单细胞蛋白质组学 | 单细胞蛋白质组学 | 单细胞蛋白质组学 | 单细胞蛋白质组学分析需要具备高灵敏度、定量准确、广泛可及且稳健的方法。为满足这些要求,单细胞蛋白质组学(SCoPE2)方案被开发为第二代技术,可用于从微量样本(少至单个细胞)中定量数百至数千种蛋白质。采用该方法的实验已在10天的质谱仪运行时间内,实现了对1,500个单个哺乳动物细胞(每个细胞500–1,000种蛋白质)中超过3,000种蛋白质的定量。SCoPE2利用冻融-加热循环实现细胞裂解,无需对单细胞进行纯化处理,从而减少了样品损失,同时加快了样品制备速度并简化了自动化流程。此外,该方法使用等压载体,有助于蛋白质鉴定并减少样品损失。本视频方案提供了详细操作指导,使研究者仅需使用广泛可及的设备和试剂即可开展自动化的单细胞蛋白质分析。我们演示了从细胞收获到进样进行液相色谱-串联质谱(LC-MS/MS)分析的蛋白质组学样品制备过程中的关键步骤。此外,观众还将学习到有关等压载体实验设计的原理、等压载体与单细胞样品制备的质量控制方法,以及代表性结果与该方法局限性的讨论。 | 单细胞蛋白质组学 | 单细胞蛋白质组学 | 单细胞蛋白质组学 | 单细胞蛋白质组学 |
| E | 单细胞蛋白质组学分析需要具备高灵敏度、定量准确、广泛可及且稳健的方法。为满足这些要求,单细胞蛋白质组学(SCoPE2)方案被开发为第二代技术,可用于从微量样本(少至单个细胞)中定量数百至数千种蛋白质。采用该方法的实验已在10天的质谱仪运行时间内,实现了对1,500个单个哺乳动物细胞(每个细胞500–1,000种蛋白质)中超过3,000种蛋白质的定量。SCoPE2利用冻融循环实现细胞裂解,无需对单细胞进行纯化处理,从而减少了样品损失,同时加快了样品制备速度并简化了自动化流程。此外,该方法使用等压载体,有助于蛋白质鉴定并减少样品损失。本视频方案提供了详细的指导,使研究者仅使用广泛可及的设备和试剂即可开展自动化的单细胞蛋白质分析。我们演示了从细胞收获到进样进行液相色谱-串联质谱(LC-MS/MS)分析的蛋白组学样品制备关键步骤。此外,还指导观众了解等压载体实验设计的原理、等压载体与单细胞样品的质量控制,以及代表性结果与该方法局限性的讨论。 | 单细胞蛋白质组学分析需要具备高灵敏度、定量准确、广泛可及且稳健的方法。为满足这些要求,单细胞蛋白质组学(SCoPE2)技术被开发为第二代方法,可用于从少量样本(少至单个细胞)中定量数百至数千种蛋白质。采用该方法的实验已在10天的质谱仪运行时间内,实现了对1,500个单个哺乳动物细胞(每个细胞500–1,000种蛋白质)中超过3,000种蛋白质的定量。SCoPE2利用冻融循环实现细胞裂解,避免了对单细胞进行纯化的步骤,从而减少了样品损失,同时加快了样品制备速度并简化了自动化流程。此外,该方法使用等压载体,有助于蛋白质鉴定并减少样品损失。本视频协议提供了详细的指导,使研究者仅使用广泛可及的设备和试剂即可开展自动化单细胞蛋白质分析。我们演示了从细胞收获到进样进行液相色谱-串联质谱(LC-MS/MS)分析的蛋白质组学样品制备过程中的关键步骤。此外,观众还将了解等压载体实验设计的基本原理、等压载体与单细胞样品的质量控制方法,以及代表性结果与该方法局限性的讨论。 | 单细胞蛋白质组学分析需要具备高灵敏度、定量准确、广泛可及且稳健的方法。为满足这些要求,单细胞蛋白质组学(SCoPE2)技术被开发为第二代方法,可用于从微量样本(少至单个细胞)中定量数百至数千种蛋白质。采用该方法的实验已在10天的质谱仪运行时间内,实现了对1,500个单个哺乳动物细胞中超过3,000种蛋白质的定量分析(每个细胞500–1,000种蛋白质)。SCoPE2利用冻融-加热循环实现细胞裂解,无需对单细胞进行纯化处理,从而减少了样品损失,同时加快了样品制备速度并简化了自动化流程。此外,该方法使用等压载体,有助于蛋白质鉴定并减少样品损失。本视频协议提供了详细的指导,使研究者仅使用广泛可及的设备和试剂即可开展自动化的单细胞蛋白质分析。我们演示了从细胞收获到液相色谱-串联质谱(LC-MS/MS)分析进样的单细胞蛋白质组学样品制备过程中的关键步骤。此外,还指导观众了解等压载体实验设计的原理、等压载体与单细胞样品制备的质量控制,以及代表性结果,并讨论了该方法的局限性。 | 单细胞蛋白质组学分析需要具备高灵敏度、定量准确、广泛可及且稳健的方法。为满足这些要求,单细胞蛋白质组学(SCoPE2)技术被开发为第二代方法,可用于从少量样本(少至单个细胞)中定量数百至数千种蛋白质。采用该方法的实验已在10天的质谱仪运行时间内,实现了对1,500个单个哺乳动物细胞(每个细胞500–1,000种蛋白质)中超过3,000种蛋白质的定量。SCoPE2利用冻融循环实现细胞裂解,无需对单个细胞进行纯化处理,从而减少了样本损失,同时加快了样本制备速度并简化了自动化流程。此外,该方法使用等压载体,有助于蛋白质鉴定并减少样本损失。本视频协议提供了详细操作指导,使研究者仅使用广泛可及的设备和试剂即可开展自动化单细胞蛋白质分析。我们演示了从细胞收获到进样进行液相色谱-串联质谱(LC-MS/MS)分析的单细胞蛋白质组学样本制备过程中的关键步骤。此外,视频还指导观众了解等压载体实验设计的原理、等压载体与单细胞样本制备的质量控制,以及代表性结果,并讨论了该方法的局限性。 | 单细胞蛋白质组学分析需要具备高灵敏度、定量准确、广泛可及且稳健的方法。为满足这些要求,单细胞蛋白质组学(SCoPE2)技术被开发为第二代方法,可用于从微量样本(少至单个细胞)中定量数百至数千种蛋白质。采用该方法的实验已在10天的质谱仪运行时间内,实现了对1,500个单个哺乳动物细胞中超过3,000种蛋白质的定量分析(每个细胞500–1,000种蛋白质)。SCoPE2利用冻融-加热循环实现细胞裂解,无需对单细胞进行纯化处理,从而减少了样品损失,同时加快了样品制备速度并简化了自动化流程。此外,该方法使用等压载体,有助于蛋白质鉴定并减少样品损失。本视频协议提供了详细的指导,使研究者仅使用广泛可及的设备和试剂即可开展自动化的单细胞蛋白质分析。我们演示了从细胞收获到液相色谱-串联质谱(LC-MS/MS)分析进样的单细胞蛋白质组学样品制备过程中的关键步骤。此外,还指导观众了解等压载体实验设计的原理、等压载体与单细胞样品制备的质量控制,以及代表性结果,并讨论了该方法的局限性。 | 单细胞蛋白质组学(SCoPE2):利用等压载体进行自动化单细胞蛋白质分析 | 单细胞蛋白质组学分析需要具备高灵敏度、定量准确、广泛可及且稳健的方法。为满足这些要求,开发了单细胞蛋白质组学(SCoPE2)方案,作为第二代技术,可用于从微量样本(少至单个细胞)中定量数百至数千种蛋白质。采用该方法的实验已在10天的质谱仪运行时间内,实现了对1,500个单个哺乳动物细胞(每个细胞500–1,000种蛋白质)中超过3,000种蛋白质的定量。SCoPE2利用冻融循环实现细胞裂解,无需对单细胞进行纯化处理,从而减少了样品损失,同时加快了样品制备速度并简化了自动化流程。此外,该方法使用等压载体,有助于提高蛋白质鉴定效率并减少样品损失。本视频方案提供了详细的指导,使研究者仅使用广泛可及的设备和试剂即可开展自动化单细胞蛋白质分析。我们演示了从细胞收获到液相色谱-串联质谱(LC-MS/MS)分析注射的单细胞蛋白质组学分析准备过程中的关键步骤。此外,还指导观众了解等压载体实验设计的原理、等压载体与单细胞样品制备的质量控制,以及代表性结果,并讨论了该方法的局限性。 | 单细胞蛋白质组学 | 单细胞蛋白质组学 | 单细胞蛋白质组学分析需要具备高灵敏度、定量准确、广泛可及且稳健的方法。为满足这些要求,单细胞蛋白质组学(SCoPE2)方案被开发为第二代技术,可用于从微量样本(少至单个细胞)中定量数百至数千种蛋白质。采用该方法的实验已在10天的质谱仪运行时间内,实现了对1,500个单个哺乳动物细胞(每个细胞500–1,000种蛋白质)中超过3,000种蛋白质的定量。SCoPE2利用冻融-加热循环实现细胞裂解,省去了单细胞纯化步骤,从而减少了样品损失,同时加快了样品制备速度并简化了自动化流程。此外,该方法使用等压载体,有助于蛋白质鉴定并减少样品损失。本视频方案提供了详细操作指导,使研究者仅需使用广泛可及的设备和试剂即可开展自动化的单细胞蛋白质分析。我们演示了从细胞收获到进样进行液相色谱-串联质谱(LC-MS/MS)分析的蛋白质组学样品制备过程中的关键步骤。此外,观众还将了解等压载体实验设计的基本原理、等压载体与单细胞样品制备的质量控制方法,以及代表性结果与该方法局限性的讨论。 | 单细胞蛋白质组学 | 单细胞蛋白质组学 | 单细胞蛋白质组学 | 单细胞蛋白质组学 | + | 单细胞蛋白质组学 | 单细胞蛋白质组学分析需要具备高灵敏度、定量准确、广泛可及且稳健的方法。为满足这些要求,单细胞蛋白质组学(SCoPE2)方案被开发为第二代技术,可用于从微量样本(少至单个细胞)中定量数百至数千种蛋白质。采用该方法的实验已在10天的质谱仪运行时间内,实现了对1,500个单个哺乳动物细胞(每个细胞500–1,000种蛋白质)中超过3,000种蛋白质的定量。SCoPE2利用冻融-加热循环实现细胞裂解,省去了单细胞纯化步骤,从而减少了样品损失,同时加快了样品制备速度并简化了自动化流程。此外,该方法使用等压载体,有助于蛋白质鉴定并减少样品损失。本视频方案提供了详细操作指导,使研究者仅需使用广泛可及的设备和试剂即可开展自动化的单细胞蛋白质分析。我们演示了从细胞收获到进样进行液相色谱-串联质谱(LC-MS/MS)分析的蛋白质组学样品制备过程中的关键步骤。此外,观众还将了解等压载体实验设计的基本原理、等压载体与单细胞样品制备的质量控制方法,以及代表性结果与该方法局限性的讨论。 | 单细胞蛋白质组学分析需要具备高灵敏度、定量准确、广泛可及且稳健的方法。为满足这些要求,单细胞蛋白质组学(SCoPE2)方案被开发为第二代技术,可用于从微量样本(少至单个细胞)中定量数百至数千种蛋白质。采用该方法的实验已在10天的质谱仪运行时间内,实现了对1,500个单个哺乳动物细胞(每个细胞500–1,000种蛋白质)中超过3,000种蛋白质的定量。SCoPE2利用冻融-加热循环实现细胞裂解,无需对单细胞进行纯化处理,从而减少了样品损失,同时加快了样品制备速度并简化了自动化流程。此外,该方法使用等压载体,有助于蛋白质鉴定并进一步降低样品损失。本视频方案提供了详细操作指导,使研究者仅需使用广泛可及的设备和试剂即可开展自动化的单细胞蛋白质分析。我们演示了从细胞收获到进样进行液相色谱-串联质谱(LC-MS/MS)分析的蛋白质组学样品制备过程中的关键步骤。此外,观众还将学习到有关等压载体实验设计的原理、等压载体与单细胞样品的质量控制方法,以及代表性结果与该方法局限性的讨论。 | 单细胞蛋白质组学 | 单细胞蛋白质组学 | - | 单细胞蛋白质组学分析需要具备高灵敏度、定量准确、广泛可及且稳健的方法。为满足这些要求,单细胞蛋白质组学(SCoPE2)方案被开发为第二代技术,可用于从微量样本(少至单个细胞)中定量数百至数千种蛋白质。采用该方法的实验已在10天的质谱仪运行时间内,实现了对1,500个单个哺乳动物细胞(每个细胞500–1,000种蛋白质)中超过3,000种蛋白质的定量。SCoPE2利用冻融-加热循环实现细胞裂解,无需对单细胞进行纯化处理,从而减少了样品损失,同时加快了样品制备速度并简化了自动化流程。此外,该方法使用等压载体,有助于蛋白质鉴定并减少样品损失。本视频方案提供了详细操作指导,使研究者仅需使用广泛可及的设备和试剂即可开展自动化的单细胞蛋白质分析。我们演示了从细胞收获到进样进行液相色谱-串联质谱(LC-MS/MS)分析的蛋白质组学样品制备过程中的关键步骤。此外,观众还将了解等压载体实验设计的基本原理、等压载体与单细胞样品制备的质量控制方法,以及代表性结果与该方法局限性的讨论。 | 单细胞蛋白质组学 | |
| F | 单细胞蛋白质组学分析需要具备高灵敏度、定量准确、广泛可及且稳健的方法。为满足这些要求,单细胞蛋白质组学(SCoPE2)方案被开发为第二代技术,可用于从微量样本(少至单个细胞)中定量数百至数千种蛋白质。采用该方法的实验已在10天的质谱仪运行时间内,实现了对1,500个单个哺乳动物细胞(每个细胞500–1,000种蛋白质)中超过3,000种蛋白质的定量。SCoPE2利用冻融-加热循环实现细胞裂解,无需对单细胞进行纯化处理,从而减少了样品损失,同时加快了样品制备速度并简化了自动化流程。此外,该方法使用等压载体,有助于蛋白质鉴定并减少样品损失。本视频方案提供了详细操作指导,使研究者仅需使用广泛可及的设备和试剂即可开展自动化的单细胞蛋白质分析。我们演示了从细胞收获到进样进行液相色谱-串联质谱(LC-MS/MS)分析的蛋白质组学样品制备过程中的关键步骤。此外,观众还将学习到有关等压载体实验设计的原理、等压载体与单细胞样品制备的质量控制方法,以及代表性结果与该方法局限性的讨论。 | 单细胞蛋白质组学 | 单细胞蛋白质组学 | 单细胞蛋白质组学 | 单细胞蛋白质组学分析需要具备高灵敏度、定量准确、广泛可及且稳健的方法。为满足这些要求,单细胞蛋白质组学(SCoPE2)方案被开发为第二代技术,可用于从微量样本(少至单个细胞)中定量数百至数千种蛋白质。采用该方法的实验已在10天的质谱仪运行时间内,实现了对1,500个单个哺乳动物细胞(每个细胞500–1,000种蛋白质)中超过3,000种蛋白质的定量。SCoPE2利用冻融-加热循环实现细胞裂解,省去了单细胞纯化步骤,从而减少了样品损失,同时加快了样品制备速度并简化了自动化流程。此外,该方法使用等压载体,有助于蛋白质鉴定并减少样品损失。本视频方案提供了详细操作指导,使研究者仅需使用广泛可及的设备和试剂即可开展自动化的单细胞蛋白质分析。我们演示了从细胞收获到进样进行液相色谱-串联质谱(LC-MS/MS)分析的蛋白质组学样品制备过程中的关键步骤。此外,观众还将了解等压载体实验设计的基本原理、等压载体与单细胞样品的质量控制方法,以及代表性结果与该方法局限性的讨论。 | 单细胞蛋白质组学分析需要具备高灵敏度、定量准确、广泛可及且稳健的方法。为满足这些要求,开发了第二代单细胞蛋白质组学(SCoPE2)方案,用于从少量样本(少至单个细胞)中定量数百至数千种蛋白质。采用该方法的实验已在10天的质谱仪运行时间内,实现了对1,500个单个哺乳动物细胞中超过3,000种蛋白质的定量(每个细胞500–1,000种蛋白质)。SCoPE2利用冻融循环实现细胞裂解,省去了单细胞纯化步骤,从而减少了样品损失,同时加快了样品制备速度并简化了自动化流程。此外,该方法使用等压载体,有助于蛋白质鉴定并减少样品损失。本视频方案提供了详细的指导,使研究者仅使用广泛可及的设备和试剂即可开展自动化的单细胞蛋白质分析。我们演示了从细胞收获到进样进行液相色谱-串联质谱(LC-MS/MS)分析的单细胞蛋白质组学样品制备过程中的关键步骤。此外,还指导观众了解等压载体实验设计的原理、等压载体与单细胞样品制备的质量控制,以及代表性结果与该方法局限性的讨论。 | 单细胞蛋白质组学分析需要具备高灵敏度、定量准确、广泛可及且稳健的方法。为满足这些要求,单细胞蛋白质组学(SCoPE2)方案被开发为第二代技术,可用于从微量样本(少至单个细胞)中定量数百至数千种蛋白质。采用该方法的实验已在10天的质谱仪运行时间内,实现了对1,500个单个哺乳动物细胞(每个细胞500–1,000种蛋白质)中超过3,000种蛋白质的定量。SCoPE2利用冻融-加热循环实现细胞裂解,无需对单细胞进行纯化处理,从而减少了样品损失,同时加快了样品制备速度并简化了自动化流程。此外,该方法使用等压载体,有助于蛋白质鉴定并减少样品损失。本视频方案提供了详细操作指导,使研究者仅需使用广泛可及的设备和试剂即可开展自动化的单细胞蛋白质分析。我们演示了从细胞收获到进样进行液相色谱-串联质谱(LC-MS/MS)分析的蛋白质组学样品制备过程中的关键步骤。此外,观众还将学习到有关等压载体实验设计的原理、等压载体与单细胞样品制备的质量控制方法,以及代表性结果与该方法局限性的讨论。 | 单细胞蛋白质组学分析需要具备高灵敏度、定量准确、广泛可及且稳健的方法。为满足这些要求,单细胞蛋白质组学(SCoPE2)技术被开发为第二代方法,可用于从微量样本(少至单个细胞)中定量数百至数千种蛋白质。采用该方法的实验已在10天的质谱仪运行时间内,实现了对1,500个单个哺乳动物细胞(每个细胞500–1,000种蛋白质)中超过3,000种蛋白质的定量。SCoPE2利用冻融循环实现细胞裂解,无需对单细胞进行纯化处理,从而减少了样品损失,同时加快了样品制备速度并简化了自动化流程。此外,该方法使用等压载体,有助于提高蛋白质鉴定效率并减少样品损失。本视频协议提供了详细操作指南,使研究者仅使用广泛可及的设备和试剂即可开展自动化的单细胞蛋白质分析。我们演示了从细胞收获到进样进行液相色谱-串联质谱(LC-MS/MS)分析的单细胞蛋白质组学样品制备过程中的关键步骤。此外,还指导观众了解等压载体实验设计的基本原理、等压载体与单细胞样品的质量控制,以及代表性结果,并讨论了该方法的局限性。 | - | 单细胞蛋白质组学分析需要具备高灵敏度、定量准确、广泛可及且稳健的方法。为满足这些要求,单细胞蛋白质组学(SCoPE2)技术被开发为第二代方法,可用于从少量样本(少至单个细胞)中定量数百至数千种蛋白质。采用该方法的实验已在10天的质谱仪运行时间内,实现了对1,500个单个哺乳动物细胞(每个细胞500–1,000种蛋白质)中超过3,000种蛋白质的定量。SCoPE2利用冻融循环实现细胞裂解,避免了对单细胞进行纯化的步骤,从而减少了样品损失,同时加快了样品制备速度并简化了自动化流程。此外,该方法使用等压载体,有助于蛋白质鉴定并减少样品损失。本视频协议提供了详细的指导,使研究者仅使用广泛可及的设备和试剂即可开展自动化单细胞蛋白质分析。我们演示了从细胞收获到进样进行液相色谱-串联质谱(LC-MS/MS)分析的蛋白质组学样品制备过程中的关键步骤。此外,观众还将了解等压载体实验设计的基本原理、等压载体与单细胞样品的质量控制方法,以及代表性结果与该方法局限性的讨论。 | 单细胞蛋白质组学分析需要具备高灵敏度、定量准确、广泛可及且稳健的方法。为满足这些要求,单细胞蛋白质组学(SCoPE2)方案被开发为第二代技术,可用于从微量样本(少至单个细胞)中定量数百至数千种蛋白质。采用该方法的实验已在10天的质谱仪运行时间内,实现了对1,500个单个哺乳动物细胞(每个细胞500–1,000种蛋白质)中超过3,000种蛋白质的定量。SCoPE2利用冻融-加热循环实现细胞裂解,省去了单细胞纯化步骤,从而减少了样品损失,同时加快了样品制备速度并简化了自动化流程。此外,该方法使用等压载体,有助于蛋白质鉴定并减少样品损失。本视频方案提供了详细操作指导,使研究者仅需使用广泛可及的设备和试剂即可开展自动化的单细胞蛋白质分析。我们演示了从细胞收获到进样进行液相色谱-串联质谱(LC-MS/MS)分析的蛋白质组学样品制备过程中的关键步骤。此外,观众还将学习等压载体实验设计的基本原理、等压载体及单细胞样品制备的质量控制方法,以及代表性结果与该方法局限性的讨论。 | 单细胞蛋白质组学分析需要具备高灵敏度、定量准确、广泛可及且稳健的方法。为满足这些要求,单细胞蛋白质组学(SCoPE2)技术被开发为第二代方法,可用于从少量样本(少至单个细胞)中定量数百至数千种蛋白质。采用该方法的实验已在10天的质谱仪运行时间内,实现了对1,500个单个哺乳动物细胞(每个细胞500–1,000种蛋白质)中超过3,000种蛋白质的定量。SCoPE2利用冻融循环实现细胞裂解,无需对单细胞进行纯化处理,从而减少了样品损失,同时加快了样品制备速度并简化了自动化流程。此外,该方法使用等压载体,有助于蛋白质鉴定并减少样品损失。本视频协议提供了详细的指导,使研究者仅使用广泛可及的设备和试剂即可开展自动化的单细胞蛋白质分析。我们演示了从细胞收获到液相色谱-串联质谱(LC-MS/MS)进样分析的单细胞蛋白质组学样品制备过程中的关键步骤。此外,还指导观众了解等压载体实验设计的原理、等压载体与单细胞样品制备的质量控制,以及代表性结果,并讨论了该方法的局限性。 | 单细胞蛋白质组学分析需要具备高灵敏度、定量准确、广泛可及且稳健的方法。为满足这些要求,开发了第二代单细胞蛋白质组学(SCoPE2)方案,用于从少量样本(少至单个细胞)中定量数百至数千种蛋白质。采用该方法的实验已在10天的质谱仪运行时间内,实现了对1,500个单个哺乳动物细胞(每个细胞500–1,000种蛋白质)中超过3,000种蛋白质的定量。SCoPE2利用冻融循环实现细胞裂解,无需对单个细胞进行纯化处理,从而减少了样品损失,同时加快了样品制备速度并简化了自动化流程。此外,该方法使用等压载体,有助于蛋白质鉴定并减少样品损失。本视频方案提供了详细的指导,使研究者仅使用广泛可及的设备和试剂即可开展自动化的单细胞蛋白质分析。我们演示了从细胞收获到进样进行液相色谱-串联质谱(LC-MS/MS)分析的蛋白质组学样品制备过程中的关键步骤。此外,还指导观众了解等压载体实验设计的原理、等压载体与单细胞样品制备的质量控制,以及代表性结果,并讨论了该方法的局限性。 | + | 单细胞蛋白质组学 | 单细胞蛋白质组学分析需要具备高灵敏度、定量准确、广泛可及且稳健的方法。为满足这些要求,单细胞蛋白质组学(SCoPE2)技术被开发为第二代方法,可用于从少量样本(少至单个细胞)中定量数百至数千种蛋白质。采用该方法的实验已在10天的质谱仪运行时间内,实现了对1,500个单个哺乳动物细胞(每个细胞500–1,000种蛋白质)中超过3,000种蛋白质的定量。SCoPE2利用冻融循环实现细胞裂解,无需对单细胞进行纯化处理,从而减少了样品损失,同时加快了样品制备速度并简化了自动化流程。此外,该方法使用等压载体,有助于蛋白质鉴定并减少样品损失。本视频协议提供了详细的指导,使研究者仅使用广泛可及的设备和试剂即可开展自动化单细胞蛋白质分析。我们演示了从细胞收获到进样进行液相色谱-串联质谱(LC-MS/MS)分析的单细胞蛋白质组学样品制备过程中的关键步骤。此外,还指导观众了解等压载体实验设计的原理、等压载体与单细胞样品的质量控制,以及代表性结果与该方法局限性的讨论。 | 单细胞蛋白质组学分析需要具备高灵敏度、定量准确、广泛可及且稳健的方法。为满足这些要求,单细胞蛋白质组学(SCoPE2)方案被开发为第二代技术,可用于从微量样本(少至单个细胞)中定量数百至数千种蛋白质。采用该方法的实验已在10天的质谱仪运行时间内,实现了对1,500个单个哺乳动物细胞(每个细胞500–1,000种蛋白质)中超过3,000种蛋白质的定量。SCoPE2利用冻融-加热循环实现细胞裂解,省去了单细胞纯化步骤,从而减少了样品损失,同时加快了样品制备速度并简化了自动化流程。此外,该方法使用等压载体,有助于蛋白质鉴定并减少样品损失。本视频方案提供了详细操作指导,使研究者仅需使用广泛可及的设备和试剂即可开展自动化的单细胞蛋白质分析。我们演示了从细胞收获到进样进行液相色谱-串联质谱(LC-MS/MS)分析的蛋白质组学样品制备过程中的关键步骤。此外,观众还将学习等压载体实验设计的基本原理、等压载体与单细胞样品的质量控制方法,以及代表性结果与该方法局限性的讨论。 | + | 单细胞蛋白质组学分析需要具备高灵敏度、定量准确、广泛可及且稳健的方法。为满足这些要求,开发了单细胞蛋白质组学(SCoPE2)方案,作为第二代方法,用于从微量样本(少至单个细胞)中定量数百至数千种蛋白质。采用该方法的实验已在10天的质谱仪运行时间内,实现了对1,500个单个哺乳动物细胞(每个细胞500–1,000种蛋白质)中超过3,000种蛋白质的定量。SCoPE2利用冻融循环实现细胞裂解,无需对单细胞进行纯化处理,从而减少了样品损失,同时加快了样品制备速度并简化了自动化流程。此外,该方法使用等压载体,有助于蛋白质鉴定并减少样品损失。本视频方案提供了详细指导,使研究者仅使用广泛可及的设备和试剂即可开展自动化单细胞蛋白质分析。我们演示了从细胞收获到液相色谱-串联质谱(LC-MS/MS)分析进样的单细胞蛋白组学分析准备过程中的关键步骤。此外,还指导观众了解等压载体实验设计的原理、等压载体与单细胞样品的质量控制,以及代表性结果与该方法局限性的讨论。 | 单细胞蛋白质组学分析需要具备高灵敏度、定量准确、广泛可及且稳健的方法。为满足这些要求,单细胞蛋白质组学(SCoPE2)方案被开发为第二代技术,可用于从微量样本(少至单个细胞)中定量数百至数千种蛋白质。采用该方法的实验已在10天的质谱仪运行时间内,实现了对1,500个单个哺乳动物细胞(每个细胞500–1,000种蛋白质)中超过3,000种蛋白质的定量。SCoPE2利用冻融-加热循环实现细胞裂解,无需对单细胞进行纯化处理,从而减少了样品损失,同时加快了样品制备速度并简化了自动化流程。此外,该方法使用等压载体,有助于蛋白质鉴定并进一步降低样品损失。本视频方案提供了详细操作指南,使研究者仅需使用广泛可及的设备和试剂即可开展自动化的单细胞蛋白质分析。我们演示了从细胞收获到进样进行液相色谱-串联质谱(LC-MS/MS)分析的蛋白质组学样品制备过程中的关键步骤。此外,观众还将了解等压载体实验设计的基本原理、针对等压载体和单细胞样品的质量控制方法,以及代表性结果与该方法局限性的讨论。 | 单细胞蛋白质组学分析需要具备高灵敏度、定量准确、广泛可及且稳健的方法。为满足这些要求,开发了第二代单细胞蛋白质组学(SCoPE2)方案,用于从少量样本(少至单个细胞)中定量数百至数千种蛋白质。采用该方法的实验已在10天的质谱仪运行时间内,实现了对1,500个单个哺乳动物细胞(每个细胞500–1,000种蛋白质)中超过3,000种蛋白质的定量。SCoPE2利用冻融循环实现细胞裂解,无需对单细胞进行纯化处理,从而减少了样品损失,同时加快了样品制备速度并简化了自动化流程。此外,该方法使用等压载体,有助于提高蛋白质鉴定效率并减少样品损失。本视频方案提供了详细指导,使研究者仅使用广泛可及的设备和试剂即可开展自动化的单细胞蛋白质分析。我们演示了从细胞收获到进样进行液相色谱-串联质谱(LC-MS/MS)分析的单细胞蛋白质组学样品制备过程中的关键步骤。此外,还指导观众了解等压载体实验设计的原理、等压载体与单细胞样品制备的质量控制,以及代表性结果与该方法局限性的讨论。 | + | 单细胞蛋白质组学分析需要具备高灵敏度、定量准确、广泛可及且稳健的方法。为满足这些要求,单细胞蛋白质组学(SCoPE2)方案被开发为第二代技术,可用于从微量样本(少至单个细胞)中定量数百至数千种蛋白质。采用该方法的实验已在10天的质谱仪运行时间内,实现了对1,500个单个哺乳动物细胞(每个细胞500–1,000种蛋白质)中超过3,000种蛋白质的定量。SCoPE2利用冻融-加热循环实现细胞裂解,省去了单细胞纯化步骤,从而减少了样品损失,同时加快了样品制备速度并简化了自动化流程。此外,该方法使用等压载体,有助于蛋白质鉴定并减少样品损失。本视频方案提供了详细操作指导,使研究者仅需使用广泛可及的设备和试剂即可开展自动化的单细胞蛋白质分析。我们演示了从细胞收获到进样进行液相色谱-串联质谱(LC-MS/MS)分析的蛋白质组学样品制备过程中的关键步骤。此外,观众还将了解等压载体实验设计的基本原理、等压载体与单细胞样品制备的质量控制方法,以及代表性结果与该方法局限性的讨论。 | 单细胞蛋白质组学 |
| G | 单细胞蛋白质组学分析需要具备高灵敏度、定量准确、广泛可及且稳健的方法。为满足这些要求,开发了单细胞蛋白质组学(SCoPE2)方案,作为第二代技术,可用于从微量样本(少至单个细胞)中定量数百至数千种蛋白质。采用该方法的实验已在10天的质谱仪运行时间内,实现了对1,500个单个哺乳动物细胞(每个细胞500–1,000种蛋白质)中超过3,000种蛋白质的定量。SCoPE2利用冻融循环实现细胞裂解,无需对单个细胞进行纯化步骤,从而减少了样品损失,同时加快了样品制备速度并简化了自动化流程。此外,该方法使用等压载体,有助于蛋白质鉴定并减少样品损失。本视频协议提供了详细指导,使研究者仅使用广泛可及的设备和试剂即可开展自动化单细胞蛋白质分析。我们演示了从细胞收获到液相色谱-串联质谱(LC-MS/MS)分析进样的单细胞蛋白质组学分析准备过程中的关键步骤。此外,还指导观众了解等压载体实验设计的基本原理、等压载体与单细胞样品制备的质量控制,以及代表性结果与该方法局限性的讨论。 | 单细胞蛋白质组学分析需要具备高灵敏度、定量准确、广泛可及且稳健的方法。为满足这些要求,单细胞蛋白质组学(SCoPE2)协议被开发为第二代方法,可用于从少量样本(少至单个细胞)中定量数百至数千种蛋白质。采用该方法的实验已在10天的质谱仪运行时间内,实现了对1,500个单个哺乳动物细胞(每个细胞500–1,000种蛋白质)中超过3,000种蛋白质的定量。SCoPE2利用冻融-加热循环实现细胞裂解,无需对单细胞进行纯化处理,从而减少了样品损失,同时加快了样品制备速度并简化了自动化流程。此外,该方法使用等压载体,有助于蛋白质鉴定并减少样品损失。本视频协议提供了详细的指导,使研究者仅使用广泛可及的设备和试剂即可开展自动化的单细胞蛋白质分析。我们演示了从细胞收获到进样进行液相色谱-串联质谱(LC-MS/MS)分析的单细胞蛋白质组学分析准备过程中的关键步骤。此外,还向观众介绍了等压载体实验设计的原理、等压载体与单细胞样品的质量控制方法,以及代表性结果与该方法局限性的讨论。 | 单细胞蛋白质组学分析需要具备高灵敏度、定量准确、广泛可及且稳健的方法。为满足这些要求,开发了单细胞蛋白质组学(SCoPE2)方案,作为第二代技术,可用于从微量样本(少至单个细胞)中定量数百至数千种蛋白质。采用该方法的实验已在10天的质谱仪运行时间内,实现了对1,500个单个哺乳动物细胞(每个细胞500–1,000种蛋白质)中超过3,000种蛋白质的定量。SCoPE2利用冻融循环实现细胞裂解,无需对单细胞进行纯化处理,从而减少了样品损失,同时加快了样品制备速度并简化了自动化流程。此外,该方法使用等压载体,有助于蛋白质鉴定并减少样品损失。本视频方案提供了详细操作指导,使研究者仅使用广泛可及的设备和试剂即可开展自动化单细胞蛋白质分析。我们演示了从细胞收获到进样进行液相色谱-串联质谱(LC-MS/MS)分析的单细胞蛋白质组学样品制备过程中的关键步骤。此外,还指导观众了解等压载体实验设计的原理、等压载体与单细胞样品的质量控制,以及代表性结果与该方法局限性的讨论。 | + | 单细胞蛋白质组学 | 单细胞蛋白质组学 | SC | 单细胞蛋白质组学分析需要具备高灵敏度、定量准确、广泛可及且稳健的方法。为满足这些要求,单细胞蛋白质组学(SCoPE2)方案被开发为第二代技术,可用于从微量样本(少至单个细胞)中定量数百至数千种蛋白质。采用该方法的实验已在10天的质谱仪运行时间内,实现了对1,500个单个哺乳动物细胞(每个细胞500–1,000种蛋白质)中超过3,000种蛋白质的定量。SCoPE2利用冻融-加热循环实现细胞裂解,无需对单细胞进行纯化处理,从而减少了样品损失,同时加快了样品制备速度并简化了自动化流程。此外,该方法使用等压载体,有助于蛋白质鉴定并进一步降低样品损失。本视频方案提供了详细操作指导,使研究者仅需使用广泛可及的设备和试剂即可开展自动化的单细胞蛋白质分析。我们演示了从细胞收获到进样进行液相色谱-串联质谱(LC-MS/MS)分析的蛋白质组学样品制备过程中的关键步骤。此外,观众还将学习到有关等压载体实验设计的基本原理、等压载体与单细胞样品制备的质量控制方法,以及代表性结果与该方法局限性的讨论。 | 单细胞蛋白质组学分析需要具备高灵敏度、定量准确、广泛可及且稳健的方法。为满足这些要求,单细胞蛋白质组学(SCoPE2)方案被开发为第二代技术,可用于从极少量样本(少至单个细胞)中定量数百至数千种蛋白质。采用该方法的实验已在10天的质谱仪运行时间内,实现了对1,500个单个哺乳动物细胞(每个细胞500–1,000种蛋白质)中超过3,000种蛋白质的定量。SCoPE2利用冻融-加热循环实现细胞裂解,免除了对单细胞进行纯化的步骤,从而减少了样品损失,同时加快了样品制备速度并简化了自动化流程。此外,该方法使用等压载体,有助于提高蛋白质鉴定效率并减少样品损失。本视频方案提供了详细指导,使研究者仅使用广泛可及的设备和试剂即可开展自动化的单细胞蛋白质分析。我们演示了从细胞收获到进样进行液相色谱-串联质谱(LC-MS/MS)分析的单细胞蛋白质组学样品制备过程中的关键步骤。此外,观众还将了解等压载体实验设计的基本原理、等压载体与单细胞样品制备的质量控制方法,以及代表性结果与该方法局限性的讨论。 | 单细胞蛋白质组学 | 单细胞蛋白质组学分析需要具备高灵敏度、定量准确、广泛可及且稳健的方法。为满足这些要求,单细胞蛋白质组学(SCoPE2)方案被开发为第二代技术,可用于从微量样本(少至单个细胞)中定量数百至数千种蛋白质。采用该方法的实验已在10天的质谱仪运行时间内,实现了对1,500个单个哺乳动物细胞(每个细胞500–1,000种蛋白质)中超过3,000种蛋白质的定量。SCoPE2利用冻融-加热循环实现细胞裂解,省去了单细胞纯化步骤,从而减少了样品损失,同时加快了样品制备速度并简化了自动化流程。此外,该方法使用等压载体,有助于蛋白质鉴定并减少样品损失。本视频方案提供了详细操作指导,使研究者仅需使用广泛可及的设备和试剂即可开展自动化的单细胞蛋白质分析。我们演示了从细胞收获到进样进行液相色谱-串联质谱(LC-MS/MS)分析的蛋白质组学样品制备过程中的关键步骤。此外,观众还将了解等压载体实验设计的基本原理、等压载体与单细胞样品的质量控制方法,以及代表性结果与该方法局限性的讨论。 | 单细胞蛋白质组学 | 单细胞蛋白质组学分析需要具备高灵敏度、定量准确、广泛可及且稳健的方法。为满足这些要求,单细胞蛋白质组学(SCoPE2)技术被开发为第二代方法,可用于从少量样本(少至单个细胞)中定量数百至数千种蛋白质。采用该方法的实验已在10天的质谱仪运行时间内,实现了对1,500个单个哺乳动物细胞(每个细胞500–1,000种蛋白质)中超过3,000种蛋白质的定量。SCoPE2利用冻融循环实现细胞裂解,免除了对单细胞进行纯化的步骤,从而减少了样品损失,同时加快了样品制备速度并简化了自动化流程。此外,该方法使用等压载体,有助于蛋白质鉴定并减少样品损失。本视频协议提供了详细指导,使研究者仅使用广泛可及的设备和试剂即可实现自动化的单细胞蛋白质分析。我们演示了从细胞收获到进样进行液相色谱-串联质谱(LC-MS/MS)分析的单细胞蛋白质组学分析准备过程中的关键步骤。此外,观众还将了解等压载体实验设计的原理、等压载体与单细胞样品制备的质量控制,以及代表性结果与该方法局限性的讨论。 | 单细胞蛋白质组学分析需要具备高灵敏度、定量准确、广泛可及且稳健的方法。为满足这些要求,单细胞蛋白质组学(SCoPE2)方案被开发为第二代技术,可用于从微量样本(少至单个细胞)中定量数百至数千种蛋白质。采用该方法的实验已在10天的质谱仪运行时间内,实现了对1,500个单个哺乳动物细胞(每个细胞500–1,000种蛋白质)中超过3,000种蛋白质的定量。SCoPE2利用冻融-加热循环实现细胞裂解,无需对单细胞进行纯化处理,从而减少了样品损失,同时加快了样品制备速度并简化了自动化流程。此外,该方法使用等压标签载体,有助于蛋白质鉴定并进一步降低样品损失。本视频方案提供了详细操作指南,使研究者仅需使用广泛可及的设备和试剂即可开展自动化的单细胞蛋白质分析。我们演示了从细胞收获到进样进行液相色谱-串联质谱(LC-MS/MS)分析的蛋白质组学样品制备关键步骤。此外,视频还指导观众了解等压标签载体的实验设计原理、针对等压标签载体及单细胞样品的质量控制方法,并展示代表性结果,讨论该方法的局限性。 | 单细胞蛋白质组学分析需要具备高灵敏度、定量准确、广泛可及且稳健的方法。为满足这些要求,开发了第二代单细胞蛋白质组学(SCoPE2)方案,用于从微量样本(少至单个细胞)中定量数百至数千种蛋白质。采用该方法的实验已在10天的质谱仪使用时间内,实现了对1,500个单个哺乳动物细胞中超过3,000种蛋白质的定量(每个细胞500–1,000种蛋白质)。SCoPE2利用冻融循环实现细胞裂解,省去了单细胞纯化步骤,从而减少了样品损失,同时加快了样品制备速度并简化了自动化流程。此外,该方法使用等压载体,有助于蛋白质鉴定并减少样品损失。本视频方案提供了详细指导,使研究者仅使用广泛可及的设备和试剂即可开展自动化的单细胞蛋白质分析。我们演示了从细胞收获到进样至液相色谱-串联质谱(LC-MS/MS)分析的单细胞蛋白质组学样品制备过程中的关键步骤。此外,观众还将了解使用等压载体的实验设计原理、等压载体与单细胞样品制备的质量控制,以及代表性结果与该方法局限性的讨论。 | 单细胞蛋白质组学分析需要具备高灵敏度、定量准确、广泛可及且稳健的方法。为满足这些要求,单细胞蛋白质组学(SCoPE2)方案被开发为第二代技术,可用于从微量样本(少至单个细胞)中定量数百至数千种蛋白质。采用该方法的实验已在10天的质谱仪运行时间内,实现了对1,500个单个哺乳动物细胞(每个细胞500–1,000种蛋白质)中超过3,000种蛋白质的定量。SCoPE2利用冻融-加热循环实现细胞裂解,省去了单细胞纯化步骤,从而减少了样品损失,同时加快了样品制备过程并简化了自动化操作。此外,该方法使用等压载体,有助于蛋白质鉴定并减少样品损失。本视频方案提供了详细指导,使研究者仅使用广泛可及的设备和试剂即可开展自动化的单细胞蛋白质分析。我们演示了从细胞收获到进样进行液相色谱-串联质谱(LC-MS/MS)分析的蛋白质组学样品制备过程中的关键步骤。此外,观众还将了解等压载体实验设计的基本原理、针对等压载体和单细胞样品的质量控制方法,以及代表性结果与该方法局限性的讨论。 | 单细胞蛋白质组学分析需要具备高灵敏度、定量准确、广泛可及且稳健的方法。为满足这些要求,单细胞蛋白质组学(SCoPE2)技术被开发为第二代方法,可用于从微量样本(少至单个细胞)中定量数百至数千种蛋白质。采用该方法的实验已在10天的质谱仪运行时间内,实现了对1,500个单个哺乳动物细胞(每个细胞500–1,000个蛋白质)中超过3,000种蛋白质的定量。SCoPE2利用冻融循环实现细胞裂解,无需对单细胞进行纯化处理,从而减少了样品损失,同时加快了样品制备速度并简化了自动化流程。此外,该方法使用等压载体,有助于蛋白质鉴定并减少样品损失。本视频协议提供了详细的指导,使研究者仅使用广泛可及的设备和试剂即可开展自动化的单细胞蛋白质分析。我们演示了从细胞收获到液相色谱-串联质谱(LC-MS/MS)进样分析的单细胞蛋白质组学样品制备过程中的关键步骤。此外,还指导观众了解等压载体实验设计的原理、等压载体与单细胞样品制备的质量控制,以及代表性结果与该方法局限性的讨论。 | 单细胞蛋白质组学 | 单细胞蛋白质组学 | - | 单细胞蛋白质组学分析需要具备高灵敏度、定量准确、广泛可及且稳健的方法。为满足这些要求,单细胞蛋白质组学(SCoPE2)技术被开发为第二代方法,可用于从少量样本(少至单个细胞)中定量数百至数千种蛋白质。采用该方法的实验已在10天的质谱仪运行时间内,实现了对1,500个单个哺乳动物细胞(每个细胞500–1,000种蛋白质)中超过3,000种蛋白质的定量。SCoPE2利用冻融循环实现细胞裂解,无需对单细胞进行纯化处理,从而减少了样品损失,同时加快了样品制备速度并简化了自动化流程。此外,该方法使用等压载体,有助于蛋白质鉴定并减少样品损失。本视频协议提供了详细的指导,使研究者仅使用广泛可及的设备和试剂即可开展自动化的单细胞蛋白质分析。我们演示了从细胞收获到液相色谱-串联质谱(LC-MS/MS)分析进样前,用于蛋白质组学分析的单细胞制备过程中的关键步骤。此外,还指导观众了解等压载体实验设计的原理、等压载体与单细胞样品的质量控制,以及代表性结果与该方法局限性的讨论。 | 单细胞蛋白质组学 | 单细胞蛋白质组学分析需要具备高灵敏度、定量准确、广泛可及且稳健的方法。为满足这些要求,单细胞蛋白质组学(SCoPE2)技术被开发为第二代方法,可用于从少量样本(少至单个细胞)中定量数百至数千种蛋白质。采用该方法的实验已在10天的质谱仪运行时间内,实现了对1,500个单个哺乳动物细胞(每个细胞500–1,000种蛋白质)中超过3,000种蛋白质的定量。SCoPE2利用冻融-加热循环实现细胞裂解,无需对单细胞进行纯化处理,从而减少了样品损失,同时加快了样品制备速度并简化了自动化流程。此外,该方法使用等压载体,有助于蛋白质鉴定并减少样品损失。本视频协议提供了详细指导,使研究者仅使用广泛可及的设备和试剂即可开展自动化的单细胞蛋白质分析。我们演示了从细胞收获到液相色谱-串联质谱(LC-MS/MS)进样分析的单细胞蛋白质组学分析准备过程中的关键步骤。此外,观众还将了解等压载体实验设计的基本原理、等压载体与单细胞样品的质量控制方法,以及代表性结果与该方法局限性的讨论。 | 单细胞蛋白质组学分析需要具备高灵敏度、定量准确、广泛可及且稳健的方法。为满足这些要求,单细胞蛋白质组学(SCoPE2)方案被开发为第二代技术,可用于从微量样本(少至单个细胞)中定量数百至数千种蛋白质。采用该方法的实验已在10天的质谱仪运行时间内,实现了对1,500个单个哺乳动物细胞(每个细胞500–1,000种蛋白质)中超过3,000种蛋白质的定量。SCoPE2利用冻融-加热循环实现细胞裂解,无需对单细胞进行纯化处理,从而减少了样品损失,同时加快了样品制备速度并简化了自动化流程。此外,该方法使用等压载体,有助于蛋白质鉴定并减少样品损失。本视频方案提供了详细操作指导,使研究者仅需使用广泛可及的设备和试剂即可开展自动化的单细胞蛋白质分析。我们演示了从细胞收获到进样进行液相色谱-串联质谱(LC-MS/MS)分析的蛋白质组学样品制备过程中的关键步骤。此外,观众还将学习到有关等压载体实验设计的基本原理、等压载体与单细胞样品制备的质量控制方法,以及代表性结果与该方法局限性的讨论。 |
| H | 单细胞蛋白质组学分析需要具备高灵敏度、定量准确、广泛可及且稳健的方法。为满足这些要求,单细胞蛋白质组学(SCoPE2)方案被开发为第二代技术,可用于从微量样本(少至单个细胞)中定量数百至数千种蛋白质。采用该方法的实验已在10天的质谱仪运行时间内,实现了对1,500个单个哺乳动物细胞(每个细胞500–1,000种蛋白质)中超过3,000种蛋白质的定量。SCoPE2利用冻融-加热循环实现细胞裂解,省去了单细胞纯化步骤,从而减少了样品损失,同时加快了样品制备速度并简化了自动化流程。此外,该方法使用等压载体,有助于蛋白质鉴定并减少样品损失。本视频方案提供了详细操作指导,使研究者仅需使用广泛可及的设备和试剂即可开展自动化的单细胞蛋白质分析。我们演示了从细胞收获到进样进行液相色谱-串联质谱(LC-MS/MS)分析的蛋白质组学样品制备过程中的关键步骤。此外,观众还将学习等压载体实验设计的基本原理、等压载体与单细胞样品的质量控制方法,以及代表性结果与该方法局限性的讨论。 | 单细胞蛋白质组学 | 单细胞蛋白质组学 | 单细胞蛋白质组学 | 单细胞蛋白质组学 | + | 单细胞蛋白质组学分析需要具备高灵敏度、定量准确、广泛可及且稳健的方法。为满足这些要求,单细胞蛋白质组学(SCoPE2)技术被开发为第二代方法,可用于从少量样本(少至单个细胞)中定量数百至数千种蛋白质。采用该方法的实验已在10天的质谱仪运行时间内,实现了对1,500个单个哺乳动物细胞(每个细胞500–1,000种蛋白质)中超过3,000种蛋白质的定量。SCoPE2利用冻融循环实现细胞裂解,避免了对单细胞进行纯化的步骤,从而减少了样品损失,同时加快了样品制备速度并简化了自动化流程。此外,该方法使用等压载体,有助于提高蛋白质鉴定效率并减少样品损失。本视频协议提供了详细的指导,使研究者仅使用广泛可及的设备和试剂即可开展自动化的单细胞蛋白质分析。我们演示了从细胞收获到进样进行液相色谱-串联质谱(LC-MS/MS)分析的单细胞蛋白质组学样品制备过程中的关键步骤。此外,还指导观众了解等压载体实验设计的原理、等压载体与单细胞样品的质量控制,以及代表性结果与该方法局限性的讨论。 | 单细胞蛋白质组学分析需要具备高灵敏度、定量准确、广泛可及且稳健的方法。为满足这些要求,开发了第二代单细胞蛋白质组学(SCoPE2)方案,用于从微量样本(少至单个细胞)中定量数百至数千种蛋白质。采用该方法的实验已在10天的质谱仪运行时间内,实现了对1,500个单个哺乳动物细胞(每个细胞500–1,000种蛋白质)中超过3,000种蛋白质的定量。SCoPE2利用冻融循环实现细胞裂解,无需对单细胞进行纯化处理,从而减少了样品损失,同时加快了样品制备速度并简化了自动化流程。此外,该方法使用等压载体,有助于蛋白质鉴定并减少样品损失。本视频方案提供了详细的指导,使研究者仅使用广泛可及的设备和试剂即可开展自动化的单细胞蛋白质分析。我们演示了从细胞收获到液相色谱-串联质谱(LC-MS/MS)分析进样的单细胞蛋白组学样品制备过程中的关键步骤。此外,还指导观众了解等压载体实验设计的原理、等压载体与单细胞样品制备的质量控制,以及代表性结果与该方法局限性的讨论。 | 单细胞蛋白质组学 | 单细胞蛋白质组学 | 单细胞蛋白质组学分析需要具备高灵敏度、定量准确、广泛可及且稳健的方法。为满足这些要求,开发了单细胞蛋白质组学(SCoPE2)方案,作为第二代技术,可用于从微量样本(少至单个细胞)中定量数百至数千种蛋白质。采用该方法的实验已在10天的质谱仪运行时间内,实现了对1,500个单个哺乳动物细胞(每个细胞500–1,000种蛋白质)中超过3,000种蛋白质的定量。SCoPE2利用冻融循环实现细胞裂解,无需对单细胞进行纯化处理,从而减少了样品损失,同时加快了样品制备速度并简化了自动化流程。此外,该方法使用等压载体,有助于蛋白质鉴定并减少样品损失。本视频方案提供了详细操作指导,使研究者仅使用广泛可及的设备和试剂即可开展自动化单细胞蛋白质分析。我们演示了从细胞收获到进样进行液相色谱-串联质谱(LC-MS/MS)分析的单细胞蛋白质组学样品制备过程中的关键步骤。此外,还指导观众了解等压载体实验设计的原理、等压载体与单细胞样品的质量控制,以及代表性结果,并讨论了该方法的局限性。 | 单细胞蛋白质组学分析需要具备高灵敏度、定量准确、广泛可及且稳健的方法。为满足这些要求,单细胞蛋白质组学(SCoPE2)技术被开发为第二代方法,可用于从少量样本(少至单个细胞)中定量数百至数千种蛋白质。采用该方法的实验已在10天的质谱仪运行时间内,实现了对1,500个单个哺乳动物细胞(每个细胞500–1,000种蛋白质)中超过3,000种蛋白质的定量。SCoPE2利用冻融-加热循环实现细胞裂解,无需对单细胞进行纯化处理,从而减少了样品损失,同时加快了样品制备速度并简化了自动化流程。此外,该方法使用等压载体,有助于蛋白质鉴定并减少样品损失。本视频协议提供了详细指导,使研究者仅使用广泛可及的设备和试剂即可开展自动化的单细胞蛋白质分析。我们演示了从细胞收获到进样进行液相色谱-串联质谱(LC-MS/MS)分析的单细胞蛋白质组学样品制备过程中的关键步骤。此外,观众还将了解等压载体实验设计的基本原理、等压载体与单细胞样品的质量控制方法,以及代表性结果与该方法局限性的讨论。 | 单细胞蛋白质组学分析需要具备高灵敏度、定量准确、广泛可及且稳健的方法。为满足这些要求,单细胞蛋白质组学(SCoPE2)技术被开发为第二代方法,可用于从少量样本(少至单个细胞)中定量数百至数千种蛋白质。采用该方法的实验已在10天的质谱仪运行时间内,实现了对1,500个单个哺乳动物细胞(每个细胞500–1,000种蛋白质)中超过3,000种蛋白质的定量。SCoPE2利用冻融-加热循环实现细胞裂解,无需对单细胞进行纯化处理,从而减少了样品损失,同时加快了样品制备速度并简化了自动化流程。此外,该方法使用等压载体,有助于蛋白质鉴定并减少样品损失。本视频协议提供了详细操作指导,使研究者仅使用广泛可及的设备和试剂即可开展自动化单细胞蛋白质分析。我们演示了从细胞收获到进样至液相色谱-串联质谱(LC-MS/MS)分析的单细胞蛋白质组学样品制备过程中的关键步骤。此外,视频还指导观众了解等压载体实验设计的基本原理、等压载体与单细胞样品的质量控制,以及代表性结果,并讨论了该方法的局限性。 | 单细胞蛋白质组学 | 单细胞蛋白质组学分析需要具备高灵敏度、定量准确、广泛可及且稳健的方法。为满足这些要求,开发了第二代单细胞蛋白质组学(SCoPE2)方案,用于从微量样本(少至单个细胞)中定量数百至数千种蛋白质。采用该方法的实验已在10天的质谱仪运行时间内,实现了对1,500个单个哺乳动物细胞(每个细胞500–1,000种蛋白质)中超过3,000种蛋白质的定量。SCoPE2利用冻融循环实现细胞裂解,省去了单细胞纯化的步骤,从而减少了样品损失,同时加快了样品制备速度并简化了自动化流程。此外,该方法使用等压载体,有助于蛋白质鉴定并减少样品损失。本视频方案提供了详细的指导,使研究者仅使用广泛可及的设备和试剂即可开展自动化的单细胞蛋白质分析。我们演示了从细胞收获到液相色谱-串联质谱(LC-MS/MS)分析注入前,用于蛋白质组学分析的单细胞制备过程中的关键步骤。此外,还指导观众了解等压载体实验设计的原理、等压载体与单细胞样品制备的质量控制,以及代表性结果,并讨论了该方法的局限性。 | 单细胞蛋白质组学分析需要具备高灵敏度、定量准确、广泛可及且稳健的方法。为满足这些要求,单细胞蛋白质组学(SCoPE2)技术被开发为第二代方法,可用于从少量样本(少至单个细胞)中定量数百至数千种蛋白质。采用该方法的实验已在10天的质谱仪运行时间内,实现了对1,500个单个哺乳动物细胞(每个细胞500–1,000种蛋白质)中超过3,000种蛋白质的定量。SCoPE2利用冻融循环实现细胞裂解,避免了对单细胞进行纯化的步骤,从而减少了样品损失,同时加快了样品制备速度并简化了自动化流程。此外,该方法使用等压载体,有助于蛋白质鉴定并减少样品损失。本视频协议提供了详细的指导,使研究者仅使用广泛可及的设备和试剂即可开展自动化的单细胞蛋白质分析。我们演示了从细胞收获到进样进行液相色谱-串联质谱(LC-MS/MS)分析的单细胞蛋白质组学样品制备过程中的关键步骤。此外,观众还将学习等压载体实验设计的基本原理、等压载体与单细胞样品的质量控制方法,以及代表性结果与该方法局限性的讨论。 | + | 单细胞蛋白质组学分析需要具备高灵敏度、定量准确、广泛可及且稳健的方法。为满足这些要求,开发了单细胞蛋白质组学(SCoPE2)方案,作为第二代技术,用于从微量样本(少至单个细胞)中定量数百至数千种蛋白质。采用该方法的实验已在10天的质谱仪运行时间内,实现了对1,500个单个哺乳动物细胞(每个细胞500–1,000种蛋白质)中超过3,000种蛋白质的定量。SCoPE2利用冻融循环实现细胞裂解,无需对单细胞进行纯化处理,从而减少了样品损失,同时加快了样品制备并简化了自动化流程。此外,该方法使用等压载体,有助于蛋白质鉴定并减少样品损失。本视频协议提供了详细指导,使研究者仅使用广泛可及的设备和试剂即可开展自动化的单细胞蛋白质分析。我们演示了从细胞收获到液相色谱-串联质谱(LC-MS/MS)分析进样前,用于蛋白质组学分析的单细胞制备过程中的关键步骤。此外,还指导观众了解等压载体实验设计的基本原理、等压载体与单细胞样品的质量控制,以及代表性结果与该方法局限性的讨论。 | 单细胞蛋白质组学 | 单细胞蛋白质组学 | 单细胞蛋白质组学 | 单细胞蛋白质组学 | 单细胞蛋白质组学 | 单细胞蛋白质组学 |
| I | 单细胞蛋白质组学(SCoPE2) | 单细胞蛋白质组学分析需要具备高灵敏度、定量准确、广泛可及且稳健的方法。为满足这些要求,开发了第二代单细胞蛋白质组学(SCoPE2)方案,用于从微量样本(少至单个细胞)中定量数百至数千种蛋白质。采用该方法的实验已在10天的质谱仪运行时间内,实现了对1,500个单个哺乳动物细胞中超过3,000种蛋白质的定量(每个细胞500–1,000种蛋白质)。SCoPE2利用冻融循环实现细胞裂解,免除了对单细胞进行纯化的步骤,从而减少了样品损失,同时加快了样品制备速度并简化了自动化流程。此外,该方法使用等压载体,有助于蛋白质鉴定并减少样品损失。本视频方案提供了详细指导,使研究者仅使用广泛可及的设备和试剂即可开展自动化的单细胞蛋白质分析。我们演示了从细胞收获到液相色谱-串联质谱(LC-MS/MS)分析进样的单细胞蛋白质组学样品制备过程中的关键步骤。此外,还指导观众了解等压载体实验设计的原理、等压载体与单细胞样品的质量控制,以及代表性结果,并讨论了该方法的局限性。 | 单细胞蛋白质组学 | 单细胞蛋白质组学 | 单细胞蛋白质组学 | 单细胞蛋白质组学 | 单细胞蛋白质组学分析需要具备高灵敏度、定量准确、广泛可及且稳健的方法。为满足这些要求,单细胞蛋白质组学(SCoPE2)方案被开发为第二代技术,可用于从微量样本(少至单个细胞)中定量数百至数千种蛋白质。采用该方法的实验已在10天的质谱仪运行时间内,实现了对1,500个单个哺乳动物细胞(每个细胞500–1,000种蛋白质)中超过3,000种蛋白质的定量。SCoPE2利用冻融-加热循环实现细胞裂解,无需对单细胞进行纯化处理,从而减少了样品损失,同时加快了样品制备速度并简化了自动化流程。此外,该方法使用等压载体,有助于蛋白质鉴定并减少样品损失。本视频方案提供了详细操作指南,使研究者仅需使用广泛可及的设备和试剂即可开展自动化的单细胞蛋白质分析。我们演示了从细胞收获到进样进行液相色谱-串联质谱(LC-MS/MS)分析的蛋白质组学样品制备过程中的关键步骤。此外,观众还将学习到有关等压载体实验设计的原理、等压载体与单细胞样品制备的质量控制方法,以及代表性结果与该方法局限性的讨论。 | 单细胞蛋白质组学 | 单细胞蛋白质组学分析需要具备高灵敏度、定量准确、广泛可及且稳健的方法。为满足这些要求,单细胞蛋白质组学(SCoPE2)技术被开发为第二代方法,可用于从少量样本(少至单个细胞)中定量数百至数千种蛋白质。采用该方法的实验已在10天的质谱仪运行时间内,实现了对1,500个单个哺乳动物细胞(每个细胞500–1,000种蛋白质)中超过3,000种蛋白质的定量。SCoPE2利用冻融循环实现细胞裂解,无需对单细胞进行纯化处理,从而减少了样品损失,同时加快了样品制备速度并简化了自动化流程。此外,该方法使用等压载体,有助于蛋白质鉴定并减少样品损失。本视频协议提供了详细指导,使研究者仅使用广泛可及的设备和试剂即可开展自动化的单细胞蛋白质分析。我们演示了从细胞收获到进样进行液相色谱-串联质谱(LC-MS/MS)分析的蛋白质组学样品制备关键步骤。此外,观众还将了解等压载体实验设计的基本原理、等压载体与单细胞样品的质量控制,以及代表性结果与该方法局限性的讨论。 | + | 单细胞蛋白质组学分析需要具备高灵敏度、定量准确、广泛可及且稳健的方法。为满足这些要求,开发了第二代单细胞蛋白质组学(SCoPE2)方案,用于从少量样本(少至单个细胞)中定量数百至数千种蛋白质。采用该方法的实验已在10天的质谱仪运行时间内,实现了对1,500个单个哺乳动物细胞(每个细胞500–1,000种蛋白质)中超过3,000种蛋白质的定量。SCoPE2利用冻融循环实现细胞裂解,无需对单细胞进行纯化处理,从而减少了样品损失,同时加快了样品制备速度并简化了自动化流程。此外,该方法使用等压载体,有助于蛋白质鉴定并减少样品损失。本视频方案提供了详细指导,使研究者仅使用广泛可及的设备和试剂即可开展自动化单细胞蛋白质分析。我们演示了从细胞收获到液相色谱-串联质谱(LC-MS/MS)分析进样的单细胞蛋白质组学分析准备过程中的关键步骤。此外,还引导观众了解等压载体实验设计的原理、等压载体与单细胞样品制备的质量控制,以及代表性结果,并讨论了该方法的局限性。 | 单细胞蛋白质组学分析需要具备高灵敏度、定量准确、广泛可及且稳健的方法。为满足这些要求,单细胞蛋白质组学(SCoPE2)方案被开发为第二代技术,可用于从微量样本(少至单个细胞)中定量数百至数千种蛋白质。采用该方法的实验已在10天的质谱仪运行时间内,实现了对1,500个单个哺乳动物细胞(每个细胞500–1,000种蛋白质)中超过3,000种蛋白质的定量。SCoPE2利用冻融-加热循环实现细胞裂解,无需对单细胞进行纯化处理,从而减少了样品损失,同时加快了样品制备速度并简化了自动化流程。此外,该方法使用等压载体,有助于蛋白质鉴定并进一步降低样品损失。本视频方案提供了详细操作指导,使研究者仅需使用广泛可及的设备和试剂即可开展自动化的单细胞蛋白质分析。我们演示了从细胞收获到进样进行液相色谱-串联质谱(LC-MS/MS)分析的蛋白质组学样品制备过程中的关键步骤。此外,观众还将学习到有关等压载体实验设计的原理、等压载体与单细胞样品制备的质量控制方法,以及代表性结果与该方法局限性的讨论。 | - | 单细胞蛋白质组学分析需要具备高灵敏度、定量准确、广泛可及且稳健的方法。为满足这些要求,单细胞蛋白质组学(SCoPE2)方案被开发为第二代技术,可用于从微量样本(少至单个细胞)中定量数百至数千种蛋白质。采用该方法的实验已在10天的质谱仪运行时间内,实现了对1,500个单个哺乳动物细胞(每个细胞500–1,000种蛋白质)中超过3,000种蛋白质的定量。SCoPE2利用冻融-加热循环实现细胞裂解,无需对单细胞进行纯化处理,从而减少了样品损失,同时加快了样品制备速度并简化了自动化流程。此外,该方法使用等压载体,有助于蛋白质鉴定并减少样品损失。本视频方案提供了详细指导,使研究者仅使用广泛可及的设备和试剂即可开展自动化的单细胞蛋白质分析。我们演示了从细胞收获到进样进行液相色谱-串联质谱(LC-MS/MS)分析的蛋白质组学样品制备过程中的关键步骤。此外,观众还将了解等压载体实验设计的基本原理、等压载体与单细胞样品制备的质量控制方法,以及代表性结果与该方法局限性的讨论。 | 单细胞蛋白质组学 | 单细胞蛋白质组学分析需要具备高灵敏度、定量准确、广泛可及且稳健的方法。为满足这些要求,单细胞蛋白质组学(SCoPE2)技术被开发为第二代方法,可用于从少量样本(少至单个细胞)中定量数百至数千种蛋白质。采用该方法的实验已在10天的质谱仪运行时间内,实现了对1,500个单个哺乳动物细胞(每个细胞500–1,000个蛋白质)中超过3,000种蛋白质的定量。SCoPE2利用冻融循环实现细胞裂解,无需对单细胞进行纯化处理,从而减少了样品损失,同时加快了样品制备速度并简化了自动化流程。此外,该方法使用等压载体,有助于蛋白质鉴定并减少样品损失。本视频协议提供了详细指导,使研究者仅使用广泛可及的设备和试剂即可开展自动化的单细胞蛋白质分析。我们演示了从细胞收获到注入液相色谱-串联质谱(LC-MS/MS)分析的单细胞蛋白质组学样品制备过程中的关键步骤。此外,观众还将了解等压载体实验设计的基本原理、等压载体与单细胞样品的质量控制方法,以及代表性结果与该方法局限性的讨论。 | 单细胞蛋白质组学 | 单细胞蛋白质组学 | 单细胞蛋白质组学分析需要具备高灵敏度、定量准确、广泛可及且稳健的方法。为满足这些要求,单细胞蛋白质组学(SCoPE2)方案被开发为第二代技术,可用于从微量样本(少至单个细胞)中定量数百至数千种蛋白质。采用该方法的实验已在10天的质谱仪运行时间内,实现了对1,500个单个哺乳动物细胞(每个细胞500–1,000种蛋白质)中超过3,000种蛋白质的定量。SCoPE2利用冻融-加热循环实现细胞裂解,无需对单细胞进行纯化处理,从而减少了样品损失,同时加快了样品制备速度并简化了自动化流程。此外,该方法使用等压载体,有助于蛋白质鉴定并减少样品损失。本视频方案提供了详细指导,使研究者仅使用广泛可及的设备和试剂即可开展自动化的单细胞蛋白质分析。我们演示了从细胞收获到进样进行液相色谱-串联质谱(LC-MS/MS)分析的蛋白质组学样品制备过程中的关键步骤。此外,观众还将学习等压载体实验设计的基本原理、等压载体及单细胞样品制备的质量控制方法,以及代表性结果与该方法局限性的讨论。 | 单细胞蛋白质组学分析需要具备高灵敏度、定量准确、广泛可及且稳健的方法。为满足这些要求,单细胞蛋白质组学(SCoPE2)方案被开发为第二代技术,可用于从微量样本(少至单个细胞)中定量数百至数千种蛋白质。采用该方法的实验已在10天的质谱仪运行时间内,实现了对1,500个单个哺乳动物细胞(每个细胞500–1,000种蛋白质)中超过3,000种蛋白质的定量。SCoPE2利用冻融-加热循环实现细胞裂解,省去了单细胞纯化步骤,从而减少了样品损失,同时加快了样品制备速度并简化了自动化流程。此外,该方法使用等压载体,有助于蛋白质鉴定并减少样品损失。本视频方案提供了详细操作指导,使研究者仅需使用广泛可及的设备和试剂即可开展自动化的单细胞蛋白质分析。我们演示了从细胞收获到进样进行液相色谱-串联质谱(LC-MS/MS)分析的蛋白质组学样品制备过程中的关键步骤。此外,观众还将学习到有关等压载体实验设计的原理、等压载体与单细胞样品的质量控制方法,以及代表性结果与该方法局限性的讨论。 | 单细胞蛋白质组学分析需要具备高灵敏度、定量准确、广泛可及且稳健的方法。为满足这些要求,开发了第二代单细胞蛋白质组学(SCoPE2)方案,用于从微量样本(少至单个细胞)中定量数百至数千种蛋白质。采用该方法的实验已在10天的质谱仪运行时间内,实现了对1,500个单个哺乳动物细胞(每个细胞500–1,000种蛋白质)中超过3,000种蛋白质的定量。SCoPE2利用冻融循环实现细胞裂解,无需对单细胞进行纯化处理,从而减少了样品损失,同时加快了样品制备速度并简化了自动化流程。此外,该方法使用等压载体,有助于蛋白质鉴定并减少样品损失。本视频方案提供了详细指导,使研究者仅使用广泛可及的设备和试剂即可开展自动化的单细胞蛋白质分析。我们演示了从细胞收获到上样至液相色谱-串联质谱(LC-MS/MS)分析的单细胞蛋白质组学样品制备过程中的关键步骤。此外,还指导观众了解等压载体实验设计的原理、等压载体与单细胞样品的质量控制,以及代表性结果,并讨论了该方法的局限性。 | 单细胞蛋白质组学 | 单细胞蛋白质组学分析需要具备高灵敏度、定量准确、广泛可及且稳健的方法。为满足这些要求,单细胞蛋白质组学(SCoPE2)方案被开发为第二代技术,可用于从微量样本(少至单个细胞)中定量数百至数千种蛋白质。采用该方法的实验已在10天的质谱仪运行时间内,实现了对1,500个单个哺乳动物细胞(每个细胞500–1,000种蛋白质)中超过3,000种蛋白质的定量。SCoPE2利用冻融-加热循环实现细胞裂解,无需对单细胞进行纯化处理,从而减少了样品损失,同时加快了样品制备速度并简化了自动化流程。此外,该方法使用等压载体,有助于蛋白质鉴定并减少样品损失。本视频方案提供了详细操作指导,使研究者仅需使用广泛可及的设备和试剂即可开展自动化的单细胞蛋白质分析。我们演示了从细胞收获到进样进行液相色谱-串联质谱(LC-MS/MS)分析的蛋白质组学样品制备过程中的关键步骤。此外,观众还将学习等压载体实验设计的基本原理、等压载体与单细胞样品的质量控制方法,以及代表性结果与该方法局限性的讨论。 | 单细胞蛋白质组学 |
| J | - | 单细胞蛋白质组学分析需要具备高灵敏度、定量准确、广泛可及且稳健的方法。为满足这些要求,单细胞蛋白质组学(SCoPE2)技术被开发为第二代方法,可用于从少量样本(少至单个细胞)中定量数百至数千种蛋白质。采用该方法的实验已在10天的质谱仪运行时间内,实现了对1,500个单个哺乳动物细胞(每个细胞500–1,000种蛋白质)中超过3,000种蛋白质的定量。SCoPE2利用冻融-加热循环实现细胞裂解,无需对单细胞进行纯化处理,从而减少了样品损失,同时加快了样品制备速度并简化了自动化流程。此外,该方法使用等压载体,有助于蛋白质鉴定并减少样品损失。本视频协议提供了详细的指导,使研究者仅使用广泛可及的设备和试剂即可开展自动化的单细胞蛋白质分析。我们演示了从细胞收获到进样进行液相色谱-串联质谱(LC-MS/MS)分析的单细胞蛋白质组学样品制备过程中的关键步骤。此外,还指导观众了解等压载体实验设计的原理、等压载体与单细胞样品制备的质量控制,以及代表性结果,并讨论了该方法的局限性。 | + | 单细胞蛋白质组学分析需要具备高灵敏度、定量准确、广泛可及且稳健的方法。为满足这些要求,单细胞蛋白质组学(SCoPE2)方案被开发为第二代技术,可用于从微量样本(少至单个细胞)中定量数百至数千种蛋白质。采用该方法的实验已在10天的质谱仪运行时间内,实现了对1,500个单个哺乳动物细胞(每个细胞500–1,000种蛋白质)中超过3,000种蛋白质的定量。SCoPE2利用冻融-加热循环实现细胞裂解,无需对单个细胞进行纯化处理,从而减少了样品损失,同时加快了样品制备速度并简化了自动化流程。此外,该方法使用等压载体,有助于蛋白质鉴定并减少样品损失。本视频方案提供了详细指导,使研究者仅需使用广泛可及的设备和试剂即可开展自动化的单细胞蛋白质分析。我们演示了从细胞收获到进样进行液相色谱-串联质谱(LC-MS/MS)分析的蛋白质组学样品制备过程中的关键步骤。此外,观众还将了解等压载体实验设计的基本原理、等压载体与单细胞样品制备的质量控制方法,以及代表性结果与该方法局限性的讨论。 | 单细胞蛋白质组学 | 单细胞蛋白质组学 | 单细胞蛋白质组学分析需要具备高灵敏度、定量准确、广泛可及且稳健的方法。为满足这些要求,开发了第二代单细胞蛋白质组学(SCoPE2)方案,用于从微量样本(少至单个细胞)中定量数百至数千种蛋白质。采用该方法的实验已在10天的质谱仪运行时间内,实现了对1,500个单个哺乳动物细胞(每个细胞500–1,000种蛋白质)中超过3,000种蛋白质的定量。SCoPE2利用冻融循环实现细胞裂解,无需对单个细胞进行纯化处理,从而减少了样品损失,同时加快了样品制备速度并简化了自动化流程。此外,该方法使用等压载体,有助于蛋白质鉴定并减少样品损失。本视频方案提供了详细指导,使研究者仅使用广泛可及的设备和试剂即可开展自动化单细胞蛋白质分析。我们演示了从细胞收获到进样进行液相色谱-串联质谱(LC-MS/MS)分析的单细胞蛋白质组学样品制备过程中的关键步骤。此外,还指导观众了解等压载体实验设计的原理、等压载体与单细胞样品制备的质量控制,以及代表性结果与该方法局限性的讨论。 | 单细胞蛋白质组学 | 单细胞蛋白质组学分析需要具备高灵敏度、定量准确、广泛可及且稳健的方法。为满足这些要求,单细胞蛋白质组学(SCoPE2)技术被开发为第二代方法,可用于从微量样本(少至单个细胞)中定量数百至数千种蛋白质。采用该方法的实验已在10天的质谱仪运行时间内,实现了对1,500个单个哺乳动物细胞(每个细胞500–1,000种蛋白质)中超过3,000种蛋白质的定量。SCoPE2利用冻融循环实现细胞裂解,无需对单个细胞进行纯化,从而减少了样品损失,同时加快了样品制备速度并简化了自动化流程。此外,该方法使用等压载体,有助于蛋白质鉴定并减少样品损失。本视频协议提供了详细的指导,使研究者仅使用广泛可及的设备和试剂即可实现自动化的单细胞蛋白质分析。我们演示了从细胞收获到液相色谱-串联质谱(LC-MS/MS)分析进样前,用于蛋白质组学分析的单细胞制备过程中的关键步骤。此外,还指导观众了解等压载体实验设计的原理、等压载体与单细胞样品制备的质量控制,以及代表性结果,并讨论了该方法的局限性。 | 单细胞蛋白质组学 | 单细胞蛋白质组学分析需要具备高灵敏度、定量准确、广泛可及且稳健的方法。为满足这些要求,开发了单细胞蛋白质组学(SCoPE2)方案,作为第二代技术,可用于从微量样本(少至单个细胞)中定量数百至数千种蛋白质。采用该方法的实验已在10天的质谱仪运行时间内,实现了对1,500个单个哺乳动物细胞(每个细胞500–1,000种蛋白质)中超过3,000种蛋白质的定量。SCoPE2利用冻融循环实现细胞裂解,无需对单细胞进行纯化处理,从而减少了样品损失,同时加快了样品制备速度并简化了自动化流程。此外,该方法使用等压载体,有助于蛋白质鉴定并减少样品损失。本视频方案提供了详细操作指导,使研究者仅使用广泛可及的设备和试剂即可开展自动化单细胞蛋白质分析。我们演示了从细胞收获到进样进行液相色谱-串联质谱(LC-MS/MS)分析的单细胞蛋白质组学样品制备过程中的关键步骤。此外,还指导观众了解等压载体实验设计的原理、等压载体与单细胞样品的质量控制,以及代表性结果,并讨论了该方法的局限性。 | 单细胞蛋白质组学 | 单细胞蛋白质组学分析需要具备高灵敏度、定量准确、广泛可及且稳健的方法。为满足这些要求,开发了第二代单细胞蛋白质组学(SCoPE2)方案,用于从少量样本(少至单个细胞)中定量数百至数千种蛋白质。采用该方法的实验已在10天的质谱仪运行时间内,实现了对1,500个单个哺乳动物细胞(每个细胞500–1,000种蛋白质)中超过3,000种蛋白质的定量。SCoPE2利用冻融-加热循环实现细胞裂解,无需对单细胞进行纯化处理,从而减少了样品损失,同时加快了样品制备速度并简化了自动化流程。此外,该方法使用等压载体,有助于蛋白质鉴定并减少样品损失。本视频协议提供了详细的指导,使研究者仅使用广泛可及的设备和试剂即可开展自动化的单细胞蛋白质分析。我们演示了从细胞收获到进样进行液相色谱-串联质谱(LC-MS/MS)分析的单细胞蛋白质组学样品制备过程中的关键步骤。此外,还指导观众了解等压载体实验设计的原理、等压载体与单细胞样品制备的质量控制,以及代表性结果和对该方法局限性的讨论。 | 单细胞蛋白质组学分析需要具备高灵敏度、定量准确、广泛可及且稳健的方法。为满足这些要求,单细胞蛋白质组学(SCoPE2)技术被开发为第二代方法,可用于从少量样本(少至单个细胞)中定量数百至数千种蛋白质。采用该方法的实验已在10天的质谱仪运行时间内,实现了对1,500个单个哺乳动物细胞(每个细胞500–1,000种蛋白质)中超过3,000种蛋白质的定量。SCoPE2利用冻融循环实现细胞裂解,避免了对单细胞进行纯化的步骤,从而减少了样品损失,同时加快了样品制备速度并简化了自动化流程。此外,该方法使用等压载体,有助于蛋白质鉴定并减少样品损失。本视频协议提供了详细的指导,使研究者仅使用广泛可及的设备和试剂即可开展自动化单细胞蛋白质分析。我们演示了从细胞收获到进样进行液相色谱-串联质谱(LC-MS/MS)分析的蛋白质组学样品制备过程中的关键步骤。此外,观众还将了解等压载体实验设计的基本原理、等压载体与单细胞样品的质量控制方法,以及代表性结果与该方法局限性的讨论。 | 单细胞蛋白质组学 | 单细胞蛋白质组学 | 单细胞蛋白质组学分析需要具备高灵敏度、定量准确、广泛可及且稳健的方法。为满足这些要求,单细胞蛋白质组学(SCoPE2)技术被开发为第二代方法,可用于从少量样本(少至单个细胞)中定量数百至数千种蛋白质。采用该方法的实验已在10天的质谱仪运行时间内,实现了对1,500个单个哺乳动物细胞(每个细胞500–1,000种蛋白质)中超过3,000种蛋白质的定量。SCoPE2利用冻融循环实现细胞裂解,避免了对单细胞进行纯化的步骤,从而减少了样品损失,同时加快了样品制备速度并简化了自动化流程。此外,该方法使用等压载体,有助于蛋白质鉴定并减少样品损失。本视频协议提供了详细的指导,使研究者仅使用广泛可及的设备和试剂即可开展自动化单细胞蛋白质分析。我们演示了从细胞收获到进样进行液相色谱-串联质谱(LC-MS/MS)分析的蛋白质组学样品制备过程中的关键步骤。此外,观众还将了解等压载体实验设计的基本原理、等压载体与单细胞样品的质量控制方法,以及代表性结果与该方法局限性的讨论。 | - | 单细胞蛋白质组学分析需要具备高灵敏度、定量准确、广泛可及且稳健的方法。为满足这些要求,开发了第二代单细胞蛋白质组学(SCoPE2)方案,用于从微量样本(少至单个细胞)中定量数百至数千种蛋白质。采用该方法的实验已在10天的质谱仪使用时间内,实现了对1,500个单个哺乳动物细胞(每个细胞500–1,000种蛋白质)中超过3,000种蛋白质的定量。SCoPE2利用冻融循环实现细胞裂解,无需对单细胞进行纯化处理,从而减少了样品损失,同时加快了样品制备速度并简化了自动化操作。此外,该方法使用等压载体,有助于蛋白质鉴定并减少样品损失。本视频方案提供了详细的指导,使研究者仅使用广泛可及的设备和试剂即可开展自动化的单细胞蛋白质分析。我们演示了从细胞收获到液相色谱-串联质谱(LC-MS/MS)分析进样前,用于蛋白质组学分析的单细胞制备过程中的关键步骤。此外,还指导观众了解等压载体实验设计的原理、等压载体与单细胞样品制备的质量控制,以及代表性结果,并讨论了该方法的局限性。 | 单细胞蛋白质组学分析需要具备高灵敏度、定量准确、广泛可及且稳健的方法。为满足这些要求,开发了第二代单细胞蛋白质组学(SCoPE2)方案,用于从微量样本(少至单个细胞)中定量数百至数千种蛋白质。采用该方法的实验已在10天的质谱仪运行时间内,实现了对1,500个单个哺乳动物细胞(每个细胞500–1,000种蛋白质)中超过3,000种蛋白质的定量。SCoPE2利用冻融循环实现细胞裂解,省去了单细胞纯化步骤,从而减少了样品损失,同时加快了样品制备速度并简化了自动化流程。此外,该方法使用等压载体,有助于蛋白质鉴定并减少样品损失。本视频方案提供了详细指导,使研究者仅使用广泛可及的设备和试剂即可开展自动化的单细胞蛋白质分析。我们演示了从细胞收获到进样进行液相色谱-串联质谱(LC-MS/MS)分析的单细胞蛋白质组学样品制备过程中的关键步骤。此外,还指导观众了解等压载体实验设计的原理、等压载体与单细胞样品的质量控制,以及代表性结果与该方法局限性的讨论。 | 单细胞蛋白质组学 | 单细胞蛋白质组学 | 单细胞蛋白质组学 | 单细胞蛋白质组学 |
| K | 单细胞蛋白质组学分析需要具备高灵敏度、定量准确、广泛可及且稳健的方法。为满足这些要求,单细胞蛋白质组学(SCoPE2)技术被开发为第二代方法,可用于从少量样本(少至单个细胞)中定量数百至数千种蛋白质。采用该方法的实验已在10天的质谱仪运行时间内,实现了对1,500个单个哺乳动物细胞(每个细胞500–1,000种蛋白质)中超过3,000种蛋白质的定量。SCoPE2利用冻融-加热循环实现细胞裂解,无需对单细胞样本进行纯化处理,从而减少了样本损失,同时加快了样本制备速度并简化了自动化流程。此外,该方法使用等压载体,有助于蛋白质鉴定并减少样本损失。本视频协议提供了详细的指导,使研究者仅使用广泛可及的设备和试剂即可开展自动化的单细胞蛋白质分析。我们演示了从细胞收获到进样进行液相色谱-串联质谱(LC-MS/MS)分析的单细胞蛋白质组学样本制备过程中的关键步骤。此外,还指导观众了解等压载体实验设计的基本原理、等压载体与单细胞样本制备的质量控制,以及代表性结果与该方法局限性的讨论。 | 单细胞蛋白质组学分析需要具备高灵敏度、定量准确、广泛可及且稳健的方法。为满足这些要求,开发了单细胞蛋白质组学(SCoPE2)方案,作为第二代技术,可用于从微量样本(少至单个细胞)中定量数百至数千种蛋白质。采用该方法的实验已在10天的质谱仪运行时间内,实现了对1,500个单个哺乳动物细胞(每个细胞500–1,000种蛋白质)中超过3,000种蛋白质的定量。SCoPE2利用冻融循环实现细胞裂解,无需对单细胞进行纯化处理,从而减少了样品损失,同时加快了样品制备速度并简化了自动化流程。此外,该方法使用等压载体,有助于蛋白质鉴定并减少样品损失。本视频方案提供了详细操作指导,使研究者仅使用广泛可及的设备和试剂即可开展自动化单细胞蛋白质分析。我们演示了从细胞收获到进样进行液相色谱-串联质谱(LC-MS/MS)分析的单细胞蛋白质组学样品制备过程中的关键步骤。此外,还指导观众了解等压载体实验设计的原理、等压载体与单细胞样品的质量控制,以及代表性结果,并讨论了该方法的局限性。 | 单细胞蛋白质组学分析需要具备高灵敏度、定量准确、广泛可及且稳健的方法。为满足这些要求,单细胞蛋白质组学(SCoPE2)技术被开发为第二代方法,可用于从少量样本(少至单个细胞)中定量数百至数千种蛋白质。采用该方法的实验已在10天的质谱仪运行时间内,实现了对1,500个单个哺乳动物细胞(每个细胞500–1,000种蛋白质)中超过3,000种蛋白质的定量。SCoPE2利用冻融循环实现细胞裂解,无需对单细胞进行纯化处理,从而减少了样品损失,同时加快了样品制备速度并简化了自动化流程。此外,该方法使用等压载体,有助于蛋白质鉴定并减少样品损失。本视频协议提供了详细的指导,使研究者仅使用广泛可及的设备和试剂即可开展自动化的单细胞蛋白质分析。我们演示了从细胞收获到进样进行液相色谱-串联质谱(LC-MS/MS)分析的单细胞蛋白质组学分析准备过程中的关键步骤。此外,还指导观众了解等压载体实验设计的原理、等压载体与单细胞样品的质量控制,以及代表性结果与该方法局限性的讨论。 | 单细胞蛋白质组学分析需要具备高灵敏度、定量准确、广泛可及且稳健的方法。为满足这些要求,单细胞蛋白质组学(SCoPE2)方案被开发为第二代技术,可用于从微量样本(少至单个细胞)中定量数百至数千种蛋白质。采用该方法的实验已在10天的质谱仪运行时间内,实现了对1,500个单个哺乳动物细胞(每个细胞500–1,000种蛋白质)中超过3,000种蛋白质的定量。SCoPE2利用冻融-加热循环实现细胞裂解,省去了单细胞纯化步骤,从而减少了样品损失,同时加快了样品制备速度并简化了自动化流程。此外,该方法使用等压载体,有助于蛋白质鉴定并减少样品损失。本视频方案提供了详细操作指导,使研究者仅需使用广泛可及的设备和试剂即可开展自动化的单细胞蛋白质分析。我们演示了从细胞收获到进样进行液相色谱-串联质谱(LC-MS/MS)分析的蛋白质组学样品制备过程中的关键步骤。此外,观众还将学习等压载体实验设计的基本原理、等压载体及单细胞样品制备的质量控制方法,以及代表性结果与该方法局限性的讨论。 | - | 单细胞蛋白质组学分析需要具备高灵敏度、定量准确、广泛可及且稳健的方法。为满足这些要求,单细胞蛋白质组学(SCoPE2)技术被开发为第二代方法,可用于从微量样本(少至单个细胞)中定量数百至数千种蛋白质。采用该方法的实验已在10天的质谱仪运行时间内,实现了对1,500个单个哺乳动物细胞(每个细胞500–1,000种蛋白质)中超过3,000种蛋白质的定量。SCoPE2利用冻融-加热循环实现细胞裂解,免除了对单细胞进行纯化的步骤,从而减少了样品损失,同时加快了样品制备速度并简化了自动化流程。此外,该方法使用等压载体,有助于提高蛋白质鉴定效率并减少样品损失。本视频协议提供了详细指导,使研究者仅使用广泛可及的设备和试剂即可开展自动化单细胞蛋白质分析。我们演示了从细胞收获到进样进行液相色谱-串联质谱(LC-MS/MS)分析的单细胞蛋白质组学样品制备过程中的关键步骤。此外,观众还将学习等压载体实验设计的基本原理、等压载体与单细胞样品制备的质量控制方法,以及代表性结果与该方法局限性的讨论。 | 单细胞蛋白质组学分析需要具备高灵敏度、定量准确、广泛可及且稳健的方法。为满足这些要求,开发了第二代单细胞蛋白质组学(SCoPE2)方案,用于从少量样本(少至单个细胞)中定量数百至数千种蛋白质。采用该方法的实验已在10天的质谱仪运行时间内,实现了对1,500个单个哺乳动物细胞(每个细胞500–1,000种蛋白质)中超过3,000种蛋白质的定量。SCoPE2利用冻融-加热循环实现细胞裂解,无需对单细胞进行纯化处理,从而减少了样品损失,同时加快了样品制备速度并简化了自动化流程。此外,该方法使用等压载体,有助于蛋白质鉴定并减少样品损失。本视频方案提供了详细的指导,使研究者仅使用广泛可及的设备和试剂即可开展自动化的单细胞蛋白质分析。我们演示了从细胞收获到液相色谱-串联质谱(LC-MS/MS)进样的单细胞蛋白质组学分析准备过程中的关键步骤。此外,还引导观众了解等压载体实验设计的原理、等压载体与单细胞样品制备的质量控制,以及代表性结果,并讨论了该方法的局限性。 | 单细胞蛋白质组学 | 单细胞蛋白质组学分析需要具备高灵敏度、定量准确、广泛可及且稳健的方法。为满足这些要求,开发了第二代单细胞蛋白质组学(SCoPE2)方案,用于从少量样本(少至单个细胞)中定量数百至数千种蛋白质。采用该方法的实验已在10天的质谱仪运行时间内,实现了对1,500个单个哺乳动物细胞(每个细胞500–1,000种蛋白质)中超过3,000种蛋白质的定量。SCoPE2利用冻融循环实现细胞裂解,无需对单细胞进行纯化处理,从而减少了样品损失,同时加快了样品制备速度并简化了自动化流程。此外,该方法使用等压载体,有助于蛋白质鉴定并减少样品损失。本视频方案提供了详细的指导,使研究者仅使用广泛可及的设备和试剂即可开展自动化的单细胞蛋白质分析。我们演示了从细胞收获到液相色谱-串联质谱(LC-MS/MS)分析进样的单细胞蛋白质组学分析准备过程中的关键步骤。此外,还指导观众了解等压载体实验设计的原理、等压载体与单细胞样品制备的质量控制,以及代表性结果与该方法局限性的讨论。 | - | 单细胞蛋白质组学分析需要具备高灵敏度、定量准确、广泛可及且稳健的方法。为满足这些要求,单细胞蛋白质组学(SCoPE2)方案被开发为第二代技术,可用于从微量样本(少至单个细胞)中定量数百至数千种蛋白质。采用该方法的实验已在10天的质谱仪运行时间内,实现了对1,500个单个哺乳动物细胞(每个细胞500–1,000种蛋白质)中超过3,000种蛋白质的定量。SCoPE2利用冻融-加热循环实现细胞裂解,省去了单细胞纯化步骤,从而减少了样品损失,同时加快了样品制备速度并简化了自动化流程。此外,该方法使用等压载体,有助于蛋白质鉴定并减少样品损失。本视频方案提供了详细操作指导,使研究者仅需使用广泛可及的设备和试剂即可开展自动化的单细胞蛋白质分析。我们演示了从细胞收获到进样进行液相色谱-串联质谱(LC-MS/MS)分析的蛋白质组学样品制备过程中的关键步骤。此外,观众还将了解等压载体实验设计的基本原理、等压载体与单细胞样品制备的质量控制方法,以及代表性结果与该方法局限性的讨论。 | 单细胞蛋白质组学 | + | 单细胞蛋白质组学分析需要具备高灵敏度、定量准确、广泛可及且稳健的方法。为满足这些要求,开发了单细胞蛋白质组学(SCoPE2)方案,作为第二代技术,可用于从微量样本(少至单个细胞)中定量数百至数千种蛋白质。采用该方法的实验已在10天的质谱仪运行时间内,实现了对1,500个单个哺乳动物细胞(每个细胞500–1,000种蛋白质)中超过3,000种蛋白质的定量。SCoPE2利用冻融循环实现细胞裂解,无需对单细胞进行纯化处理,从而减少了样品损失,同时加快了样品制备速度并简化了自动化流程。此外,该方法使用等压载体,有助于蛋白质鉴定并减少样品损失。本视频方案提供了详细操作指导,使研究者仅使用广泛可及的设备和试剂即可开展自动化单细胞蛋白质分析。我们演示了从细胞收获到进样进行液相色谱-串联质谱(LC-MS/MS)分析的单细胞蛋白质组学样品制备过程中的关键步骤。此外,还指导观众了解等压载体实验设计的原理、等压载体与单细胞样品的质量控制,以及代表性结果,并讨论了该方法的局限性。 | - | - | 单细胞蛋白质组学 | 单细胞蛋白质组学分析需要具备高灵敏度、定量准确、广泛可及且稳健的方法。为满足这些要求,单细胞蛋白质组学(SCoPE2)方案被开发为第二代技术,可用于从微量样本(少至单个细胞)中定量数百至数千种蛋白质。采用该方法的实验已在10天的质谱仪运行时间内,实现了对1,500个单个哺乳动物细胞(每个细胞500–1,000种蛋白质)中超过3,000种蛋白质的定量。SCoPE2利用冻融-加热循环实现细胞裂解,省去了单细胞纯化步骤,从而减少了样品损失,同时加快了样品制备速度并简化了自动化流程。此外,该方法使用等压载体,有助于蛋白质鉴定并减少样品损失。本视频方案提供了详细操作指导,使研究者仅需使用广泛可及的设备和试剂即可开展自动化的单细胞蛋白质分析。我们演示了从细胞收获到进样进行液相色谱-串联质谱(LC-MS/MS)分析的蛋白质组学样品制备过程中的关键步骤。此外,观众还将了解等压载体实验设计的基本原理、等压载体与单细胞样品制备的质量控制方法,以及代表性结果与该方法局限性的讨论。 | 单细胞蛋白质组学分析需要具备高灵敏度、定量准确、广泛可及且稳健的方法。为满足这些要求,开发了单细胞蛋白质组学(SCoPE2)方案,作为第二代技术,可用于从微量样本(少至单个细胞)中定量数百至数千种蛋白质。采用该方法的实验已在10天的质谱仪运行时间内,实现了对1,500个单个哺乳动物细胞(每个细胞500–1,000个蛋白质)中超过3,000种蛋白质的定量。SCoPE2利用冻融-加热循环实现细胞裂解,无需对单细胞进行纯化处理,从而减少了样品损失,同时加快了样品制备速度并简化了自动化流程。此外,该方法使用等压载体,有助于蛋白质鉴定并减少样品损失。本视频方案提供了详细操作指导,使研究者仅使用广泛可及的设备和试剂即可开展自动化的单细胞蛋白质分析。我们演示了从细胞收获到进样进行液相色谱-串联质谱(LC-MS/MS)分析的蛋白质组学样品制备过程中的关键步骤。此外,还指导观众了解等压载体实验设计的原理、等压载体与单细胞样品的质量控制,以及代表性结果,并讨论了该方法的局限性。 | 单细胞蛋白质组学分析需要具备高灵敏度、定量准确、广泛可及且稳健的方法。为满足这些要求,开发了单细胞蛋白质组学(SCoPE2)方案,作为第二代技术,可用于从微量样本(少至单个细胞)中定量数百至数千种蛋白质。采用该方法的实验已在10天的质谱仪运行时间内,实现了对1,500个单个哺乳动物细胞(每个细胞500–1,000种蛋白质)中超过3,000种蛋白质的定量。SCoPE2利用冻融循环实现细胞裂解,无需对单细胞进行纯化处理,从而减少了样品损失,同时加快了样品制备速度并简化了自动化流程。此外,该方法使用等压载体,有助于蛋白质鉴定并减少样品损失。本视频方案提供了详细操作指导,使研究者仅使用广泛可及的设备和试剂即可开展自动化单细胞蛋白质分析。我们演示了从细胞收获到进样进行液相色谱-串联质谱(LC-MS/MS)分析的单细胞蛋白质组学样品制备过程中的关键步骤。此外,还指导观众了解等压载体实验设计的原理、等压载体与单细胞样品的质量控制,以及代表性结果,并讨论了该方法的局限性。 | 单细胞蛋白质组学分析需要具备高灵敏度、定量准确、广泛可及且稳健的方法。为满足这些要求,单细胞蛋白质组学(SCoPE2)方案被开发为第二代技术,可用于从微量样本(少至单个细胞)中定量数百至数千种蛋白质。采用该方法的实验已在10天的质谱仪运行时间内,实现了对1,500个单个哺乳动物细胞(每个细胞500–1,000种蛋白质)中超过3,000种蛋白质的定量。SCoPE2利用冻融-加热循环实现细胞裂解,无需对单细胞进行纯化处理,从而减少了样品损失,同时加快了样品制备速度并简化了自动化流程。此外,该方法使用等压载体,有助于蛋白质鉴定并减少样品损失。本视频方案提供了详细操作指导,使研究者仅需使用广泛可及的设备和试剂即可开展自动化的单细胞蛋白质分析。我们演示了从细胞收获到进样进行液相色谱-串联质谱(LC-MS/MS)分析的蛋白质组学样品制备过程中的关键步骤。此外,观众还将学习等压载体实验设计的基本原理、等压载体与单细胞样品制备的质量控制方法,以及代表性结果与该方法局限性的讨论。 | 单细胞蛋白质组学分析需要具备高灵敏度、定量准确、广泛可及且稳健的方法。为满足这些要求,单细胞蛋白质组学(SCoPE2)方案被开发为第二代技术,可用于从微量样本(少至单个细胞)中定量数百至数千种蛋白质。采用该方法的实验已在10天的质谱仪运行时间内,实现了对1,500个单个哺乳动物细胞(每个细胞500–1,000种蛋白质)中超过3,000种蛋白质的定量。SCoPE2利用冻融-加热循环实现细胞裂解,省去了单细胞纯化步骤,从而减少了样品损失,同时加快了样品制备速度并简化了自动化流程。此外,该方法使用等压载体,有助于蛋白质鉴定并减少样品损失。本视频方案提供了详细指导,使研究者仅需使用广泛可及的设备和试剂即可开展自动化的单细胞蛋白质分析。我们演示了从细胞收获到进样进行液相色谱-串联质谱(LC-MS/MS)分析的蛋白质组学样品制备过程中的关键步骤。此外,观众还将学习到有关等压载体实验设计的原理、等压载体与单细胞样品制备的质量控制方法,以及代表性结果与该方法局限性的讨论。 | 单细胞蛋白质组学分析需要具备高灵敏度、定量准确、广泛可及且稳健的方法。为满足这些要求,单细胞蛋白质组学(SCoPE2)技术被开发为第二代方法,可用于从微量样本(少至单个细胞)中定量数百至数千种蛋白质。采用该方法的实验已在10天的质谱仪运行时间内,实现了对1,500个单个哺乳动物细胞中超过3,000种蛋白质的定量分析(每个细胞500–1,000种蛋白质)。SCoPE2利用冻融-加热循环实现细胞裂解,无需对单细胞进行纯化处理,从而减少了样品损失,同时加快了样品制备速度并简化了自动化流程。此外,该方法使用等压载体,有助于蛋白质鉴定并减少样品损失。本视频协议提供了详细的指导,使研究者仅使用广泛可及的设备和试剂即可开展自动化的单细胞蛋白质分析。我们演示了从细胞收获到液相色谱-串联质谱(LC-MS/MS)分析进样的单细胞蛋白质组学样品制备过程中的关键步骤。此外,还指导观众了解等压载体实验设计的原理、等压载体与单细胞样品制备的质量控制,以及代表性结果,并讨论了该方法的局限性。 | 单细胞蛋白质组学 |
| L | 单细胞蛋白质组学 | 单细胞蛋白质组学分析需要具备高灵敏度、定量准确、广泛可及且稳健的方法。为满足这些要求,单细胞蛋白质组学(SCoPE2)方案被开发为第二代技术,可用于从微量样本(少至单个细胞)中定量数百至数千种蛋白质。采用该方法的实验已在10天的质谱仪运行时间内,实现了对1,500个单个哺乳动物细胞(每个细胞500–1,000种蛋白质)中超过3,000种蛋白质的定量。SCoPE2利用冻融-加热循环实现细胞裂解,省去了单细胞纯化步骤,从而减少了样品损失,同时加快了样品制备速度并简化了自动化流程。此外,该方法使用等压载体,有助于蛋白质鉴定并减少样品损失。本视频方案提供了详细指导,使研究者仅需使用广泛可及的设备和试剂即可开展自动化的单细胞蛋白质分析。我们演示了从细胞收获到进样进行液相色谱-串联质谱(LC-MS/MS)分析的蛋白质组学样品制备过程中的关键步骤。此外,观众还将了解等压载体实验设计的基本原理、针对等压载体和单细胞样品的质量控制方法,以及代表性结果与该方法局限性的讨论。 | 单细胞蛋白质组学分析需要具备高灵敏度、定量准确、广泛可及且稳健的方法。为满足这些要求,单细胞蛋白质组学(SCoPE2)技术被开发为第二代方法,可用于从少量样本(少至单个细胞)中定量数百至数千种蛋白质。采用该方法的实验已在10天的质谱仪运行时间内,实现了对1,500个单个哺乳动物细胞(每个细胞500–1,000种蛋白质)中超过3,000种蛋白质的定量。SCoPE2利用冻融循环实现细胞裂解,免除了对单细胞进行纯化的步骤,从而减少了样品损失,同时加快了样品制备速度并简化了自动化操作。此外,该方法使用等压载体,有助于提高蛋白质鉴定效率并减少样品损失。本视频协议提供了详细的指导,使研究者仅使用广泛可及的设备和试剂即可实现自动化单细胞蛋白质分析。我们演示了从细胞收获到进样进行液相色谱-串联质谱(LC-MS/MS)分析的单细胞蛋白质组学样品制备过程中的关键步骤。此外,观众还将学习等压载体实验设计的基本原理、等压载体与单细胞样品的质量控制方法,以及代表性结果与该方法局限性的讨论。 | 单细胞蛋白质组学 | 单细胞蛋白质组学分析需要具备高灵敏度、定量准确、广泛可及且稳健的方法。为满足这些要求,开发了单细胞蛋白质组学(SCoPE2)方案,作为第二代技术,可用于从微量样本(少至单个细胞)中定量数百至数千种蛋白质。采用该方法的实验已在10天的质谱仪运行时间内,实现了对1,500个单个哺乳动物细胞(每个细胞500–1,000种蛋白质)中超过3,000种蛋白质的定量。SCoPE2利用冻融循环实现细胞裂解,无需对单细胞进行纯化处理,从而减少了样品损失,同时加快了样品制备速度并简化了自动化流程。此外,该方法使用等压载体,有助于蛋白质鉴定并减少样品损失。本视频方案提供了详细操作指导,使研究者仅使用广泛可及的设备和试剂即可开展自动化单细胞蛋白质分析。我们演示了从细胞收获到进样进行液相色谱-串联质谱(LC-MS/MS)分析的单细胞蛋白质组学样品制备过程中的关键步骤。此外,还指导观众了解等压载体实验设计的原理、等压载体与单细胞样品的质量控制,以及代表性结果,并讨论了该方法的局限性。 | - | 单细胞蛋白质组学分析需要具备高灵敏度、定量准确、广泛可及且稳健的方法。为满足这些要求,单细胞蛋白质组学(SCoPE2)方案被开发为第二代技术,可用于从微量样本(少至单个细胞)中定量数百至数千种蛋白质。采用该方法的实验已在10天的质谱仪运行时间内,实现了对1,500个单个哺乳动物细胞(每个细胞500–1,000种蛋白质)中超过3,000种蛋白质的定量。SCoPE2利用冻融-加热循环实现细胞裂解,省去了单细胞纯化步骤,从而减少了样品损失,同时加快了样品制备速度并简化了自动化流程。此外,该方法使用等压载体,有助于提高蛋白质鉴定效率并减少样品损失。本视频方案提供了详细操作指导,使研究者仅需使用广泛可及的设备和试剂即可开展自动化的单细胞蛋白质分析。我们演示了从细胞收获到进样进行液相色谱-串联质谱(LC-MS/MS)分析的蛋白质组学样品制备过程中的关键步骤。此外,观众还将学习到有关等压载体实验设计的原理、等压载体与单细胞样品的质量控制方法,以及代表性结果与该方法局限性的讨论。 | 单细胞蛋白质组学分析需要具备高灵敏度、定量准确、广泛可及且稳健的方法。为满足这些要求,单细胞蛋白质组学(SCoPE2)方案被开发为第二代技术,可用于从微量样本(少至单个细胞)中定量数百至数千种蛋白质。采用该方法的实验已在10天的质谱仪运行时间内,实现了对1,500个单个哺乳动物细胞(每个细胞500–1,000种蛋白质)中超过3,000种蛋白质的定量。SCoPE2利用冻融-加热循环实现细胞裂解,省去了单细胞纯化步骤,从而减少了样品损失,同时加快了样品制备速度并简化了自动化流程。此外,该方法使用等压载体,有助于蛋白质鉴定并减少样品损失。本视频方案提供了详细操作指导,使研究者仅需使用广泛可及的设备和试剂即可开展自动化的单细胞蛋白质分析。我们演示了从细胞收获到进样进行液相色谱-串联质谱(LC-MS/MS)分析的蛋白质组学样品制备过程中的关键步骤。此外,观众还将学习等压载体实验设计的基本原理、等压载体与单细胞样品的质量控制方法,以及代表性结果与该方法局限性的讨论。 | 单细胞蛋白质组学 | 单细胞蛋白质组学分析需要具备高灵敏度、定量准确、广泛可及且稳健的方法。为满足这些要求,开发了第二代单细胞蛋白质组学(SCoPE2)方案,用于从微量样本(少至单个细胞)中定量数百至数千种蛋白质。采用该方法的实验已在10天的质谱仪运行时间内,实现了对1,500个单个哺乳动物细胞(每个细胞500–1,000种蛋白质)中超过3,000种蛋白质的定量。SCoPE2利用冻融-加热循环实现细胞裂解,免除了对单细胞进行纯化的步骤,从而减少了样品损失,同时加快了样品制备速度并简化了自动化流程。此外,该方法使用等压载体,有助于提高蛋白质鉴定效率并减少样品损失。本视频方案提供了详细操作指南,使研究者仅使用广泛可及的设备和试剂即可开展自动化单细胞蛋白质分析。我们演示了从细胞收获到进样进行液相色谱-串联质谱(LC-MS/MS)分析的单细胞蛋白质组学样品制备关键步骤。此外,还指导观众了解等压载体实验设计的原理、等压载体与单细胞样品的质量控制方法,以及代表性结果,并讨论该方法的局限性。 | 单细胞蛋白质组学 | - | 单细胞蛋白质组学分析需要具备高灵敏度、定量准确、广泛可及且稳健的方法。为满足这些要求,单细胞蛋白质组学(SCoPE2)技术被开发为第二代方法,可用于从少量样本(少至单个细胞)中定量数百至数千种蛋白质。采用该方法的实验已在10天的质谱仪运行时间内,实现了对1,500个单个哺乳动物细胞(每个细胞500–1,000种蛋白质)中超过3,000种蛋白质的定量。SCoPE2利用冻融循环实现细胞裂解,避免了对单细胞进行纯化的步骤,从而减少了样品损失,同时加快了样品制备速度并简化了自动化流程。此外,该方法使用等压载体,有助于蛋白质鉴定并减少样品损失。本视频协议提供了详细的指导,使研究者仅使用广泛可及的设备和试剂即可开展自动化单细胞蛋白质分析。我们演示了从细胞收获到进样进行液相色谱-串联质谱(LC-MS/MS)分析的蛋白质组学样品制备过程中的关键步骤。此外,观众还将了解等压载体实验设计的基本原理、等压载体与单细胞样品的质量控制方法,以及代表性结果与该方法局限性的讨论。 | 单细胞蛋白质组学 | 单细胞蛋白质组学(SCoPE2)自动化方案:利用等压载体实现高通量单细胞蛋白质组分析 | 单细胞蛋白质组学分析需要具备高灵敏度、定量准确、广泛可及且稳健的方法。为满足这些要求,单细胞蛋白质组学(SCoPE2)方案被开发为第二代技术,可用于从微量样本(少至单个细胞)中定量数百至数千种蛋白质。采用该方法的实验已在10天的质谱仪运行时间内,实现了对1,500个单个哺乳动物细胞(每个细胞500–1,000种蛋白质)中超过3,000种蛋白质的定量。SCoPE2利用冻融-加热循环实现细胞裂解,省去了单细胞纯化步骤,从而减少了样品损失,同时加快了样品制备速度并简化了自动化流程。此外,该方法使用等压载体,有助于蛋白质鉴定并减少样品损失。本视频方案提供了详细操作指导,使研究者仅需使用广泛可及的设备和试剂即可开展自动化的单细胞蛋白质分析。我们演示了从细胞收获到进样进行液相色谱-串联质谱(LC-MS/MS)分析的蛋白质组学样品制备过程中的关键步骤。此外,观众还将学习等压载体实验设计的基本原理、等压载体与单细胞样品的质量控制方法,以及代表性结果与该方法局限性的讨论。 | 单细胞蛋白质组学分析需要具备高灵敏度、定量准确、广泛可及且稳健的方法。为满足这些要求,开发了单细胞蛋白质组学(SCoPE2)方案,作为第二代技术,可用于从微量样本(少至单个细胞)中定量数百至数千种蛋白质。采用该方法的实验已在10天的质谱仪运行时间内,实现了对1,500个单个哺乳动物细胞(每个细胞500–1,000种蛋白质)中超过3,000种蛋白质的定量。SCoPE2利用冻融循环实现细胞裂解,无需对单细胞进行纯化处理,从而减少了样品损失,同时加快了样品制备速度并简化了自动化流程。此外,该方法使用等压载体,有助于蛋白质鉴定并减少样品损失。本视频方案提供了详细操作指导,使研究者仅使用广泛可及的设备和试剂即可开展自动化单细胞蛋白质分析。我们演示了从细胞收获到进样进行液相色谱-串联质谱(LC-MS/MS)分析的单细胞蛋白质组学样品制备过程中的关键步骤。此外,还指导观众了解等压载体实验设计的原理、等压载体与单细胞样品的质量控制,以及代表性结果,并讨论了该方法的局限性。 | 单细胞蛋白质组学 | 单细胞蛋白质组学分析需要具备高灵敏度、定量准确、广泛可及且稳健的方法。为满足这些要求,单细胞蛋白质组学(SCoPE2)方案被开发为第二代技术,可用于从微量样本(少至单个细胞)中定量数百至数千种蛋白质。采用该方法的实验已在10天的质谱仪运行时间内,实现了对1,500个单个哺乳动物细胞(每个细胞500–1,000种蛋白质)中超过3,000种蛋白质的定量。SCoPE2利用冻融-加热循环实现细胞裂解,省去了单细胞纯化步骤,从而减少了样品损失,同时加快了样品制备速度并简化了自动化流程。此外,该方法使用等压载体,有助于蛋白质鉴定并减少样品损失。本视频方案提供了详细操作指导,使研究者仅需使用广泛可及的设备和试剂即可开展自动化的单细胞蛋白质分析。我们演示了从细胞收获到进样进行液相色谱-串联质谱(LC-MS/MS)分析的蛋白质组学样品制备过程中的关键步骤。此外,观众还将学习等压载体实验设计的基本原理、等压载体与单细胞样品制备的质量控制方法,以及代表性结果与该方法局限性的讨论。 | 单细胞蛋白质组学 | 单细胞蛋白质组学 | 单细胞蛋白质组学 | + | 单细胞蛋白质组学分析需要具备高灵敏度、定量准确、广泛可及且稳健的方法。为满足这些要求,单细胞蛋白质组学(SCoPE2)方案被开发为第二代技术,可用于从微量样本(少至单个细胞)中定量数百至数千种蛋白质。采用该方法的实验已在10天的质谱仪运行时间内,实现了对1,500个单个哺乳动物细胞(每个细胞500–1,000种蛋白质)中超过3,000种蛋白质的定量。SCoPE2利用冻融循环实现细胞裂解,无需对单细胞进行纯化处理,从而减少了样品损失,同时加快了样品制备速度并简化了自动化流程。此外,该方法采用等压载体,有助于蛋白质鉴定并减少样品损失。本视频方案提供了详细指导,使研究者仅使用广泛可及的设备和试剂即可开展自动化单细胞蛋白质分析。我们演示了从细胞收获到进样进行液相色谱-串联质谱(LC-MS/MS)分析的单细胞蛋白质组学样品制备关键步骤。此外,还指导观众了解等压载体实验设计的原理、等压载体与单细胞样品的质量控制,以及代表性结果与该方法局限性的讨论。 |
| M | 单细胞蛋白质组学 | 单细胞蛋白质组学分析需要具备高灵敏度、定量准确、广泛可及且稳健的方法。为满足这些要求,单细胞蛋白质组学(SCoPE2)技术被开发为第二代方法,可用于从少量样本(少至单个细胞)中定量数百至数千种蛋白质。采用该方法的实验已在10天的质谱仪运行时间内,实现了对1,500个单个哺乳动物细胞(每个细胞500–1,000种蛋白质)中超过3,000种蛋白质的定量。SCoPE2利用冻融循环实现细胞裂解,避免了对单细胞进行纯化的步骤,从而减少了样品损失,同时加快了样品制备速度并简化了自动化流程。此外,该方法使用等压载体,有助于蛋白质鉴定并减少样品损失。本视频协议提供了详细的指导,使研究者仅使用广泛可及的设备和试剂即可开展自动化单细胞蛋白质分析。我们演示了从细胞收获到液相色谱-串联质谱(LC-MS/MS)进样分析的单细胞蛋白质组学样品制备过程中的关键步骤。此外,观众还将了解等压载体实验设计的基本原理、等压载体与单细胞样品的质量控制,以及代表性结果与该方法局限性的讨论。 | 单细胞蛋白质组学 | 单细胞蛋白质组学分析需要具备高灵敏度、定量准确、广泛可及且稳健的方法。为满足这些要求,单细胞蛋白质组学(SCoPE2)方案被开发为第二代技术,可用于从微量样本(少至单个细胞)中定量数百至数千种蛋白质。采用该方法的实验已在10天的质谱仪运行时间内,实现了对1,500个单个哺乳动物细胞(每个细胞500–1,000种蛋白质)中超过3,000种蛋白质的定量。SCoPE2利用冻融-加热循环实现细胞裂解,无需对单细胞进行纯化处理,从而减少了样品损失,同时加快了样品制备速度并简化了自动化流程。此外,该方法使用等压标签载体,有助于蛋白质鉴定并减少样品损失。本视频方案提供了详细操作指导,使研究者仅需使用广泛可及的设备和试剂即可开展自动化的单细胞蛋白质分析。我们演示了从细胞收获到进样进行液相色谱-串联质谱(LC-MS/MS)分析的蛋白质组学样品制备过程中的关键步骤。此外,观众还将学习到有关等压标签载体的实验设计原理、针对等压标签载体和单细胞样品的质量控制方法,以及代表性结果与该方法局限性的讨论。 | 单细胞蛋白质组学 | 单细胞蛋白质组学分析需要具备高灵敏度、定量准确、广泛可及且稳健的方法。为满足这些要求,开发了单细胞蛋白质组学(SCoPE2)方案,作为第二代技术,用于从微量样本(少至单个细胞)中定量数百至数千种蛋白质。采用该方法的实验已在10天的质谱仪运行时间内,实现了对1,500个单个哺乳动物细胞(每个细胞500–1,000种蛋白质)中超过3,000种蛋白质的定量。SCoPE2利用冻融循环实现细胞裂解,无需对单细胞进行纯化处理,从而减少了样品损失,同时加快了样品制备并简化了自动化流程。此外,该方法使用等压载体,有助于蛋白质鉴定并减少样品损失。本视频方案提供了详细指导,使研究者仅使用广泛可及的设备和试剂即可实现自动化单细胞蛋白质分析。我们演示了从细胞收获到进样进行液相色谱-串联质谱(LC-MS/MS)分析的蛋白组学样品制备过程中的关键步骤。此外,还指导观众了解等压载体实验设计的原理、等压载体与单细胞样品制备的质量控制,以及代表性结果与该方法局限性的讨论。 | 单细胞蛋白质组学分析需要具备高灵敏度、定量准确、广泛可及且稳健的方法。为满足这些要求,单细胞蛋白质组学(SCoPE2)方案被开发为第二代技术,可用于从微量样本(少至单个细胞)中定量数百至数千种蛋白质。采用该方法的实验已在10天的质谱仪运行时间内,实现了对1,500个单个哺乳动物细胞(每个细胞500–1,000种蛋白质)中超过3,000种蛋白质的定量。SCoPE2利用冻融-加热循环实现细胞裂解,省去了单细胞纯化步骤,从而减少了样品损失,同时加快了样品制备过程并简化了自动化操作。此外,该方法使用等压载体,有助于蛋白质鉴定并减少样品损失。本视频方案提供了详细指导,使研究者仅使用广泛可及的设备和试剂即可开展自动化的单细胞蛋白质分析。我们演示了从细胞收获到进样进行液相色谱-串联质谱(LC-MS/MS)分析的蛋白质组学样品制备过程中的关键步骤。此外,观众还将了解等压载体实验设计的基本原理、等压载体与单细胞样品制备的质量控制方法,以及代表性结果与该方法局限性的讨论。 | 单细胞蛋白质组学 | 单细胞蛋白质组学 | 单细胞蛋白质组学 | 单细胞蛋白质组学分析需要具备高灵敏度、定量准确、广泛可及且稳健的方法。为满足这些要求,单细胞蛋白质组学(SCoPE2)方案被开发为第二代技术,可用于从微量样本(少至单个细胞)中定量数百至数千种蛋白质。采用该方法的实验已在10天的质谱仪运行时间内,实现了对1,500个单个哺乳动物细胞(每个细胞500–1,000种蛋白质)中超过3,000种蛋白质的定量。SCoPE2利用冻融-加热循环实现细胞裂解,省去了单细胞纯化步骤,从而减少了样品损失,同时加快了样品制备速度并简化了自动化流程。此外,该方法使用等压载体,有助于蛋白质鉴定并减少样品损失。本视频方案提供了详细操作指导,使研究者仅需使用广泛可及的设备和试剂即可开展自动化的单细胞蛋白质分析。我们演示了从细胞收获到进样进行液相色谱-串联质谱(LC-MS/MS)分析的蛋白质组学样品制备过程中的关键步骤。此外,观众还将学习到有关等压载体实验设计的原理、等压载体与单细胞样品的质量控制方法,以及代表性结果与该方法局限性的讨论。 | 单细胞蛋白质组学分析需要具备高灵敏度、定量准确、广泛可及且稳健的方法。为满足这些要求,开发了单细胞蛋白质组学(SCoPE2)方案,作为第二代技术,可用于从微量样本(少至单个细胞)中定量数百至数千种蛋白质。采用该方法的实验已在10天的质谱仪运行时间内,实现了对1,500个单个哺乳动物细胞(每个细胞500–1,000种蛋白质)中超过3,000种蛋白质的定量。SCoPE2利用冻融循环实现细胞裂解,无需对单细胞进行纯化处理,从而减少了样品损失,同时加快了样品制备速度并简化了自动化流程。此外,该方法使用等压载体,有助于蛋白质鉴定并减少样品损失。本视频方案提供了详细操作指导,使研究者仅使用广泛可及的设备和试剂即可开展自动化单细胞蛋白质分析。我们演示了从细胞收获到进样进行液相色谱-串联质谱(LC-MS/MS)分析的单细胞蛋白质组学样品制备过程中的关键步骤。此外,还指导观众了解等压载体实验设计的原理、等压载体与单细胞样品的质量控制,以及代表性结果,并讨论了该方法的局限性。 | 单细胞蛋白质组学分析需要具备高灵敏度、定量准确、广泛可及且稳健的方法。为满足这些要求,单细胞蛋白质组学(SCoPE2)技术被开发为第二代方法,可用于从少量样本(少至单个细胞)中定量数百至数千种蛋白质。采用该方法的实验已在10天的质谱仪运行时间内,实现了对1,500个单个哺乳动物细胞(每个细胞500–1,000种蛋白质)中超过3,000种蛋白质的定量。SCoPE2利用冻融循环实现细胞裂解,避免了对单细胞进行纯化的步骤,从而减少了样品损失,同时加快了样品制备速度并简化了自动化流程。此外,该方法使用等压载体,有助于蛋白质鉴定并减少样品损失。本视频协议提供了详细的指导,使研究者仅使用广泛可及的设备和试剂即可开展自动化单细胞蛋白质分析。我们演示了从细胞收获到进样进行液相色谱-串联质谱(LC-MS/MS)分析的蛋白组学样品制备过程中的关键步骤。此外,观众还将了解等压载体实验设计的基本原理、等压载体与单细胞样品的质量控制方法,以及代表性结果与该方法局限性的讨论。 | 单细胞蛋白质组学 | 单细胞蛋白质组学 | 单细胞蛋白质组学 | 单细胞蛋白质组学分析需要具备高灵敏度、定量准确、广泛可及且稳健的方法。为满足这些要求,单细胞蛋白质组学(SCoPE2)方案被开发为第二代技术,可用于从微量样本(少至单个细胞)中定量数百至数千种蛋白质。采用该方法的实验已在10天的质谱仪运行时间内,实现了对1,500个单个哺乳动物细胞(每个细胞500–1,000种蛋白质)中超过3,000种蛋白质的定量。SCoPE2利用冻融-加热循环实现细胞裂解,无需对单细胞进行纯化处理,从而减少了样品损失,同时加快了样品制备速度并简化了自动化流程。此外,该方法使用等压载体,有助于蛋白质鉴定并减少样品损失。本视频方案提供了详细操作指导,使研究者仅需使用广泛可及的设备和试剂即可开展自动化的单细胞蛋白质分析。我们演示了从细胞收获到进样进行液相色谱-串联质谱(LC-MS/MS)分析的蛋白质组学样品制备过程中的关键步骤。此外,观众还将了解等压载体实验设计的基本原理、等压载体与单细胞样品制备的质量控制方法,以及代表性结果与该方法局限性的讨论。 | 单细胞蛋白质组学分析需要具备高灵敏度、定量准确、广泛可及且稳健的方法。为满足这些要求,单细胞蛋白质组学(SCoPE2)方案被开发为第二代技术,可用于从微量样本(少至单个细胞)中定量数百至数千种蛋白质。采用该方法的实验已在10天的质谱仪运行时间内,实现了对1,500个单个哺乳动物细胞(每个细胞500–1,000种蛋白质)中超过3,000种蛋白质的定量。SCoPE2利用冻融-加热循环实现细胞裂解,省去了单细胞纯化步骤,从而减少了样品损失,同时加快了样品制备速度并简化了自动化流程。此外,该方法使用等压载体,有助于蛋白质鉴定并减少样品损失。本视频方案提供了详细操作指南,使研究者仅需使用广泛可及的设备和试剂即可开展自动化的单细胞蛋白质分析。我们演示了从细胞收获到进样进行液相色谱-串联质谱(LC-MS/MS)分析的蛋白质组学样品制备过程中的关键步骤。此外,观众还将学习到有关等压载体的实验设计原理、等压载体与单细胞样品的质量控制方法,以及代表性结果与该方法局限性的讨论。 | 单细胞蛋白质组学 | + | 单细胞蛋白质组学分析需要具备高灵敏度、定量准确、广泛可及且稳健的方法。为满足这些要求,开发了单细胞蛋白质组学(SCoPE2)方案,作为第二代技术,可用于从微量样本(少至单个细胞)中定量数百至数千种蛋白质。采用该方法的实验已在10天的质谱仪运行时间内,实现了对1,500个单个哺乳动物细胞(每个细胞500–1,000种蛋白质)中超过3,000种蛋白质的定量。SCoPE2利用冻融循环实现细胞裂解,无需对单细胞进行纯化处理,从而减少了样品损失,同时加快了样品制备速度并简化了自动化流程。此外,该方法使用等压载体,有助于蛋白质鉴定并减少样品损失。本视频方案提供了详细指导,使研究者仅使用广泛可及的设备和试剂即可开展自动化单细胞蛋白质分析。我们演示了从细胞收获到液相色谱-串联质谱(LC-MS/MS)分析进样前,用于蛋白质组学分析的单细胞制备过程中的关键步骤。此外,还指导观众了解等压载体实验设计的原理、等压载体与单细胞样品制备的质量控制,以及代表性结果与该方法局限性的讨论。 | 单细胞蛋白质组学 | 单细胞蛋白质组学分析需要具备高灵敏度、定量准确、广泛可及且稳健的方法。为满足这些要求,开发了单细胞蛋白质组学(SCoPE2)方案,作为第二代技术,可用于从微量样本(少至单个细胞)中定量数百至数千种蛋白质。采用该方法的实验已在10天的质谱仪运行时间内,实现了对1,500个单个哺乳动物细胞(每个细胞500–1,000种蛋白质)中超过3,000种蛋白质的定量。SCoPE2利用冻融循环实现细胞裂解,无需对单细胞进行纯化处理,从而减少了样品损失,同时加快了样品制备速度并简化了自动化流程。此外,该方法使用等压载体,有助于蛋白质鉴定并减少样品损失。本视频协议提供了详细指导,使研究者仅使用广泛可及的设备和试剂即可开展自动化的单细胞蛋白质分析。我们演示了从细胞收获到进样进行液相色谱-串联质谱(LC-MS/MS)分析的蛋白组学样品制备过程中的关键步骤。此外,还指导观众了解等压载体实验设计的原理、等压载体与单细胞样品制备的质量控制,以及代表性结果与该方法局限性的讨论。 | 单细胞蛋白质组学分析需要具备高灵敏度、定量准确、广泛可及且稳健的方法。为满足这些要求,开发了第二代单细胞蛋白质组学(SCoPE2)方案,用于从微量样本(少至单个细胞)中定量数百至数千种蛋白质。采用该方法的实验已在10天的质谱仪运行时间内,实现了对1,500个单个哺乳动物细胞(每个细胞500–1,000种蛋白质)中超过3,000种蛋白质的定量。SCoPE2利用冻融循环实现细胞裂解,无需对单细胞进行纯化处理,从而减少了样品损失,同时加快了样品制备速度并简化了自动化流程。此外,该方法使用等压载体,有助于蛋白质鉴定并减少样品损失。本视频方案提供了详细的指导,使研究者仅使用广泛可及的设备和试剂即可开展自动化的单细胞蛋白质分析。我们演示了从细胞收获到进样进行液相色谱-串联质谱(LC-MS/MS)分析的单细胞蛋白质组学样品制备过程中的关键步骤。此外,还指导观众了解等压载体实验设计的原理、等压载体与单细胞样品制备的质量控制方法,以及代表性结果与该方法局限性的讨论。 |
| N | + | 单细胞蛋白质组学分析需要具备高灵敏度、定量准确、广泛可及且稳健的方法。为满足这些要求,开发了单细胞蛋白质组学(SCoPE2)方案,作为第二代技术,可用于从微量样本(少至单个细胞)中定量数百至数千种蛋白质。采用该方法的实验已在10天的质谱仪运行时间内,实现了对1,500个单个哺乳动物细胞(每个细胞500–1,000种蛋白质)中超过3,000种蛋白质的定量。SCoPE2利用冻融-加热循环实现细胞裂解,无需对单细胞进行纯化处理,从而减少了样品损失,同时加快了样品制备速度并简化了自动化流程。此外,该方法使用等压载体,有助于蛋白质鉴定并减少样品损失。本视频方案提供了详细的指导,以帮助研究者仅使用广泛可及的设备和试剂即可开展自动化的单细胞蛋白质分析。我们演示了从细胞收获到液相色谱-串联质谱(LC-MS/MS)分析进样的单细胞蛋白质组学样品制备过程中的关键步骤。此外,还指导观众了解等压载体实验设计的原理、等压载体与单细胞样品制备的质量控制,以及代表性结果与该方法局限性的讨论。 | 单细胞蛋白质组学分析需要具备高灵敏度、定量准确、广泛可及且稳健的方法。为满足这些要求,开发了单细胞蛋白质组学(SCoPE2)方案,作为第二代技术,可用于从微量样本(少至单个细胞)中定量数百至数千种蛋白质。采用该方法的实验已在10天的质谱仪运行时间内,实现了对1,500个单个哺乳动物细胞(每个细胞500–1,000种蛋白质)中超过3,000种蛋白质的定量。SCoPE2利用冻融循环实现细胞裂解,无需对单细胞进行纯化处理,从而减少了样品损失,同时加快了样品制备速度并简化了自动化流程。此外,该方法使用等压载体,有助于蛋白质鉴定并减少样品损失。本视频方案提供了详细操作指导,使研究者仅使用广泛可及的设备和试剂即可开展自动化单细胞蛋白质分析。我们演示了从细胞收获到进样进行液相色谱-串联质谱(LC-MS/MS)分析的单细胞蛋白质组学样品制备过程中的关键步骤。此外,还指导观众了解等压载体实验设计的原理、等压载体与单细胞样品制备的质量控制方法,以及代表性结果,并讨论了该方法的局限性。 | 单细胞蛋白质组学 | 单细胞蛋白质组学 | 单细胞蛋白质组学 | 单细胞蛋白质组学分析需要具备高灵敏度、定量准确、广泛可及且稳健的方法。为满足这些要求,单细胞蛋白质组学(SCoPE2)方案被开发为第二代技术,可用于从微量样本(少至单个细胞)中定量数百至数千种蛋白质。采用该方法的实验已在10天的质谱仪运行时间内,实现了对1,500个单个哺乳动物细胞(每个细胞500–1,000种蛋白质)中超过3,000种蛋白质的定量。SCoPE2利用冻融-加热循环实现细胞裂解,省去了单细胞纯化步骤,从而减少了样品损失,同时加快了样品制备速度并简化了自动化流程。此外,该方法使用等压载体,有助于蛋白质鉴定并减少样品损失。本视频方案提供了详细操作指南,使研究者仅需使用广泛可及的设备和试剂即可开展自动化的单细胞蛋白质分析。我们演示了从细胞收获到进样进行液相色谱-串联质谱(LC-MS/MS)分析的蛋白质组学样品制备过程中的关键步骤。此外,观众还将学习到有关等压载体的实验设计原理、等压载体与单细胞样品的质量控制方法,以及代表性结果与该方法局限性的讨论。 | 单细胞蛋白质组学分析需要具备高灵敏度、定量准确、广泛可及且稳健的方法。为满足这些要求,开发了第二代单细胞蛋白质组学(SCoPE2)方案,用于从微量样本(少至单个细胞)中定量数百至数千种蛋白质。采用该方法的实验已在10天的质谱仪运行时间内,实现了对1,500个单个哺乳动物细胞(每个细胞500–1,000种蛋白质)中超过3,000种蛋白质的定量。SCoPE2利用冻融循环实现细胞裂解,无需对单细胞进行纯化处理,从而减少了样品损失,同时加快了样品制备速度并简化了自动化流程。此外,该方法使用等压载体,有助于蛋白质鉴定并减少样品损失。本视频方案提供了详细指导,使研究者仅使用广泛可及的设备和试剂即可开展自动化的单细胞蛋白质分析。我们演示了从细胞收获到进样进行液相色谱-串联质谱(LC-MS/MS)分析的蛋白质组学样品制备关键步骤。此外,还指导观众了解等压载体实验设计的原理、等压载体与单细胞样品制备的质量控制,以及代表性结果与该方法局限性的讨论。 | 单细胞蛋白质组学分析需要具备高灵敏度、定量准确、广泛可及且稳健的方法。为满足这些要求,单细胞蛋白质组学(SCoPE2)方案被开发为第二代技术,可用于从微量样本(少至单个细胞)中定量数百至数千种蛋白质。采用该方法的实验已在10天的质谱仪运行时间内,实现了对1,500个单个哺乳动物细胞(每个细胞500–1,000种蛋白质)中超过3,000种蛋白质的定量。SCoPE2利用冻融-加热循环实现细胞裂解,无需对单细胞进行纯化处理,从而减少了样品损失,同时加快了样品制备速度并简化了自动化流程。此外,该方法使用等压载体,有助于蛋白质鉴定并进一步降低样品损失。本视频方案提供了详细操作指导,使研究者仅需使用广泛可及的设备和试剂即可开展自动化的单细胞蛋白质分析。我们演示了从细胞收获到进样进行液相色谱-串联质谱(LC-MS/MS)分析的蛋白质组学样品制备过程中的关键步骤。此外,观众还将了解等压载体实验设计的基本原理、针对等压载体和单细胞样品的质量控制方法,以及代表性结果与该方法局限性的讨论。 | 单细胞蛋白质组学 | 单细胞蛋白质组学分析需要具备高灵敏度、定量准确、广泛可及且稳健的方法。为满足这些要求,单细胞蛋白质组学(SCoPE2)技术被开发为第二代方法,可用于从少量样本(少至单个细胞)中定量数百至数千种蛋白质。采用该方法的实验已在10天的质谱仪运行时间内,实现了对1,500个单个哺乳动物细胞(每个细胞500–1,000种蛋白质)中超过3,000种蛋白质的定量。SCoPE2利用冻融循环实现细胞裂解,避免了对单细胞进行纯化的步骤,从而减少了样品损失,同时加快了样品制备速度并简化了自动化流程。此外,该方法使用等压载体,有助于蛋白质鉴定并减少样品损失。本视频协议提供了详细的指导,使研究者仅使用广泛可及的设备和试剂即可开展自动化的单细胞蛋白质分析。我们演示了从细胞收获到进样进行液相色谱-串联质谱(LC-MS/MS)分析的蛋白组学样品制备过程中的关键步骤。此外,还指导观众了解等压载体实验设计的原理、等压载体与单细胞样品制备的质量控制,以及代表性结果与该方法局限性的讨论。 | 单细胞蛋白质组学分析需要具备高灵敏度、定量准确、广泛可及且稳健的方法。为满足这些要求,开发了单细胞蛋白质组学(SCoPE2)方案,作为第二代技术,可用于从微量样本(少至单个细胞)中定量数百至数千种蛋白质。采用该方法的实验已在10天的质谱仪运行时间内,实现了对1,500个单个哺乳动物细胞(每个细胞500–1,000种蛋白质)中超过3,000种蛋白质的定量。SCoPE2利用冻融循环实现细胞裂解,无需对单细胞进行纯化处理,从而减少了样品损失,同时加快了样品制备速度并简化了自动化流程。此外,该方法使用等压载体,有助于蛋白质鉴定并减少样品损失。本视频方案提供了详细指导,使研究者仅使用广泛可及的设备和试剂即可开展自动化的单细胞蛋白质分析。我们演示了从细胞收获到进样进行液相色谱-串联质谱(LC-MS/MS)分析的蛋白质组学样品制备过程中的关键步骤。此外,还指导观众了解等压载体实验设计的原理、等压载体与单细胞样品的质量控制,以及代表性结果与该方法局限性的讨论。 | 单细胞蛋白质组学 | 单细胞蛋白质组学 | 单细胞蛋白质组学分析需要具备高灵敏度、定量准确、广泛可及且稳健的方法。为满足这些要求,单细胞蛋白质组学(SCoPE2)方案被开发为第二代技术,可用于从微量样本(少至单个细胞)中定量数百至数千种蛋白质。采用该方法的实验已在10天的质谱仪运行时间内,实现了对1,500个单个哺乳动物细胞(每个细胞500–1,000种蛋白质)中超过3,000种蛋白质的定量。SCoPE2利用冻融-加热循环实现细胞裂解,无需对单细胞进行纯化处理,从而减少了样品损失,同时加快了样品制备速度并简化了自动化流程。此外,该方法使用等压载体,有助于蛋白质鉴定并减少样品损失。本视频方案提供了详细操作指导,使研究者仅需使用广泛可及的设备和试剂即可开展自动化的单细胞蛋白质分析。我们演示了从细胞收获到进样进行液相色谱-串联质谱(LC-MS/MS)分析的蛋白质组学样品制备过程中的关键步骤。此外,观众还将学习等压载体实验设计的基本原理、等压载体与单细胞样品的质量控制方法,以及代表性结果与该方法局限性的讨论。 | 单细胞蛋白质组学 | 单细胞蛋白质组学分析需要具备高灵敏度、定量准确、广泛可及且稳健的方法。为满足这些要求,单细胞蛋白质组学(SCoPE2)技术被开发为第二代方法,可用于从少量样本(少至单个细胞)中定量数百至数千种蛋白质。采用该方法的实验已在10天的质谱仪运行时间内,实现了对1,500个单个哺乳动物细胞(每个细胞500–1,000种蛋白质)中超过3,000种蛋白质的定量。SCoPE2利用冻融循环实现细胞裂解,避免了对单细胞进行纯化的步骤,从而减少了样品损失,同时加快了样品制备速度并简化了自动化流程。此外,该方法使用等压载体,有助于蛋白质鉴定并减少样品损失。本视频协议提供了详细的指导,使研究者仅使用广泛可及的设备和试剂即可开展自动化单细胞蛋白质分析。我们演示了从细胞收获到进样进行液相色谱-串联质谱(LC-MS/MS)分析的蛋白质组学样品制备过程中的关键步骤。此外,观众还将了解等压载体实验设计的基本原理、等压载体与单细胞样品的质量控制方法,以及代表性结果与该方法局限性的讨论。 | 单细胞蛋白质组学 | 单细胞蛋白质组学分析需要具备高灵敏度、定量准确、广泛可及且稳健的方法。为满足这些要求,单细胞蛋白质组学(SCoPE2)技术被开发为第二代方法,可用于从少量样本(少至单个细胞)中定量数百至数千种蛋白质。采用该方法的实验已在10天的质谱仪运行时间内,实现了对1,500个单个哺乳动物细胞(每个细胞500–1,000种蛋白质)中超过3,000种蛋白质的定量。SCoPE2利用冻融循环实现细胞裂解,无需对单细胞进行纯化处理,从而减少了样品损失,同时加快了样品制备速度并简化了自动化流程。此外,该方法使用等压载体,有助于提高蛋白质鉴定效率并减少样品损失。本视频协议提供了详细的指导,使研究者仅使用广泛可及的设备和试剂即可开展自动化的单细胞蛋白质分析。我们演示了从细胞收获到进样进行液相色谱-串联质谱(LC-MS/MS)分析的单细胞蛋白质组学样品制备过程中的关键步骤。此外,观众还将了解等压载体实验设计的原理、等压载体与单细胞样品的质量控制方法,以及代表性结果与该方法局限性的讨论。 | 单细胞蛋白质组学分析需要具备高灵敏度、定量准确、广泛可及且稳健的方法。为满足这些要求,单细胞蛋白质组学(SCoPE2)方案被开发为第二代技术,可用于从微量样本(少至单个细胞)中定量数百至数千种蛋白质。采用该方法的实验已在10天的质谱仪运行时间内,实现了对1,500个单个哺乳动物细胞(每个细胞500–1,000种蛋白质)中超过3,000种蛋白质的定量。SCoPE2利用冻融-加热循环实现细胞裂解,无需对单细胞进行纯化处理,从而减少了样品损失,同时加快了样品制备速度并简化了自动化流程。此外,该方法使用等压载体,有助于蛋白质鉴定并减少样品损失。本视频方案提供了详细操作指导,使研究者仅需使用广泛可及的设备和试剂即可开展自动化的单细胞蛋白质分析。我们演示了从细胞收获到进样进行液相色谱-串联质谱(LC-MS/MS)分析的蛋白质组学样品制备过程中的关键步骤。此外,观众还将学习等压载体实验设计的基本原理、等压载体与单细胞样品的质量控制方法,以及代表性结果与该方法局限性的讨论。 | 单细胞蛋白质组学 | 单细胞蛋白质组学分析需要具备高灵敏度、定量准确、广泛可及且稳健的方法。为满足这些要求,单细胞蛋白质组学(SCoPE2)技术被开发为第二代方法,可用于从极少量样本(少至单个细胞)中定量数百至数千种蛋白质。采用该方法的实验已在10天的质谱仪运行时间内,实现了对1,500个单个哺乳动物细胞中超过3,000种蛋白质的定量(每个细胞500–1,000种蛋白质)。SCoPE2利用冻融-加热循环实现细胞裂解,无需对单细胞进行纯化处理,从而减少了样品损失,同时加快了样品制备速度并简化了自动化流程。此外,该方法使用等压载体,有助于蛋白质鉴定并减少样品损失。本视频协议提供了详细的指导,使研究者仅使用广泛可及的设备和试剂即可实现自动化单细胞蛋白质分析。我们演示了从细胞收获到进样进行液相色谱-串联质谱(LC-MS/MS)分析的蛋白质组学样品制备关键步骤。此外,观众还将了解等压载体实验设计的基本原理、等压载体与单细胞样品的质量控制方法,以及代表性结果与该方法局限性的讨论。 | 单细胞蛋白质组学分析需要具备高灵敏度、定量准确、广泛可及且稳健的方法。为满足这些要求,单细胞蛋白质组学(SCoPE2)方案被开发为第二代技术,可用于从微量样本(少至单个细胞)中定量数百至数千种蛋白质。采用该方法的实验已在10天的质谱仪运行时间内,实现了对1,500个单个哺乳动物细胞(每个细胞500–1,000种蛋白质)中超过3,000种蛋白质的定量。SCoPE2利用冻融-加热循环实现细胞裂解,省去了单细胞纯化步骤,从而减少了样品损失,同时加快了样品制备速度并简化了自动化流程。此外,该方法使用等压载体,有助于蛋白质鉴定并减少样品损失。本视频方案提供了详细操作指导,使研究者仅需使用广泛可及的设备和试剂即可开展自动化的单细胞蛋白质分析。我们演示了从细胞收获到进样进行液相色谱-串联质谱(LC-MS/MS)分析的蛋白质组学样品制备过程中的关键步骤。此外,观众还将学习等压载体实验设计的基本原理、等压载体与单细胞样品制备的质量控制方法,以及代表性结果与该方法局限性的讨论。 | 单细胞蛋白质组学 |
| O | 单细胞蛋白质组学分析需要具备高灵敏度、定量准确、广泛可及且稳健的方法。为满足这些要求,单细胞蛋白质组学(SCoPE2)方案被开发为第二代技术,可用于从微量样本(少至单个细胞)中定量数百至数千种蛋白质。采用该方法的实验已在10天的质谱仪运行时间内,实现了对1,500个单个哺乳动物细胞(每个细胞500–1,000种蛋白质)中超过3,000种蛋白质的定量。SCoPE2利用冻融-加热循环实现细胞裂解,省去了单细胞纯化步骤,从而减少了样品损失,同时加快了样品制备速度并简化了自动化流程。此外,该方法使用等压载体,有助于蛋白质鉴定并减少样品损失。本视频方案提供了详细操作指导,使研究者仅需使用广泛可及的设备和试剂即可开展自动化的单细胞蛋白质分析。我们演示了从细胞收获到进样进行液相色谱-串联质谱(LC-MS/MS)分析的蛋白质组学样品制备过程中的关键步骤。此外,观众还将学习到有关等压载体实验设计的原理、等压载体与单细胞样品的质量控制方法,以及代表性结果与该方法局限性的讨论。 | 单细胞蛋白质组学 | 单细胞蛋白质组学分析需要具备高灵敏度、定量准确、广泛可及且稳健的方法。为满足这些要求,单细胞蛋白质组学(SCoPE2)技术被开发为第二代方法,可用于从少量样本(少至单个细胞)中定量数百至数千种蛋白质。采用该方法的实验已在10天的质谱仪运行时间内,实现了对1,500个单个哺乳动物细胞(每个细胞500–1,000种蛋白质)中超过3,000种蛋白质的定量。SCoPE2利用冻融循环实现细胞裂解,避免了对单细胞进行纯化的步骤,从而减少了样品损失,同时加快了样品制备速度并简化了自动化流程。此外,该方法使用等压载体,有助于蛋白质鉴定并减少样品损失。本视频协议提供了详细的指导,使研究者仅使用广泛可及的设备和试剂即可开展自动化的单细胞蛋白质分析。我们演示了从细胞收获到进样进行液相色谱-串联质谱(LC-MS/MS)分析的蛋白组学样品制备过程中的关键步骤。此外,观众还将了解等压载体实验设计的基本原理、等压载体与单细胞样品制备的质量控制方法,以及代表性结果与该方法局限性的讨论。 | 单细胞蛋白质组学 | + | 单细胞蛋白质组学分析需要具备高灵敏度、定量准确、广泛可及且稳健的方法。为满足这些要求,开发了单细胞蛋白质组学(SCoPE2)方案,作为第二代技术,用于从微量样本(少至单个细胞)中定量数百至数千种蛋白质。采用该方法的实验已在10天的质谱仪运行时间内,实现了对1,500个单个哺乳动物细胞(每个细胞500–1,000种蛋白质)中超过3,000种蛋白质的定量。SCoPE2利用冻融循环实现细胞裂解,无需对单个细胞进行纯化步骤,从而减少了样品损失,同时加快了样品制备并简化了自动化流程。此外,该方法使用等压载体,有助于蛋白质鉴定并减少样品损失。本视频协议提供了详细的指导,使研究者仅使用广泛可及的设备和试剂即可实现自动化单细胞蛋白质分析。我们演示了从细胞收获到进样进行液相色谱-串联质谱(LC-MS/MS)分析的蛋白质组学样品制备过程中的关键步骤。此外,还指导观众了解等压载体实验设计的原理、等压载体与单细胞样品制备的质量控制,以及代表性结果与该方法局限性的讨论。 | 单细胞蛋白质组学分析需要具备高灵敏度、定量准确、广泛可及且稳健的方法。为满足这些要求,单细胞蛋白质组学(SCoPE2)技术被开发为第二代方法,可用于从少量样本(少至单个细胞)中定量数百至数千种蛋白质。采用该方法的实验已在10天的质谱仪运行时间内,实现了对1,500个单个哺乳动物细胞(每个细胞500–1,000种蛋白质)中超过3,000种蛋白质的定量。SCoPE2利用冻融循环实现细胞裂解,避免了对单细胞进行纯化的步骤,从而减少了样品损失,同时加快了样品制备速度并简化了自动化流程。此外,该方法使用等压载体,有助于蛋白质鉴定并减少样品损失。本视频协议提供了详细的指导,使研究者仅使用广泛可及的设备和试剂即可开展自动化单细胞蛋白质分析。我们演示了从细胞收获到进样进行液相色谱-串联质谱(LC-MS/MS)分析的蛋白质组学样品制备过程中的关键步骤。此外,观众还将了解等压载体实验设计的基本原理、等压载体与单细胞样品的质量控制方法,以及代表性结果与该方法局限性的讨论。 | 单细胞蛋白质组学 | 单细胞蛋白质组学 | 单细胞蛋白质组学分析需要具备高灵敏度、定量准确、广泛可及且稳健的方法。为满足这些要求,单细胞蛋白质组学(SCoPE2)技术被开发为第二代方法,可用于从少量样本(少至单个细胞)中定量数百至数千种蛋白质。采用该方法的实验已在10天的质谱仪运行时间内,实现了对1,500个单个哺乳动物细胞(每个细胞500–1,000种蛋白质)中超过3,000种蛋白质的定量。SCoPE2利用冻融循环实现细胞裂解,无需对单细胞进行纯化处理,从而减少了样品损失,同时加快了样品制备并简化了自动化流程。此外,该方法使用等压载体,有助于蛋白质鉴定并减少样品损失。本视频协议提供了详细指导,使研究者仅使用广泛可及的设备和试剂即可开展自动化单细胞蛋白质分析。我们演示了从细胞收获到进样进行液相色谱-串联质谱(LC-MS/MS)分析的单细胞蛋白质组学样品制备过程中的关键步骤。此外,观众还将了解等压载体实验设计的基本原理、等压载体与单细胞样品的质量控制,以及代表性结果与该方法局限性的讨论。 | - | 单细胞蛋白质组学 | 单细胞蛋白质组学 | 单细胞蛋白质组学 | 单细胞蛋白质组学分析需要具备高灵敏度、定量准确、广泛可及且稳健的方法。为满足这些要求,单细胞蛋白质组学(SCoPE2)技术被开发为第二代方法,可用于从少量样本(少至单个细胞)中定量数百至数千种蛋白质。采用该方法的实验已在10天的质谱仪运行时间内,实现了对1,500个单个哺乳动物细胞(每个细胞500–1,000种蛋白质)中超过3,000种蛋白质的定量。SCoPE2利用冻融循环实现细胞裂解,避免了单细胞纯化步骤,从而减少了样品损失,同时加快了样品制备速度并简化了自动化流程。此外,该方法使用等压载体,有助于蛋白质鉴定并减少样品损失。本视频协议提供了详细指导,使研究者仅使用广泛可及的设备和试剂即可开展自动化的单细胞蛋白质分析。我们演示了从细胞收获到液相色谱-串联质谱(LC-MS/MS)进样分析的单细胞蛋白质组学样品制备过程中的关键步骤。此外,观众还将了解等压载体实验设计的基本原理、等压载体与单细胞样品的质量控制方法,以及代表性结果与该方法局限性的讨论。 | 单细胞蛋白质组学分析需要具备高灵敏度、定量准确、广泛可及且稳健的方法。为满足这些要求,开发了单细胞蛋白质组学(SCoPE2)方案,作为第二代技术,可用于从微量样本(少至单个细胞)中定量数百至数千种蛋白质。采用该方法的实验已在10天的质谱仪运行时间内,实现了对1,500个单个哺乳动物细胞(每个细胞500–1,000种蛋白质)中超过3,000种蛋白质的定量。SCoPE2利用冻融循环实现细胞裂解,无需对单细胞进行纯化处理,从而减少了样品损失,同时加快了样品制备速度并简化了自动化流程。此外,该方法使用等压载体,有助于蛋白质鉴定并减少样品损失。本视频方案提供了详细操作指导,使研究者仅使用广泛可及的设备和试剂即可开展自动化单细胞蛋白质分析。我们演示了从细胞收获到进样进行液相色谱-串联质谱(LC-MS/MS)分析的单细胞蛋白质组学样品制备过程中的关键步骤。此外,还指导观众了解等压载体实验设计的原理、等压载体与单细胞样品的质量控制,以及代表性结果,并讨论了该方法的局限性。 | 单细胞蛋白质组学 | 单细胞蛋白质组学分析需要具备高灵敏度、定量准确、广泛可及且稳健的方法。为满足这些要求,单细胞蛋白质组学(SCoPE2)方案被开发为第二代技术,可用于从微量样本(少至单个细胞)中定量数百至数千种蛋白质。采用该方法的实验已在10天的质谱仪运行时间内,实现了对1,500个单个哺乳动物细胞(每个细胞500–1,000种蛋白质)中超过3,000种蛋白质的定量。SCoPE2利用冻融-加热循环实现细胞裂解,无需对单细胞进行纯化处理,从而减少了样品损失,同时加快了样品制备速度并简化了自动化流程。此外,该方法使用等压载体,有助于蛋白质鉴定并减少样品损失。本视频方案提供了详细操作指导,使研究者仅需使用广泛可及的设备和试剂即可开展自动化的单细胞蛋白质分析。我们演示了从细胞收获到进样进行液相色谱-串联质谱(LC-MS/MS)分析的蛋白质组学样品制备过程中的关键步骤。此外,观众还将学习到有关等压载体实验设计的原理、等压载体与单细胞样品制备的质量控制方法,以及代表性结果与该方法局限性的讨论。 | 单细胞蛋白质组学分析需要具备高灵敏度、定量准确、广泛可及且稳健的方法。为满足这些要求,开发了单细胞蛋白质组学(SCoPE2)方案,作为第二代技术,可用于从微量样本(少至单个细胞)中定量数百至数千种蛋白质。采用该方法的实验已在10天的质谱仪运行时间内,实现了对1,500个单个哺乳动物细胞(每个细胞500–1,000种蛋白质)中超过3,000种蛋白质的定量。SCoPE2利用冻融循环实现细胞裂解,无需对单细胞进行纯化处理,从而减少了样品损失,同时加快了样品制备速度并简化了自动化流程。此外,该方法使用等压载体,有助于蛋白质鉴定并减少样品损失。本视频方案提供了详细的指导,使研究者仅使用广泛可及的设备和试剂即可开展自动化单细胞蛋白质分析。我们演示了从细胞收获到液相色谱-串联质谱(LC-MS/MS)分析进样前,用于蛋白质组学分析的单细胞制备过程中的关键步骤。此外,还指导观众了解等压载体实验设计的原理、等压载体与单细胞样品的质量控制,以及代表性结果,并讨论了该方法的局限性。 | 单细胞蛋白质组学分析需要具备高灵敏度、定量准确、广泛可及且稳健的方法。为满足这些要求,单细胞蛋白质组学(SCoPE2)方案被开发为第二代技术,可用于从微量样本(少至单个细胞)中定量数百至数千种蛋白质。采用该方法的实验已在10天的质谱仪运行时间内,实现了对1,500个单个哺乳动物细胞(每个细胞500–1,000种蛋白质)中超过3,000种蛋白质的定量。SCoPE2利用冻融-加热循环实现细胞裂解,无需对单细胞进行纯化处理,从而减少了样品损失,同时加快了样品制备速度并简化了自动化流程。此外,该方法使用等压载体,有助于提高蛋白质鉴定效率并减少样品损失。本视频方案提供了详细操作指导,使研究者仅需使用广泛可及的设备和试剂即可开展自动化的单细胞蛋白质分析。我们演示了从细胞收获到进样进行液相色谱-串联质谱(LC-MS/MS)分析的蛋白质组学样品制备过程中的关键步骤。此外,观众还将学习到有关等压载体实验设计的基本原理、等压载体与单细胞样品制备的质量控制方法,以及代表性结果与该方法局限性的讨论。 | 单细胞蛋白质组学 | 单细胞蛋白质组学 | 单细胞蛋白质组学分析需要具备高灵敏度、定量准确、广泛可及且稳健的方法。为满足这些要求,单细胞蛋白质组学(SCoPE2)技术被开发为第二代方法,可用于从少量样本(少至单个细胞)中定量数百至数千种蛋白质。采用该方法的实验已在10天的质谱仪运行时间内,实现了对1,500个单个哺乳动物细胞(每个细胞500–1,000种蛋白质)中超过3,000种蛋白质的定量。SCoPE2利用冻融循环实现细胞裂解,免除了对单细胞进行纯化的步骤,从而减少了样品损失,同时加快了样品制备速度并简化了自动化流程。此外,该方法使用等压载体,有助于蛋白质鉴定并减少样品损失。本视频协议提供了详细指导,使研究者仅使用广泛可及的设备和试剂即可实现自动化的单细胞蛋白质分析。我们演示了从细胞收获到进样进行液相色谱-串联质谱(LC-MS/MS)分析的单细胞蛋白质组学样品制备过程中的关键步骤。此外,观众还将了解等压载体实验设计的原理、等压载体与单细胞样品制备的质量控制,以及代表性结果与该方法局限性的讨论。 | 单细胞蛋白质组学分析需要具备高灵敏度、定量准确、广泛可及且稳健的方法。为满足这些要求,单细胞蛋白质组学(SCoPE2)技术被开发为第二代方法,可用于从微量样本(少至单个细胞)中定量数百至数千种蛋白质。采用该方法的实验已在10天的质谱仪运行时间内,实现了对1,500个单个哺乳动物细胞(每个细胞500–1,000种蛋白质)中超过3,000种蛋白质的定量。SCoPE2利用冻融循环实现细胞裂解,免除了对单细胞样本进行纯化的步骤,从而减少了样本损失,同时加快了样本制备速度并简化了自动化流程。此外,该方法使用等压载体,有助于蛋白质鉴定并减少样本损失。本视频协议提供了详细指导,使研究者仅使用广泛可及的设备和试剂即可开展自动化的单细胞蛋白质分析。我们演示了从细胞收获到进样进行液相色谱-串联质谱(LC-MS/MS)分析的单细胞蛋白质组学样本制备过程中的关键步骤。此外,视频还引导观众了解等压载体实验设计的原理、等压载体与单细胞样本制备的质量控制,以及代表性结果,并讨论了该方法的局限性。 |
| P | 单细胞蛋白质组学 | 单细胞蛋白质组学分析需要具备高灵敏度、定量准确、广泛可及且稳健的方法。为满足这些要求,单细胞蛋白质组学(SCoPE2)技术被开发为第二代方法,可用于从少量样本(少至单个细胞)中定量数百至数千种蛋白质。采用该方法的实验已在10天的质谱仪运行时间内,实现了对1,500个单个哺乳动物细胞(每个细胞500–1,000种蛋白质)中超过3,000种蛋白质的定量。SCoPE2利用冻融循环实现细胞裂解,避免了对单细胞进行纯化的步骤,从而减少了样品损失,同时加快了样品制备速度并简化了自动化流程。此外,该方法使用等压载体,有助于蛋白质鉴定并减少样品损失。本视频协议提供了详细的指导,使研究者仅使用广泛可及的设备和试剂即可开展自动化单细胞蛋白质分析。我们演示了从细胞收获到进样进行液相色谱-串联质谱(LC-MS/MS)分析的蛋白质组学样品制备过程中的关键步骤。此外,观众还将了解等压载体实验设计的基本原理、等压载体与单细胞样品的质量控制方法,以及代表性结果与该方法局限性的讨论。 | - | 单细胞蛋白质组学分析需要具备高灵敏度、定量准确、广泛可及且稳健的方法。为满足这些要求,开发了第二代单细胞蛋白质组学(SCoPE2)方案,用于从微量样本(少至单个细胞)中定量数百至数千种蛋白质。采用该方法的实验已在10天的质谱仪运行时间内,实现了对1,500个单个哺乳动物细胞(每个细胞500–1,000种蛋白质)中超过3,000种蛋白质的定量。SCoPE2利用冻融-加热循环实现细胞裂解,省去了单细胞纯化的步骤,从而减少了样品损失,同时加快了样品制备并简化了自动化流程。此外,该方法使用等压载体,有助于蛋白质鉴定并减少样品损失。本视频方案提供了详细指导,使研究者仅使用广泛可及的设备和试剂即可开展自动化的单细胞蛋白质分析。我们演示了从细胞收获到进样进行液相色谱-串联质谱(LC-MS/MS)分析的单细胞蛋白质组学样品制备过程中的关键步骤。此外,还指导观众了解等压载体实验设计的原理、等压载体与单细胞样品的质量控制,以及代表性结果,并讨论了该方法的局限性。 | 单细胞蛋白质组学 | 单细胞蛋白质组学分析需要具备高灵敏度、定量准确、广泛可及且稳健的方法。为满足这些要求,单细胞蛋白质组学(SCoPE2)方案被开发为第二代技术,可用于从微量样本(少至单个细胞)中定量数百至数千种蛋白质。采用该方法的实验已在10天的质谱仪运行时间内,实现了对1,500个单个哺乳动物细胞(每个细胞500–1,000种蛋白质)中超过3,000种蛋白质的定量。SCoPE2利用冻融-加热循环实现细胞裂解,无需对单细胞进行纯化处理,从而减少了样品损失,同时加快了样品制备速度并简化了自动化流程。此外,该方法使用等压载体,有助于蛋白质鉴定并减少样品损失。本视频方案提供了详细操作指导,使研究者仅需使用广泛可及的设备和试剂即可开展自动化的单细胞蛋白质分析。我们演示了从细胞收获到进样进行液相色谱-串联质谱(LC-MS/MS)分析的蛋白质组学样品制备过程中的关键步骤。此外,观众还将学习等压载体实验设计的基本原理、等压载体与单细胞样品的质量控制方法,以及代表性结果与该方法局限性的讨论。 | 单细胞蛋白质组学分析需要具备高灵敏度、定量准确、广泛可及且稳健的方法。为满足这些要求,单细胞蛋白质组学(SCoPE2)技术被开发为第二代方法,可用于从少量样本(少至单个细胞)中定量数百至数千种蛋白质。采用该方法的实验已在10天的质谱仪运行时间内,实现了对1,500个单个哺乳动物细胞(每个细胞500–1,000种蛋白质)中超过3,000种蛋白质的定量。SCoPE2利用冻融-加热循环实现细胞裂解,无需对单细胞进行纯化处理,从而减少了样品损失,同时加快了样品制备速度并简化了自动化流程。此外,该方法使用等压载体,有助于蛋白质鉴定并减少样品损失。本视频协议提供了详细操作指导,使研究者仅需使用广泛可及的设备和试剂即可开展自动化单细胞蛋白质分析。我们演示了从细胞收获到注入液相色谱-串联质谱(LC-MS/MS)分析的单细胞蛋白质组学样品制备过程中的关键步骤。此外,还指导观众了解等压载体实验设计的原理、等压载体与单细胞样品的质量控制,以及代表性结果,并讨论了该方法的局限性。 | 单细胞蛋白质组学分析需要具备高灵敏度、定量准确、广泛可及且稳健的方法。为满足这些要求,开发了单细胞蛋白质组学(SCoPE2)方案,作为第二代技术,可用于从微量样本(少至单个细胞)中定量数百至数千种蛋白质。采用该方法的实验已在10天的质谱仪运行时间内,实现了对1,500个单个哺乳动物细胞(每个细胞500–1,000种蛋白质)中超过3,000种蛋白质的定量。SCoPE2利用冻融循环实现细胞裂解,无需对单细胞进行纯化处理,从而减少了样品损失,同时加快了样品制备速度并简化了自动化流程。此外,该方法使用等压载体,有助于蛋白质鉴定并减少样品损失。本视频方案提供了详细操作指导,使研究者仅使用广泛可及的设备和试剂即可开展自动化单细胞蛋白质分析。我们演示了从细胞收获到进样进行液相色谱-串联质谱(LC-MS/MS)分析的单细胞蛋白质组学样品制备过程中的关键步骤。此外,还指导观众了解等压载体实验设计的原理、等压载体与单细胞样品的质量控制,以及代表性结果,并讨论了该方法的局限性。 | 单细胞蛋白质组学 | 单细胞蛋白质组学 | 单细胞蛋白质组学 | 单细胞蛋白质组学分析需要具备高灵敏度、定量准确、广泛可及且稳健的方法。为满足这些要求,开发了单细胞蛋白质组学(SCoPE2)方案,作为第二代技术,可用于从微量样本(少至单个细胞)中定量数百至数千种蛋白质。采用该方法的实验已在10天的质谱仪运行时间内,实现了对1,500个单个哺乳动物细胞(每个细胞500–1,000种蛋白质)中超过3,000种蛋白质的定量。SCoPE2利用冻融循环实现细胞裂解,无需对单细胞进行纯化处理,从而减少了样品损失,同时加快了样品制备速度并简化了自动化流程。此外,该方法使用等压载体,有助于提高蛋白质鉴定效率并减少样品损失。本视频协议提供了详细指导,使研究者仅使用广泛可及的设备和试剂即可开展自动化单细胞蛋白质分析。我们演示了从细胞收获到液相色谱-串联质谱(LC-MS/MS)分析进样前,用于蛋白质组学分析的单细胞制备过程中的关键步骤。此外,还指导观众了解等压载体实验设计的原理、等压载体与单细胞样品制备的质量控制,以及代表性结果与该方法局限性的讨论。 | 单细胞蛋白质组学 | 单细胞蛋白质组学 | 单细胞蛋白质组学分析需要具备高灵敏度、定量准确、广泛可及且稳健的方法。为满足这些要求,开发了第二代单细胞蛋白质组学(SCoPE2)方案,用于从微量样本(少至单个细胞)中定量数百至数千种蛋白质。采用该方法的实验已在10天的质谱仪运行时间内,实现了对1,500个单个哺乳动物细胞(每个细胞500–1,000个蛋白质)中超过3,000种蛋白质的定量。SCoPE2利用冻融循环实现细胞裂解,无需对单个细胞进行纯化处理,从而减少了样品损失,同时加快了样品制备速度并简化了自动化流程。此外,该方法使用等压载体,有助于提高蛋白质鉴定效率并减少样品损失。本视频方案提供了详细的指导,使研究者仅使用广泛可及的设备和试剂即可开展自动化单细胞蛋白质分析。我们演示了从细胞收获到进样进行液相色谱-串联质谱(LC-MS/MS)分析的单细胞蛋白质组学样品制备过程中的关键步骤。此外,还指导观众了解等压载体实验设计的原理、等压载体与单细胞样品的质量控制,以及代表性结果与该方法局限性的讨论。 | 单细胞蛋白质组学 | 单细胞蛋白质组学分析需要具备高灵敏度、定量准确、广泛可及且稳健的方法。为满足这些要求,单细胞蛋白质组学(SCoPE2)方案被开发为第二代技术,可用于从微量样本(少至单个细胞)中定量数百至数千种蛋白质。采用该方法的实验已在10天的质谱仪运行时间内,实现了对1,500个单个哺乳动物细胞(每个细胞500–1,000种蛋白质)中超过3,000种蛋白质的定量。SCoPE2利用冻融-加热循环实现细胞裂解,省去了单细胞纯化步骤,从而减少了样品损失,同时加快了样品制备速度并简化了自动化流程。此外,该方法使用等压载体,有助于蛋白质鉴定并减少样品损失。本视频方案提供了详细操作指导,使研究者仅需使用广泛可及的设备和试剂即可开展自动化的单细胞蛋白质分析。我们演示了从细胞收获到进样进行液相色谱-串联质谱(LC-MS/MS)分析的蛋白质组学样品制备过程中的关键步骤。此外,观众还将学习到有关等压载体实验设计的原理、等压载体与单细胞样品的质量控制方法,以及代表性结果与该方法局限性的讨论。 | 单细胞蛋白质组学 | + | 单细胞蛋白质组学分析需要具备高灵敏度、定量准确、广泛可及且稳健的方法。为满足这些要求,单细胞蛋白质组学(SCoPE2)技术被开发为第二代方法,可用于从少量样本(少至单个细胞)中定量数百至数千种蛋白质。采用该方法的实验已在10天的质谱仪运行时间内,实现了对1,500个单个哺乳动物细胞(每个细胞500–1,000种蛋白质)中超过3,000种蛋白质的定量。SCoPE2利用冻融循环实现细胞裂解,避免了对单细胞进行纯化的步骤,从而减少了样品损失,同时加快了样品制备速度并简化了自动化流程。此外,该方法使用等压载体,有助于蛋白质鉴定并减少样品损失。本视频协议提供了详细的指导,使研究者仅使用广泛可及的设备和试剂即可开展自动化单细胞蛋白质分析。我们演示了从细胞收获到进样进行液相色谱-串联质谱(LC-MS/MS)分析的蛋白质组学样品制备过程中的关键步骤。此外,观众还将了解等压载体实验设计的基本原理、等压载体与单细胞样品的质量控制方法,以及代表性结果与该方法局限性的讨论。 | 单细胞蛋白质组学分析需要具备高灵敏度、定量准确、广泛可及且稳健的方法。为满足这些要求,单细胞蛋白质组学(SCoPE2)方案被开发为第二代技术,可用于从微量样本(少至单个细胞)中定量数百至数千种蛋白质。采用该方法的实验已在10天的质谱仪运行时间内,实现了对1,500个单个哺乳动物细胞(每个细胞500–1,000种蛋白质)中超过3,000种蛋白质的定量。SCoPE2利用冻融-加热循环实现细胞裂解,无需对单细胞进行纯化处理,从而减少了样品损失,同时加快了样品制备速度并简化了自动化流程。此外,该方法使用等压标签载体,有助于蛋白质鉴定并进一步降低样品损失。本视频方案提供了详细操作指导,使研究者仅需使用广泛可得的设备和试剂即可开展自动化的单细胞蛋白质分析。我们演示了从细胞收获到进样进行液相色谱-串联质谱(LC-MS/MS)分析的蛋白质组学样品制备过程中的关键步骤。此外,观众还将学习到有关等压标签载体的实验设计原理、针对等压标签载体和单细胞样品的质量控制方法,以及代表性结果与该方法局限性的讨论。 | 单细胞蛋白质组学分析需要具备高灵敏度、定量准确、广泛可及且稳健的方法。为满足这些要求,单细胞蛋白质组学(SCoPE2)技术被开发为第二代方法,可用于从少量样本(少至单个细胞)中定量数百至数千种蛋白质。采用该方法的实验已在10天的质谱仪运行时间内,实现了对1,500个单个哺乳动物细胞(每个细胞500–1,000种蛋白质)中超过3,000种蛋白质的定量。SCoPE2利用冻融循环实现细胞裂解,避免了对单细胞进行纯化的步骤,从而减少了样品损失,同时加快了样品制备速度并简化了自动化流程。此外,该方法使用等压载体,有助于蛋白质鉴定并减少样品损失。本视频协议提供了详细的指导,使研究者仅使用广泛可及的设备和试剂即可开展自动化单细胞蛋白质分析。我们演示了从细胞收获到进样进行液相色谱-串联质谱(LC-MS/MS)分析的蛋白质组学样品制备过程中的关键步骤。此外,观众还将了解等压载体实验设计的基本原理、等压载体与单细胞样品的质量控制方法,以及代表性结果与该方法局限性的讨论。 | - | 单细胞蛋白质组学分析需要具备高灵敏度、定量准确、广泛可及且稳健的方法。为满足这些要求,开发了第二代单细胞蛋白质组学(SCoPE2)方案,用于从微量样本(少至单个细胞)中定量数百至数千种蛋白质。采用该方法的实验已在10天的质谱仪运行时间内,实现了对1,500个单个哺乳动物细胞(每个细胞500–1,000种蛋白质)中超过3,000种蛋白质的定量。SCoPE2利用冻融循环实现细胞裂解,免除了对单细胞样本进行纯化的步骤,从而减少了样本损失,同时加快了样本制备速度并简化了自动化流程。此外,该方法使用等压载体,有助于蛋白质鉴定并减少样本损失。本视频方案提供了详细的指导,使研究者能够仅使用广泛可及的设备和试剂开展自动化的单细胞蛋白质分析。我们演示了从细胞收获到进样进行液相色谱-串联质谱(LC-MS/MS)分析的蛋白质组学样本制备过程中的关键步骤。此外,还指导观众了解等压载体实验设计的原理、等压载体与单细胞样本制备的质量控制,以及代表性结果,并讨论了该方法的局限性。 |
表3:使用TMTpro-16plex进行标记的示例板布局。 使用384孔板格式(或其他任何板格式)时,必须将细胞随机分配至各孔中。TMTpro-18plex将采用不同的板布局。
结果
本方案的阳性结果需要验证方案中多个关键步骤已成功完成;这些步骤包括载体的制备、单细胞分离、裂解、消化、条形码标记以及质谱参数优化。DO-MS图谱可直观评估方案中每个关键步骤的完成情况。成功制备的载体通常对应每组25至200个细胞的数量,且消化充分、标记良好。通过DO-MS图谱可量化样品信号强度(用于估算样品量)、消化效率(理想情况下杂酶切率<25%)以及标记效率(必须>99%)。尤为关键的是,若载体样品未完全标记,可能导致其与用于单细胞的条形码发生交叉反应,从而在单细胞肽段定量中引入虚假信号。
阴性对照孔包含所有实验试剂,但不含细胞。这不仅可以评估背景噪声,还能通过提供空孔的代表性信号来确定细胞分离效率。DO-MS 报告提供了对照孔与单细胞孔测量信号的图表,用于判断细胞分离效果及背景噪声水平。此外,还可通过 SCoPE2 分析流程(GitHub 可获取:github.com/SlavovLab/SCoPE2)或 SCP Bioconductor 软件包29来评估定量结果的质量。
单个细胞的消化和标记效率无法像载体那样直接测定,但DO-MS再次提供了可用于评估消化和标记效率的图谱。通过在单细胞制备过程中同时设置含有100-200个细胞的对照(即接受完全相同的试剂添加),可对该对照样本的消化和标记效率进行评估,并假设与之同步制备的单细胞具有相同的效率。消化不完全将表现为未完全切割肽段与其完全切割对应肽段的强度比值较高(图1)。
在分析数据集时,另一个需要考虑的因素是每个 TMT 通道中缺失数据的比例以及报告离子的中位强度(图 2)。当单细胞成功制备后,每个单细胞及阳性对照样本中的缺失数据量远低于阴性对照样本。同样,单细胞和阳性对照样本中前体离子的中位强度也显著高于阴性对照。质谱参数的优化已在其他文献中广泛讨论21,可使用 DO-MS 或 SCP Companion25,27 等工具确定最佳参数。

图1:载体制备的质量控制。 数据依赖性质谱(DO-MS)图显示(A)使用TMT成功制备的载体在标记位点的标记效率:包括赖氨酸侧链上的伯胺基团和肽段N末端;以及(B)胰蛋白酶切割位点氨基酸残基处的消化效率。缩写:TMT = 串联质谱标签。请点击此处查看该图的放大版本。
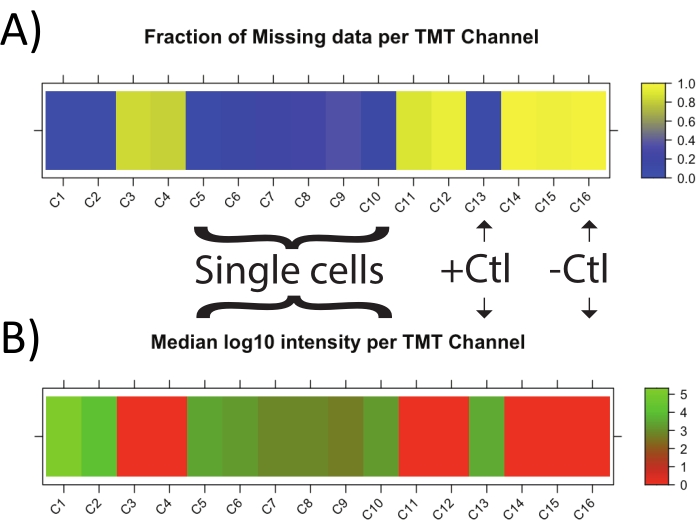
图 2:单细胞制备的质量控制。 DO-MS 图显示了单细胞(C5-10)、对照组(C13,16)、载体(C1)和参考样本(C2)的(A)缺失数据比例,以及(B)单细胞和对照组的信号强度。标签 127C、128N、131C、132N、133N 和 133C 分别对应 C3、C4、C11、C12 和 C15,在本实验组中未使用。阳性对照由大量处理成肽段的细胞材料组成,标记前稀释至 2–5 个细胞/μL 水平;阴性对照则为经历与单细胞相同全部前处理步骤但未加入单个细胞的孔。缩写:TMT = 串联质谱标签。 请点击此处查看此图的放大版本。
讨论
通过 SCoPE2 成功制备和分析单细胞的关键之一是载体通道和参考通道的制备。建议的载体细胞数量为 100 至 200 个细胞;然而,特定单细胞实验所需的细胞数量可根据其他文献中讨论的原则确定21。对于建议的载体规模,每块 384 孔板至少需要约 11,275 个细胞,以确保每组包含一个 200 个细胞的载体和一个 5 个细胞的参考样本。如果目标细胞群体并非受限因素,则分离更多细胞可能具有优势,以便在操作失误时留有额外材料(本实验方案即采用此策略,分离了 22,000 个细胞而非 11,275 个细胞)。为最大限度减少批次间变异对肽段鉴定或定量结果造成的影响,应将所需板数对应的载体和参考样本材料在同一批次中统一制备。
在将单细胞分离至384孔板的各孔之前,需仔细考虑孔板布局的设计。建议在每个384孔板内均设置阳性和阴性对照。阴性对照是指不加入细胞但接受与其他单细胞孔相同试剂添加和操作步骤的孔。阳性对照则是指加入稀释至2-5个细胞/µL的细胞裂解液而非单个细胞的孔。当单细胞分离方法尚未经过充分验证时,设置对照尤为重要。理想情况下,每个384孔板中的单细胞和对照应呈随机分布(例如,不应仅将阴性或阳性对照集中于某一行)。所有目标细胞群体应在各孔板中均匀分布,而不是在一个孔板中分离一种细胞类型,在另一个孔板中分离另一种细胞类型。这有助于避免将批次效应与目标细胞类型相关联。此外,若分析需要使用多个384孔板,应尽可能在同一次实验中完成细胞分离,而不是将分离步骤分散在数天内进行。
单个细胞及载体/参照样本均通过冻融循环在水中进行裂解23。预计在此步骤中大多数蛋白酶已被变性。变性完成后立即加入高浓度的胰蛋白酶,其浓度远高于细胞中最丰富的蛋白酶浓度数个数量级。根据质量作用定律,蛋白酶活性产生的大多数产物将来源于胰蛋白酶。
本方案在胰蛋白酶消化前不对半胱氨酸残基进行还原/烷基化处理。来自人类蛋白质组的胰蛋白酶肽段中,含半胱氨酸的肽段约占10%。采用不进行还原/烷基化的方案时,我们观察到含半胱氨酸的肽段数量较少。这些步骤所用的试剂与消化后立即进行的TMT标记(NHS-酯化学反应)不兼容。
在此TMT标记策略中,载体和参照样本分别用126和127N标记,而单细胞样本和对照孔则用128C至135N进行标记。由于载体和参照通道的肽段含量明显高于单细胞样本,会导致同位素交叉污染,因此参考样本之后的两个标签127C和128N不使用。每组TMTpro-16plex最多可使用12个TMT通道用于标记单细胞或对照孔,而TMTpro-18plex每组则最多可使用14个TMT通道。
使用本方案进行单细胞蛋白质组学测量的关键步骤包括载体的制备、单细胞分离、裂解、消化、条形码标记以及合适的质谱参数设置。这些步骤已在本文档中概述,并在其他文献中进行了详尽描述17,21,25。每个步骤在 DO-MS 中均有对应的图表或一组图表,可用于便捷的质量控制。例如,在载体成功制备的情况下,可通过展示鉴定出的肽段数量、标记效率以及错切率百分比的图表来验证其制备质量。本出版物中包含了典型的 DO-MS 报告,原始数据可在 http://scope2.slavovlab.net/ 查看16。这些 DO-MS 报告可用于评估该方法在作者尚未探索的方向上的优化情况,例如更长的液相色谱梯度、不同的消化酶或替代性的化学条形码。
目前,通过数据依赖性采集算法对肽段进行串联分析,限制了在合理长度的液相色谱运行中可分析的肽段数量。部分原因在于,为成功获取足够离子以实现可靠的单细胞定量,需要较长的填充时间21。使用载体的一个固有限制是无法直接评估单个细胞的消化和标记效率。目前,解决该限制的一种方法是,在与单细胞并行处理的较大样本上进行质量控制。
我们提出了若干改进单细胞蛋白质组学的机遇,例如构建配备多个分析器的质谱仪。当前方法利用商业化的试剂和设备,能够以每天约100个细胞的速度,实现对单个哺乳动物细胞中数千种蛋白质的定量。SCoPE2 是 SCoPE-MS 方法的第二代技术,在单位时间内可分析的细胞数量、单位时间内可鉴定的蛋白质数量、样品制备所需时间、试剂与设备的可及性,以及每个单细胞的制备与分析总成本等方面,均显著优于前代方法。与尿素裂解法相比,冻融-加热裂解结合蛋白酶消化的方法可有效获取膜结合蛋白23。该方法能够鉴定出蛋白质组中丰度位于前三分之一的大量蛋白质16。如果修饰型蛋白质形式位于蛋白质组丰度的前三分之一,且其对应的修饰肽段适用于质谱分析(电离效果良好,与未修饰肽段具有可区分的质量差异),则该修饰更有可能被本方案检测到。该方法可有效应用于细胞间存在显著异质性的生物体系,例如细胞分化、衰老或免疫应答(如吞噬作用)等过程。
致谢
我们感谢美国国家科学基金会(NSF)I-Corps 计划(东北大学站点)2021年秋季项目资助了本出版物。
材料
| 姓名 | 公司 | 目录编号 | 评论 |
|---|---|---|---|
| 384孔板,标准PCR板 | Thermo Fisher Scientific | AB1384 | 若需替代,应使用聚丙烯材质的板。如进行替代,应在SCoPE2制备前评估其他板可能带来的聚合物污染水平。 |
| 乙腈(用于缓冲液配制),Optima LC-MS/MS级 | Fisher Scientific | A955-1 | 该乙腈用于所有缓冲液的配制,特别是用于在合并SCoPE2样本时,在载体和参照样本通过后冲洗孔板的50%乙腈。 警告:乙腈为易燃液体,可刺激皮肤、眼睛、呼吸道和中枢神经系统。务必佩戴个人防护装备,在通风橱中操作。 |
| 乙腈(用于TMT标签配制),无水,99.8% | Sigma Aldrich | 271004-100ML | 该乙腈用于按照制造商推荐浓度重悬TMT标签。 警告:乙腈为易燃液体,可刺激皮肤、眼睛、呼吸道和中枢神经系统。务必佩戴个人防护装备,在通风橱中操作。 |
| PCR板用粘性封膜 | Thermo Fisher Scientific | AB0626 | |
| 自动进样瓶螺纹盖 | Thermo Fisher Scientific | C5000-51B | |
| 自动进样瓶旋涡混合器(例如myFuge 5) | MTC Bio | C2595 | 该型号无转速控制功能,仅用于将自动进样瓶中的液体收集至底部。 |
| 苯并核酸酶(Benzonase核酸酶) | Sigma Aldrich | E1014-25KU | |
| 透明玻璃螺纹进样瓶,9 mm | Thermo Fisher Scientific | 60180-509 | |
| 甲酸,Pierce,LC-MS/MS级 | Thermo Fisher Scientific | 85178 | 警告:甲酸为易燃液体,可导致严重眼损伤或皮肤灼伤。务必佩戴个人防护装备,在通风良好的区域操作。 |
| 玻璃自动进样瓶内插管,9 mm | Thermo Fisher Scientific | C4010-630 | |
| 羟胺(HA),50% wt/vol | Sigma Aldrich | 467804-50ML | 警告:羟胺可引起皮肤刺激。务必佩戴个人防护装备。 |
| Mantis微流控芯片,低体积3PFE芯片 | Formulatrix | MCLVPR2 | 该芯片专为与Mantis微流控液体处理系统配合使用,用于分配有机溶液,可用于分配TMT标签。 |
| Mantis微流控芯片,低体积硅胶芯片 | Formulatrix | MCLVS12 | 该芯片专为与Mantis微流控液体处理系统配合使用,用于分配水相溶液,不可用于分配TMT标签。 |
| Mantis微流控液体处理系统 | Formulatrix | 液体处理系统可替换,但需确认系统是否兼容100%乙腈(如TMT标签所用),并确保系统不会向样本引入聚合物或其他类型的污染。 | |
| Mantis PCR板适配器,带宽锥形针,用于自动化板处理 | Formulatrix | 232400 | |
| MassPREP肽混合物 | Waters | 186002337 | 由九种非胰蛋白酶肽组成的混合物 |
| PCR管旋涡混合器(例如,适用于0.2 mL管的16位微型离心机) | USA Scientific | 2621-0016 | 该型号无转速控制功能,仅用于将管中液体收集至底部。 |
| PCR管:TempAssure 0.2 mL PCR 8联管 | USA Scientific | 1402-3900 | 若需替代,应在SCoPE2制备前评估其他管材可能带来的聚合物污染水平。 |
| 磷酸盐缓冲液(PBS),10倍浓缩液,pH 7.4,无RNase | Thermo Fisher Scientific | AM9625 | |
| 板式旋涡混合器(例如PlateFuge微型离心机) | Benchmark Scientific | Model C2000 | 该型号无转速控制功能,仅用于将孔板中的液体收集至孔底。 |
| 热循环仪(例如C1000 Touch配384孔模块) | Biorad | 1851138 | |
| TMTpro 16重标签试剂盒,1 × 5 mg | Thermo Fisher Scientific | A44520 | |
| 三乙基碳酸氢铵(TEAB),1 M,pH 8.5 | Sigma Aldrich | T7408100ML | |
| 胰蛋白酶Gold,质谱级 | Promega | V5280 | 该胰蛋白酶纯度极高,其他胰蛋白酶试剂的纯度可能存在差异。纯度水平对获得良好的SCoPE2结果至关重要。 警告:胰蛋白酶可引起皮肤、呼吸道和眼睛刺激。务必佩戴个人防护装备,在通风橱中操作。 |
| 旋涡振荡器(模拟式旋涡混合器) | VWR | Model 58816-121 | |
| 水浴超声仪(例如,2.8 L带数字计时器的超声清洗器) | VWR | 97043964 | |
| 水,Optima LC-MS/MS级 | Fisher Scientific | W6-1 | 所有需要稀释或配制的溶液均建议使用质谱级水。所有稀释液和/或母液均应新鲜配制。低等级水可能导致的污染会负面影响肽段检测和单细胞数据质量。 |
参考文献
- Symmons, O., Raj, A. What's luck got to do with it: single cells, multiple fates, and biological nondeterminism. Molecular Cell. 62 (5), 788-802 (2016).
- Paul, I., White, C., Turcinovic, I., Emili, A. Imaging the future: the emerging era of single-cell spatial proteomics. The FEBS Journal. 288 (24), 6990-7001 (2020).
- Levy, E., Slavov, N. Single cell protein analysis for systems biology. Essays in Biochemistry. 62 (4), 595-605 (2018).
- Nagasawa, S., Kashima, Y., Suzuki, A., Suzuki, Y. Single-cell and spatial analyses of cancer cells: toward elucidating the molecular mechanisms of clonal evolution and drug resistance acquisition. Inflammation and Regeneration. 41 (1), 22(2021).
- Shaffer, S. M., et al. Rare cell variability and drug-induced reprogramming as a mode of cancer drug resistance. Nature. 555 (7695), 274(2018).
- Pan, D., Jia, D. Application of single-cell multi-omics in dissecting cancer cell plasticity and tumor heterogeneity. Frontiers in Molecular Biosciences. 8, 757024(2021).
- Segerstolpe, Å, et al. Single-cell transcriptome profiling of human pancreatic islets in health and type 2 diabetes. Cell Metabolism. 24 (4), 593-607 (2016).
- Tritschler, S., Theis, F. J., Lickert, H., Böttcher, A. Systematic single-cell analysis provides new insights into heterogeneity and plasticity of the pancreas. Molecular Metabolism. 6 (9), 974-990 (2017).
- Hanna, S. J., Tatovic, D., Thayer, T. C., Dayan, C. M. Insights from single cell rna sequencing into the immunology of type 1 diabetes- cell phenotypes and antigen specificity. Frontiers in Immunology. 12, 751701(2021).
- Baron, M., et al. A single-cell transcriptomic map of the human and mouse pancreas reveals inter- and intra-cell population structure. Cell Systems. 3 (4), 346-360 (2016).
- Franks, A., Airoldi, E., Slavov, N. Post-transcriptional regulation across human tissues. PLoS Computational Biology. 13 (5), 1005535(2017).
- Slavov, N. Unpicking the proteome in single cells. Science. 367 (6477), 512-513 (2020).
- Specht, H., Slavov, N. Transformative opportunities for single-cell proteomics. Journal of Proteome Research. 17 (8), 2565-2571 (2018).
- Slavov, N. Learning from natural variation across the proteomes of single cells. PLoS Biology. , (2021).
- Slavov, N. Driving single cell proteomics forward with innovation. Journal of Proteome Research. 20 (11), 4915-4918 (2021).
- Specht, H., et al. Single-cell proteomic and transcriptomic analysis of macrophage heterogeneity using SCoPE2. Genome Biology. 22 (1), 50(2021).
- Petelski, A. A., et al. Multiplexed single-cell proteomics using SCoPE2. Nature Protocols. 16 (12), 5398-5425 (2021).
- Slavov, N. Scaling up single-cell proteomics. Molecular and Cellular Proteomics: MCP. 21 (1), 100179(2022).
- Cong, Y., et al. Ultrasensitive single-cell proteomics workflow identifies> 1000 protein groups per mammalian cell. Chemical Science. 12 (3), 1001-1006 (2021).
- Lombard-Banek, C., et al. In vivo subcellular mass spectrometry enables proteo-metabolomic single-cell systems biology in a chordate embryo developing to a normally behaving tadpole (X. laevis). Angewandte Chemie. 60 (23), 12852-12858 (2021).
- Specht, H., Slavov, N. Optimizing accuracy and depth of protein quantification in experiments using isobaric carriers. Journal of Proteome Research. 20 (1), 880-887 (2020).
- Budnik, B., Levy, E., Harmange, G., Slavov, N. SCoPE-MS: mass spectrometry of single mammalian cells quantifies proteome heterogeneity during cell differentiation. Genome Biology. 19 (1), 161(2018).
- Specht, H., Harmange, G., Perlman, D. H., Emmott, E. Automated sample preparation for high-throughput single-cell proteomics. BioRxiv. , at https://www.biorxiv.org/content/10.1101/399774v1.abstract (2018).
- Singh, A. Towards resolving proteomes in single cells. Nature Methods. 18 (8), 856(2021).
- Huffman, R. G., Chen, A., Specht, H., Slavov, N. DO-MS: Data-driven optimization of mass spectrometry methods. Journal of Proteome Research. 18 (6), 2493-2500 (2019).
- Chen, A. T., Franks, A., Slavov, N. DART-ID increases single-cell proteome coverage. PLoS Computational Biology. 15 (7), 1007082(2019).
- Cheung, T. K., et al. Defining the carrier proteome limit for single-cell proteomics. Nature Methods. 18 (1), 76-83 (2021).
- Leduc, A., Huffman, R. G., Slavov, N. Droplet sample preparation for single-cell proteomics applied to the cell cycle. bioRxiv. , https://www.biorxiv.org/content/10.1101/2021.04.24.441211v1.abstract (2021).
- Vanderaa, C., Gatto, L. Utilizing Scp for the analysis and replication of single-cell proteomics data. bioRxiv. , (2021).
重印与许可
