Salvianolic acid B, a compound derived from Salvia miltiorrhiza, reduces cervical cancer cell viability, wound closure, proliferative activity, and epithelial-mesenchymal transition-associated molecular changes in HeLa and SiHa cells. Its actions are linked to the modulation of platelet glycoprotein Ib alpha and the downstream LYN kinase and TWIST1 transcription factor pathway.
Forschungsartikel
Salvianolic Acid B Suppresses Epithelial-Mesenchymal Transition-Associated Phenotypes in Cervical Cancer Cells via GPIb Alpha/LYN/TWIST1 Signaling
In diesem Artikel
Zusammenfassung
Zusammenfassung
Cervical cancer remains a major gynecological malignancy, and the epithelial-mesenchymal transition is associated with tumor progression. Salvianolic acid B, a water-soluble polyphenolic compound derived from Salvia miltiorrhiza, has antitumor potential in several cancers, but its role in cervical cancer-related epithelial-mesenchymal transition signaling remains incompletely understood. HeLa and SiHa cervical cancer cells were treated with salvianolic acid B, alone or combined with modulation of platelet glycoprotein Ib alpha or Src-family kinase signaling. Cell viability, wound closure, and proliferative activity were assessed by Cell Counting Kit-8, wound healing, and 5-ethynyl-2'-deoxyuridine incorporation assays. Epithelial-mesenchymal transition markers and LYN/TWIST1 signaling components were analyzed by immunofluorescence and Western blotting. Platelet glycoprotein Ib alpha was modulated by plasmid-mediated overexpression or small interfering RNA-mediated knockdown. Salvianolic acid B reduced cervical cancer cell viability, wound closure, and 5-ethynyl-2'-deoxyuridine-positive staining, decreased N-cadherin and Vimentin, and increased E-cadherin expression. It also downregulated platelet glycoprotein Ib alpha, reduced LYN phosphorylation, and TWIST1 expression. Platelet glycoprotein Ib alpha overexpression partially attenuated these changes; knockdown enhanced them. PP2, a non-selective Src-family kinase inhibitor, also reduced TWIST1 expression and 5-ethynyl-2'-deoxyuridine-positive staining. Salvianolic acid B suppresses cervical cancer cell viability, wound closure, proliferative activity, and molecular changes associated with the epithelial-mesenchymal transition, in part through modulation of a proposed platelet glycoprotein Ib alpha/LYN/TWIST1 signaling axis. Because wound closure was measured under conditions in which viability and proliferation were also reduced, wound healing data should not be interpreted as independent evidence of impaired migration. Further preclinical validation is warranted.
Einleitung
Cervical cancer is the fourth most common cancer among women worldwide, with an estimated 604,000 new cases and 342,000 deaths in 2020, according to the World Health Organization1. Although human papillomavirus (HPV) vaccination and cervical screening programs have substantially reduced the incidence of cervical cancer in many high-income countries, the disease burden remains disproportionately high in low- and middle-income regions2. The pathogenesis of cervical cancer is complex, with persistent infection by high-risk HPV, particularly HPV-16 and HPV-18, serving as the primary driver of oncogenic transformation3. However, HPV infection alone is not sufficient to induce malignancy. The progression from precancerous lesions to invasive cervical carcinoma requires additional molecular events, including immune evasion, epigenetic dysregulation, angiogenesis, and the acquisition of invasive and metastatic phenotypes4. Clinically, tumor size, lymphovascular space invasion, and pelvic lymph node involvement remain the dominant determinants of treatment planning and prognosis, which underscores the importance of the cellular programs that govern local invasion and dissemination5. Thus, a comprehensive understanding of the molecular mechanisms underlying cervical cancer progression is critical for developing more effective therapeutic interventions.
One of the central biological processes contributing to cancer metastasis and therapeutic resistance is the epithelial-mesenchymal transition (EMT)6. EMT is a cellular plasticity program that allows epithelial cells to acquire mesenchymal features, leading to increased motility, invasiveness, and resistance to apoptosis7. During EMT, loss of epithelial markers such as E-cadherin is accompanied by the upregulation of mesenchymal markers, including N-cadherin and Vimentin8. EMT also endows cancer cells with stem-like properties and enhances their ability to survive in the circulation and colonize distant organs9. In cervical cancer, EMT is associated with poor clinical outcomes, including higher recurrence rates and resistance to radiochemotherapy10. Several intracellular signaling pathways are involved in EMT regulation, including TGF-β/SMAD, PI3K/AKT, Wnt/β-catenin, and the Src-family kinases11. Among the transcriptional regulators driving EMT, TWIST1 has emerged as a key player. TWIST1 is an important transcriptional regulator of epithelial-mesenchymal plasticity and can regulate E-cadherin and mesenchymal gene-expression programs12. Given its pivotal role, targeting TWIST1 or its upstream activators may be a promising strategy to reverse EMT and mitigate tumor progression.
While EMT has been extensively studied in the context of tumor-intrinsic signaling pathways, the contribution of platelet-derived or platelet-associated molecules to this process is increasingly being recognized13. Platelets are no longer viewed merely as hemostatic elements; they play active roles in tumor growth, angiogenesis, and metastasis14. More broadly, the tumor microenvironment, in which tumor cells interact with platelets, stromal cells, immune cells, and the local microbiota, shapes invasive behaviour and treatment response and has become an important focus of translational oncology15. The platelet glycoprotein Ib alpha (GPIbα) is a key component of the GPIb-IX-V receptor complex and is essential for platelet adhesion under high shear stress conditions16. Beyond its classical function, GPIbα has been shown to facilitate tumor-platelet interactions, which protect circulating tumor cells from immune surveillance and shear stress during hematogenous dissemination17. Emerging evidence suggests that GPIbα may also be expressed in certain tumor cells and may influence intracellular signaling events18. However, the functional relevance of tumor-expressed GPIbα in regulating oncogenic signaling pathways, particularly in solid tumors such as cervical cancer, has not been systematically explored. Whether tumor cell-associated GPIbα contributes to EMT-related signaling or to its upstream regulatory pathways remains an open question.
LYN kinase, a member of the Src family tyrosine kinases, plays a crucial role in regulating cell proliferation, survival, motility, and cytoskeletal dynamics19. Aberrant LYN activation has been reported in various cancers, including breast, prostate, colon, and hematologic malignancies20. In breast cancer, elevated LYN expression has been linked to increased tumor aggressiveness and poor prognosis21. Mechanistically, LYN has been implicated in the regulation of downstream EMT-inducing transcription factors such as TWIST1 and SNAIL, thereby contributing to a mesenchymal phenotype22. The precise upstream regulation of LYN in epithelial tumors, however, is not fully understood. Whether GPIbα serves as a regulator of LYN activation and TWIST1 expression in cervical cancer cells has yet to be investigated.
Salvianolic acid B (Sal B) is a water-soluble polyphenolic compound extracted from the traditional Chinese medicinal herb Salvia miltiorrhiza (Danshen), which has long been used to treat cardiovascular and cerebrovascular diseases23. In recent years, Sal B has attracted considerable attention in oncology research due to its anti-inflammatory, antioxidant, anti-proliferative, and anti-metastatic properties24. Sal B has been shown to inhibit cancer cell proliferation, invasion, and EMT in several types of malignancies, including breast, lung, liver, and gastric cancers25,26,27,28. These effects are often mediated through modulation of signaling pathways such as TGF-β, NF-κB, STAT3, and PI3K/AKT29,30,31,32. However, whether Sal B can interfere with platelet-related or adhesion molecule-associated signaling pathways, such as GPIbα-related cascades, remains underexplored. Furthermore, its potential to regulate the LYN/TWIST1 signaling axis in cervical cancer cells remains unexplored.
Given this context, it was hypothesized that Sal B suppresses EMT-associated cellular phenotypes in cervical cancer cells by modulating a proposed GPIbα/LYN/TWIST1 signaling axis. To test this hypothesis, a series of in vitro experiments was conducted using the HeLa and SiHa cervical cancer cell lines. The effects of Sal B on cell viability, proliferative activity, and wound closure were evaluated, and the expression of key EMT markers was analyzed. GPIbα was knocked down and overexpressed to determine its involvement in the effects of Sal B. Finally, the influence of Sal B on LYN phosphorylation and TWIST1 expression was assessed, and whether GPIbα acts upstream of these events was examined.
This study aims to describe a candidate molecular mechanism by which Sal B suppresses EMT-associated molecular changes and migration-associated phenotypes in cervical cancer cells, and to explore GPIbα as a potential regulatory molecule. The findings extend the current understanding of EMT regulation in cervical cancer and provide experimental evidence supporting further investigation of Sal B as a candidate antitumor compound for cervical cancer.
Protokoll
This study used only commercially available, established cell lines and did not involve human participants, human tissue, or animals; therefore, institutional ethics approval was not required. All materials used are listed in the Table of Materials.
Cell culture and maintenance
HeLa (RRID: CVCL_0030) and SiHa (RRID: CVCL_0032) cervical cancer cells were obtained from an authenticated cell bank. The cells were cultured in Dulbecco's Modified Eagle Medium (DMEM) supplemented with 10% fetal bovine serum (FBS), 100 U/mL penicillin, and 100 μg/mL streptomycin at 37 °C in a humidified 5% CO2 incubator. The cells were cultured at 80-90% confluence using 0.25% trypsin-EDTA. Use cells between passages 5 and 20. The cell lines were authenticated by short tandem repeat profiling and confirmed to be free of mycoplasma contamination before use.
Preparation of salvianolic acid B and PP2 stock solutions
Salvianolic acid B (Sal B) was dissolved in dimethyl sulfoxide (DMSO; CAUTION: enhances skin absorption of other chemicals) to prepare a 10 mM stock solution. The solution was aliquoted and stored at -80 °C, protected from light. The Src-family kinase inhibitor PP2 was dissolved in DMSO to prepare a 10 mM stock solution. The solution was aliquoted and stored at -20 °C. Immediately before each experiment, the stock solutions were diluted in complete culture medium to the required working concentrations. The final DMSO concentration was maintained at 0.1% (v/v) in all groups, including the vehicle control.
Cell viability assay
HeLa or SiHa cells were seeded in a 96-well plate at 5 × 10³ cells per well in 100 μL of complete medium. The cells were allowed to adhere for 24 h. The medium was replaced with 100 μL of complete medium containing Sal B at 0 (vehicle), 5, 10, 20, 40, 80, or 120 μM. Six technical replicate wells per condition were included. At 24, 48, and 72 h after treatment, 10 μL of Cell Counting Kit-8 (CCK-8) reagent was added to each well, and the cells were incubated at 37 °C for 2 h. The absorbance was measured at 450 nm on a microplate reader. The six technical replicates per condition were averaged. Viability was expressed as a percentage of the vehicle-treated control on the same plate. Three independent experiments were performed.
Wound healing assay
The cells were seeded in a 6-well plate and grown to 90-100% confluence. Three predefined positions on the underside of each well were marked with a marker pen so that the same fields could be re-imaged. A sterile 200 μL pipette tip was held perpendicular to the plate, and a straight scratch was made across the monolayer. The monolayer was washed twice with phosphate-buffered saline (PBS) to remove detached cells. Serum-free medium containing Sal B, PP2, or both, or vehicle only, was added, and the plate was returned to the incubator. Serum-free medium was used to limit proliferation during the assay. Images of the three marked positions of each well were captured at 0, 12, and 24 h on an inverted microscope with a 10×/0.25 objective. The images were opened in ImageJ, the denuded area was outlined manually, and the wound closure percentage was calculated as (A0 - At)/A0 × 100%, where A0 was the denuded area at 0 h, and At was the denuded area at time t. The three fields per well were averaged to obtain a single value per independent experiment. Three independent experiments (n = 3) were performed.
5-ethynyl-2ʹ-deoxyuridine (EdU) incorporation assay
The cells were seeded on glass coverslips placed in a 24-well plate and treated as required for 24 h. A total of 10 μM EdU was added to the complete medium, and the cells were incubated at 37 °C for 2 h. The medium was aspirated, and the cells were fixed in 4% paraformaldehyde.
Paraformaldehyde is a suspected carcinogen and respiratory irritant; it was handled in a fume hood while wearing gloves and eye protection) for 15 min at room temperature. The cells were permeabilized with 0.3% Triton X-100 (CAUTION: irritant to eyes and skin) for 10 min at room temperature. The click reaction was performed with an Alexa Fluor 488 click reagent according to the kit instructions for 30 min at room temperature in the dark. The nuclei were counterstained with 4ʹ,6-diamidino-2-phenylindole (DAPI) for 10 min. The coverslips were mounted, and five randomly selected fields per coverslip were imaged on a confocal microscope with a 20×/0.8 objective. Acquisition settings were kept identical for all groups within an experiment.
Small interfering RNA (siRNA) transfection and plasmid overexpression
The siRNA targeting GP1BA (si-GPIbα) and a non-targeting negative control siRNA (si-NC) were used. Sequences (5ʹ-3ʹ): si-GPIbα sense GCACCUGGACCUCUUCAAUdTdT, antisense AUUGAAGAGGUCCAGGUGCdTdT; si-NC sense UUCUCCGAACGUGUCACGUdTdT, antisense ACGUGACACGUUCGGAGAAdTdT were designed. The full-length human GP1BA coding sequence (NM_000173.7) was cloned into the pcDNA3.1(+) vector and verified by Sanger sequencing. The cells were seeded in a 6-well plate. When they reached 60-70% confluence, the cells were transfected with 50 nM siRNA or 2 μg plasmid per well using a lipid-based transfection reagent in reduced-serum medium according to the manufacturer's instructions. The medium was replaced with complete medium 6 h after transfection. Forty-eight hours after transfection, the cells were treated with Sal B or vehicle for a further 24 h. Knockdown and overexpression efficiency was verified at both the protein and mRNA levels by Western blotting (step 7) and RT-qPCR (step 8), respectively.
Western blot analysis
The cells were lysed in RIPA lysis buffer supplemented with a protease and phosphatase inhibitor cocktail on ice for 30 min. The lysates were centrifuged at 12,000 × g for 15 min at 4 °C, and the supernatant was collected. The protein concentration was determined with a BCA Protein Assay Kit. A total of 30 μg of protein per lane was denatured in loading buffer at 95 °C for 5 min. The proteins were separated on a 10% SDS-PAGE gel (8% was used for GPIbα and N-cadherin) at 80 V through the stacking gel and 120 V through the resolving gel. The proteins were transferred to a 0.45 μm polyvinylidene difluoride (PVDF) membrane by wet transfer at 300 mA for 90 min at 4 °C. The membrane was blocked in 5% non-fat milk in Tris-buffered saline with 0.1% Tween-20 for 1 h at room temperature. For phosphorylated proteins, the membrane was blocked in 5% bovine serum albumin (BSA) instead. The membrane was incubated overnight at 4 °C with the primary antibody against E-cadherin, N-cadherin, Vimentin, GPIbα, LYN, phospho-LYN (Tyr397), TWIST1, β-actin, or GAPDH at the dilution listed in the Table of Materials. The membrane was washed three times for 10 min with Tris-buffered saline with 0.1% Tween-20. The membrane was incubated with the horseradish peroxidase-conjugated secondary antibody (1:5,000) for 1 h at room temperature. The blot was developed with an enhanced chemiluminescence substrate, and the signal was captured on a chemiluminescence imaging system. Band intensities were quantified in ImageJ. The target protein was normalized to β-actin from the same membrane; phospho-LYN was normalized to total LYN. All values were expressed relative to the control group of the same experiment, which was set to 1.
Reverse transcription quantitative PCR (RT-qPCR)
The total RNA from the cells was isolated with a phenol/guanidinium-based reagent, and confirmed A260/A280 between 1.8 and 2.0. Then, 1 μg of RNA was reverse-transcribed in a 20 μL reaction with a first-strand cDNA synthesis kit that includes genomic DNA removal. The authors used the following program: 42 °C for 2 min for genomic DNA removal, 37 °C for 15 min for reverse transcription, and 85 °C for 5 s for enzyme inactivation. A 20 μL qPCR reaction containing 10 μL of SYBR Green master mix, 0.4 μM of each primer, and 2 μL of cDNA was prepared. Sequences (5ʹ-3ʹ): GP1BA forward GGCAGACTCTTCCCTAAAGCC, reverse GTGGCCACCACCTTGTAGATG; LYN forward TGGAGAGGCTCCAGCATAAAA, reverse CCACCTGTCTGCTATCTGTGT; TWIST1 forward GTCCGCAGTCTTACGAGGAG, reverse GCTTGAGGGTCTGAATCTTGCT; GAPDH forward GGAGCGAGATCCCTCCAAAAT, reverse GGCTGTTGTCATACTTCTCATGG. The following program ran on a real-time PCR system: 95 °C for 30 s, followed by 40 cycles of 95 °C for 5 s and 60 °C for 30 s. A melting curve analysis from 65 °C to 95 °C in 0.5 °C increments was conducted at the end of each plate. Each sample was run in triplicate and included no-template and no-reverse-transcription controls on every plate. The relative expression was calculated with the 2(-ΔΔCt) method, using GAPDH as the reference gene.
Immunofluorescence staining
The cells were grown on glass coverslips in a 24-well plate and treated as required. The cells were fixed in 4% paraformaldehyde for 15 min at room temperature. The cells were permeabilized with 0.2% Triton X-100 for 10 min and blocked with 5% BSA for 1 h at room temperature. The coverslips were incubated overnight at 4 °C with the primary antibody against N-cadherin, Vimentin, LYN, or phospho-LYN (Tyr397) at the dilution listed in the Table of Materials. The coverslips were washed three times with PBS and incubated with an Alexa Fluor 488-conjugated secondary antibody (1:500) for 1 h at room temperature. The nuclei were counterstained with DAPI for 10 min, and the coverslips were mounted in antifade mounting medium. Images were acquired using a laser-scanning confocal microscope with a 63×/1.40 oil-immersion objective. Laser power, detector gain, pinhole, and scanning speed were set on the control group and kept identical for all groups within an experiment. Channels were acquired sequentially to avoid bleed-through, and a no-primary-antibody control was included.
Definition of control groups
For the concentration screening and PP2 experiments, the authors used untransfected cells treated with vehicle (0.1% DMSO) as the control group. For experiments that include GPIbα knockdown or overexpression, cells transfected in parallel with the empty pcDNA3.1(+) vector and non-targeting siRNA and treated with vehicle were used as the control group. For Western blotting, β-actin was used as the loading control.
Statistical analysis
The independent biological replicate was treated as the unit of statistical analysis. The technical replicates and multiple imaging fields within a replicate were averaged before analysis. Each experiment was performed three times independently (n = 3), and the data were presented as mean ± standard deviation (SD). The distribution of the data was assessed using the Shapiro-Wilk test, and the homogeneity of variances was assessed using the Levene test. Two groups were compared using a two-tailed unpaired Student's t-test, and three or more groups were compared using one-way analysis of variance, followed by Tukey's post hoc test for all pairwise comparisons. The specific comparisons were stated in each figure legend. Exact p-values were reported in the figures and in the source data, except where p < 0.001. A two-sided p-value below 0.05 was considered statistically significant. All analyses were performed, and all graphs were produced in a suitable statistical/graphing software package.
Ergebnisse
Sal B reduces cervical cancer cell viability and wound closure
To evaluate the effects of Sal B on cervical cancer cells, cell viability was first examined with the cell viability assay described in the PROTOCOL section "Cell viability assay" (Figure 1). HeLa and SiHa cells were treated with 5-120 μM Sal B. Sal B reduced cell viability in both cell lines in a concentration-dependent manner. In HeLa cells, the reduction was marked at the higher concentrations, particularly at 80 and 120 μM (Figure 1A), whereas SiHa cells showed a gradual reduction with significant inhibition from 5 μM upward (Figure 1D). A concentration of 20 μM was selected for all subsequent experiments because it produced a reproducible but submaximal reduction in viability in both cell lines, thereby limiting confounding of the functional assays by overt cytotoxicity. Wound healing assays were then performed as described in the PROTOCOL section "Wound healing assay" to assess the effect of Sal B on wound closure. In both HeLa and SiHa cells, Sal B reduced wound closure relative to the control group at 12 and 24 h after scratching (Figure 1B and 1E). To examine whether GPIbα was involved in this effect, GPIbα overexpression and knockdown were combined with Sal B treatment. GPIbα overexpression partially attenuated the effect of Sal B on wound closure, whereas GPIbα knockdown further reduced wound closure in both cell lines (Figure 1B and 1E). Panels 1B and 1E show representative images from three independent experiments and were not quantified; the differences described here are therefore qualitative.
The next assessment examined whether inhibition of Src-family kinases affected wound closure. PP2 reduced wound closure in HeLa and SiHa cells, and the combination of Sal B and PP2 produced a greater reduction than either agent alone relative to the control group (Figure 1C and 1F). Because PP2 inhibits several members of the Src family and is not selective for LYN, these observations support the involvement of Src-family kinase-related signaling in the effects of Sal B, but they do not identify LYN as the specific mediator. Panels 1C and 1F are likewise representative images that were not quantified. Taken together, these findings indicate that Sal B reduces cervical cancer cell viability and wound closure, and that the effect on wound closure is modified by GPIbα and by Src-family kinase inhibition. An important caveat applies to the interpretation of the wound healing data: Sal B and PP2 also reduced cell viability and EdU incorporation under the same conditions, so the reduction in wound closure may partly reflect decreased proliferation and survival rather than a selective impairment of cell motility.
GPIbα modulation alters the effect of Sal B on wound closure
To determine whether GPIbα is involved in the effects of Sal B on wound closure, knockdown and overexpression experiments were performed as described in the PROTOCOL section (siRNA transfection and plasmid overexpression). Transfection of si-GPIbα reduced GPIbα protein and GP1BA mRNA levels by more than 80% relative to non-targeting siRNA, as confirmed by Western blotting and RT-qPCR, whereas transfection of pcDNA3.1-GPIbα markedly increased GPIbα expression relative to the empty vector. Importantly, the overexpression and knockdown constructs were introduced before Sal B treatment, so that all comparisons in the modulation experiments were made against cells that received the same vehicle and the same transfection procedure. In wound healing assays, GPIbα knockdown further reduced wound closure in the presence of Sal B, whereas GPIbα overexpression partially attenuated the effect of Sal B in both HeLa and SiHa cells (Figure 1B and 1E). These observations suggest that GPIbα contributes to the response of cervical cancer cells to Sal B, with the same proliferation-related caveat noted above. Together, these results indicate that GPIbα participates in the reduction of wound closure produced by Sal B in cervical cancer cells.
Sal B reduces EMT-related marker expression and LYN and p-LYN fluorescence signals through GPIbα modulation
To investigate whether GPIbα is involved in the regulation of EMT-associated molecular changes by Sal B, the fluorescence signals of N-cadherin, Vimentin, LYN, and p-LYN were examined by immunofluorescence staining in HeLa and SiHa cells, as described in the PROTOCOL section "Immunofluorescence staining" (Figure 2). Compared with the control group, Sal B visibly reduced the fluorescence signals of the mesenchymal markers N-cadherin and Vimentin in both cell lines (Figure 2A, 2D, 2E, and 2H). Because these panels present representative images acquired under identical settings and were not subjected to intensity quantification, the differences are described qualitatively. The next assessment addressed whether GPIbα modulation affected these Sal B-induced changes. In the presence of Sal B, GPIbα overexpression partially restored the fluorescence signals of N-cadherin and Vimentin, whereas GPIbα knockdown further reduced them. Because the images were not quantified, these observations are qualitative and are interpreted together with the Western blot data, which suggests that GPIbα contributes to the regulation of EMT-related marker expression in cervical cancer cells treated with Sal B.
In addition, Sal B reduced the fluorescence signals of LYN and p-LYN in both HeLa and SiHa cells (Figure 2B, 2C, 2F, and 2G). GPIbα overexpression attenuated this effect, whereas GPIbα knockdown further decreased LYN and p-LYN signals. These observations are consistent with the Western blot data and suggest that Sal B reduces LYN pathway-related signaling at least in part through downregulation of GPIbα. Together, these immunofluorescence observations are consistent with the hypothesis that Sal B suppresses EMT-associated molecular changes and LYN pathway-related signaling through modulation of GPIbα in cervical cancer cells.
Sal B reduces GPIbα and TWIST1 expression and EdU incorporation in cervical cancer cells
To explore the molecular events associated with the effects of Sal B on proliferative activity, TWIST1 expression was examined by Western blotting in cervical cancer cells treated with Sal B, PP2, or their combination, as described in the PROTOCOL section "Western blot analysis". Sal B reduced TWIST1 protein expression in both HeLa and SiHa cells. PP2 also decreased TWIST1 expression, and the combination of Sal B and PP2 produced a more pronounced reduction (Figure 3A-B). Since PP2 inhibits Src-family kinases collectively, these data support the participation of Src-family kinase-related signaling upstream of TWIST1 but do not establish that the effect is mediated specifically by LYN.
The next assessment examined whether Sal B affected GPIbα expression. Western blotting showed that Sal B decreased GPIbα protein expression in both HeLa and SiHa cells compared with the control group (Figure 3C-D). These results indicate that Sal B reduces GPIbα expression and that this reduction is accompanied by lower TWIST1 protein levels in cervical cancer cells. To assess the effects of Sal B and PP2 on proliferative activity, EdU incorporation was examined as described in the PROTOCOL section "EdU incorporation assay". Compared with the control group, Sal B or PP2 reduced EdU-positive staining in both HeLa and SiHa cells, and the combination produced a further decrease (Figure 3E-F). Panels 3E and 3F present representative images from three independent experiments and were not quantified. Together, these results suggest that Sal B reduces GPIbα and TWIST1 expression and that inhibition of Src-family kinases is associated with a further reduction in proliferative activity in cervical cancer cells.
GPIbα is involved in the suppression of the proposed LYN/TWIST1 signaling axis and of EMT-related markers by Sal B
To determine whether GPIbα is involved in the effects of Sal B on EMT-related signaling, the LYN/TWIST1 axis and EMT marker expression were examined in HeLa and SiHa cells after GPIbα overexpression or knockdown. All modulation experiments were performed in the presence of Sal B, and every band was normalized to β-actin from the same membrane and then expressed relative to the vehicle-treated control of the same experiment, which was set to 1; p-LYN was normalized to total LYN. Western blotting showed that Sal B reduced LYN phosphorylation, as indicated by a decreased p-LYN/LYN ratio, and downregulated TWIST1 protein expression in both cell lines (Figure 4A-C). Sal B also increased the epithelial marker E-cadherin and decreased the mesenchymal markers N-cadherin and Vimentin, indicating suppression of EMT-associated molecular changes (Figure 4D-F).
Compared with Sal B alone, GPIbα overexpression in the presence of Sal B raised GPIbα protein back towards, but not above, the level of the untreated control, and it partially restored p-LYN/LYN and TWIST1 levels while attenuating the Sal B-induced changes in EMT markers, as shown by lower E-cadherin and higher N-cadherin and Vimentin expression. This design is therefore a rescue experiment rather than a gain-of-function experiment: the relevant comparison is between the Sal B group and the Sal B plus pc-GPIbα group, and the partial reversal is interpreted as restoration of GPIbα towards baseline rather than as supraphysiological overexpression. Conversely, GPIbα knockdown in the presence of Sal B further enhanced the effects of Sal B, resulting in lower p-LYN/LYN, TWIST1, N-cadherin, and Vimentin levels together with higher E-cadherin expression (Figure 4A-F). Consistent with the protein data, RT-qPCR showed that Sal B reduced LYN and TWIST1 mRNA levels in both HeLa and SiHa cells. GPIbα overexpression partially reversed this reduction, whereas GPIbα knockdown further decreased LYN and TWIST1 mRNA levels under Sal B treatment (Figure 4G-H). Together, these results suggest that GPIbα participates in the suppression of the proposed LYN/TWIST1 signaling axis and of EMT-related marker expression by Sal B in cervical cancer cells.
DATA AVAILABILITY:
The data analyzed in this study are publicly available on figshare and can be accessed via the following link: https://doi.org/10.6084/m9.figshare.33974185
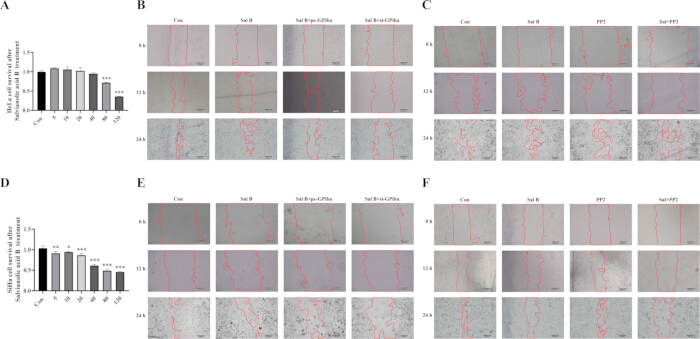
Figure 1: Sal B reduces cervical cancer cell viability and wound closure in HeLa and SiHa cells. (A, D) Cell viability of HeLa (A) and SiHa (D) cells measured with the Cell Counting Kit-8 assay after treatment with 5, 10, 20, 40, 80, or 120 μM Sal B. Viability is expressed as a percentage of the vehicle control (0.1% DMSO) of the same plate, which was set to 100%. Six technical replicate wells were averaged per independent experiment; data are mean ± SD of n = 3 independent experiments, and error bars denote SD. Groups were compared with the vehicle control by one-way analysis of variance followed by the Tukey post hoc test. *p < 0.05, **p < 0.01, ***p < 0.001 versus vehicle control; exact p values are given in the source data. (B, E) Representative wound healing images of HeLa (B) and SiHa (E) cells under four conditions: Control (cells transfected with empty pcDNA3.1(+) vector and non-targeting siRNA and treated with 0.1% DMSO), Sal B (20 μM), Sal B combined with GPIbα overexpression (Sal B + pc-GPIbα), and Sal B combined with GPIbα knockdown (Sal B + si-GPIbα). Images were captured at 0, 12, and 24 h after scratching. (C, F) Representative wound healing images of HeLa (C) and SiHa (F) cells under four conditions: Control (untransfected cells treated with 0.1% DMSO), Sal B (20 μM), PP2 (10 μM), and Sal B combined with PP2; images were captured at 0, 12, and 24 h after scratching. Panels B, C, E, and F show representative fields from three independent experiments and were not quantified, so no statistical comparison is reported for these panels. Scale bar = 200 μm. Abbreviations: Sal B = salvianolic acid B; GPIbα = platelet glycoprotein Ib alpha; pc-GPIbα = pcDNA3.1-GPIbα; si-GPIbα = small interfering RNA targeting GP1BA; SD = standard deviation. Please click here to view a larger version of this figure.
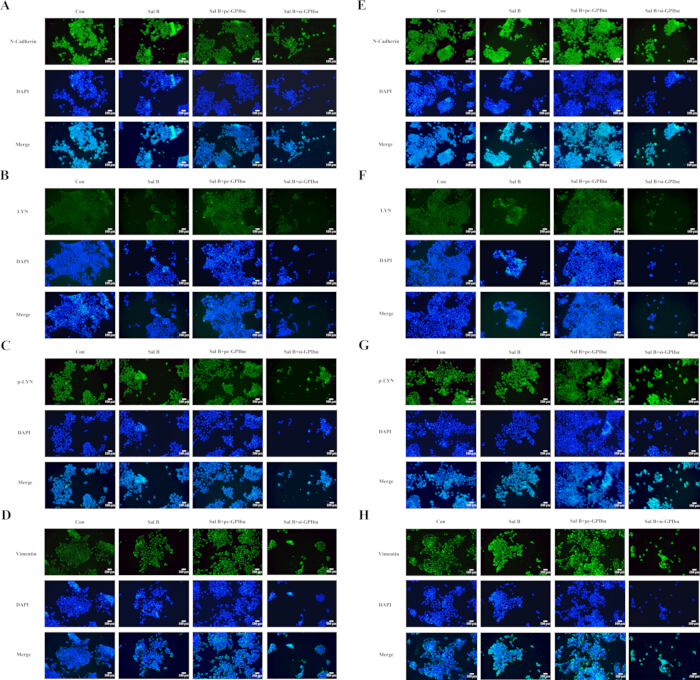
Figure 2: Sal B reduces EMT-related marker expression and LYN and p-LYN fluorescence signals through GPIbα modulation in cervical cancer cells. (A-D) Representative immunofluorescence images of N-cadherin (A), LYN (B), phosphorylated LYN (p-LYN, Tyr397) (C), and Vimentin (D) in HeLa cells under four conditions: Control (cells transfected with empty pcDNA3.1(+) vector and non-targeting siRNA and treated with 0.1% DMSO), Sal B (20 μM, 24 h), Sal B combined with GPIbα overexpression (Sal B + pc-GPIbα), and Sal B combined with GPIbα knockdown (Sal B + si-GPIbα). (E-H) Representative immunofluorescence images of N-cadherin (E), LYN (F), p-LYN (G), and Vimentin (H) in SiHa cells under the same four conditions. Green fluorescence indicates the target protein; nuclei were counterstained with DAPI (blue), and merged images are shown in the lower row of each panel. All images within a panel were acquired with identical laser power, detector gain, and exposure settings and are displayed with identical brightness and contrast. Images are representative of three independent experiments with five fields recorded per coverslip; fluorescence intensity was not quantified, so no error bars, sample size, or statistical test apply to this figure, and the described differences are qualitative. Scale bar = 50 μm. Abbreviations: EMT = epithelial-mesenchymal transition; DAPI = 4',6-diamidino-2-phenylindole. Please click here to view a larger version of this figure.
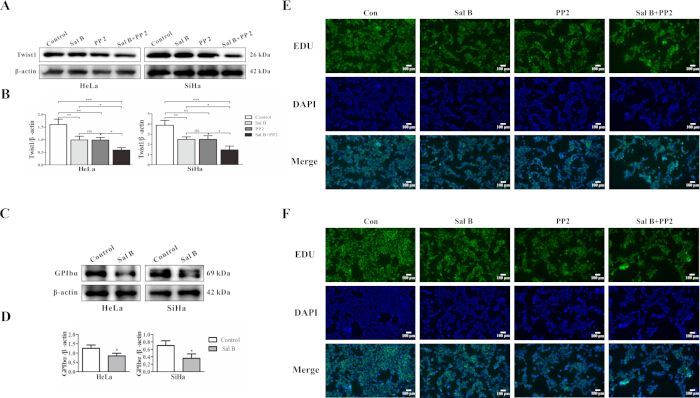
Figure 3: Sal B reduces GPIbα and TWIST1 expression and EdU incorporation in cervical cancer cells. (A) Western blot analysis of TWIST1 protein in HeLa and SiHa cells under four conditions: vehicle control (0.1% DMSO), Sal B (20 μM), PP2 (10 μM), and Sal B combined with PP2; β-actin served as the loading control. (B) Densitometric quantification of TWIST1, normalized to β-actin from the same membrane and expressed relative to the vehicle control, which was set to 1. (C) Western blot analysis of GPIbα protein in HeLa and SiHa cells treated with vehicle or Sal B (20 μM); β-actin served as the loading control. (D) Densitometric quantification of GPIbα, normalized to β-actin and expressed relative to the vehicle control. In B and D, data are mean ± SD of n = 3 independent experiments, and error bars denote SD; two groups were compared with a two-tailed unpaired Student's t-test (D) and four groups with one-way analysis of variance followed by the Tukey post hoc test (B), with each group compared with the vehicle control and with the single-agent groups. *p < 0.05, **p < 0.01, ***p < 0.001; ns, not significant; exact p values are given in the source data. (E, F) Representative EdU staining of HeLa (E) and SiHa (F) cells under the same four conditions. EdU-positive nuclei are green, nuclei were counterstained with DAPI (blue), and merged images are shown. Panels E and F are representative of three independent experiments with five fields recorded per coverslip and were not quantified, so no statistical comparison is reported for these panels. Scale bar = 100 μm. Abbreviations: EdU = 5-ethynyl-2'-deoxyuridine. Please click here to view a larger version of this figure.
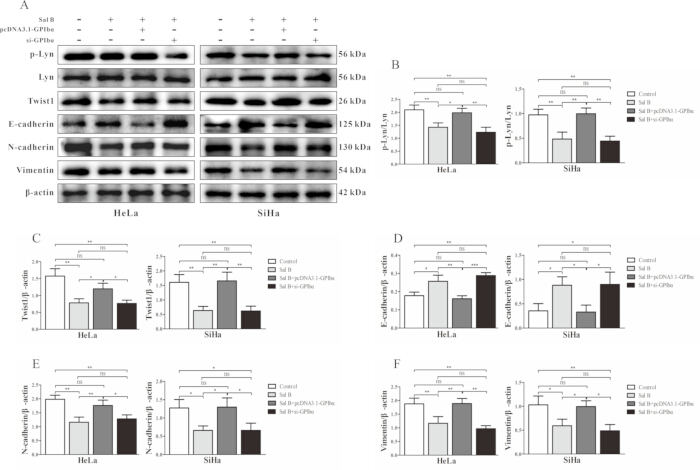
Figure 4: GPIbα is involved in the effects of Sal B on the proposed LYN/TWIST1 signaling axis and on EMT-related markers in cervical cancer cells. (A) Western blot analysis of p-LYN (Tyr397), total LYN, TWIST1, E-cadherin, N-cadherin, and Vimentin in HeLa and SiHa cells under four conditions: Control (cells transfected with empty pcDNA3.1(+) vector and non-targeting siRNA and treated with 0.1% DMSO), Sal B (20 μM, 24 h), Sal B combined with GPIbα overexpression (Sal B + pcDNA3.1-GPIbα), and Sal B combined with GPIbα knockdown (Sal B + si-GPIbα); β-actin served as the loading control. All GPIbα modulation was performed in the presence of Sal B, so the group labeled Sal B + pcDNA3.1-GPIbα represents a rescue condition in which GPIbα is restored to the level of the untreated control rather than raised above it. (B) Densitometric quantification of p-LYN normalized to total LYN from the same membrane. (C-F) Densitometric quantification of TWIST1 (C), E-cadherin (D), N-cadherin (E), and Vimentin (F), each normalized to β-actin from the same membrane; all values are expressed relative to the Control group of the same experiment, which was set to 1. (G, H) Relative LYN and TWIST1 mRNA levels in HeLa (G) and SiHa (H) cells measured by RT-qPCR, normalized to GAPDH with the 2-ΔΔCt method and expressed relative to the Control group. Data are mean ± SD of n = 3 independent experiments, error bars denote SD, and the unit of analysis is the independent experiment. Groups were compared by one-way analysis of variance followed by the Tukey post hoc test, with the Sal B group compared with the Control group and the two modulation groups compared with the Sal B group. *p < 0.05, **p < 0.01, ***p < 0.001; ns, not significant; exact p values are given in the source data. RT-qPCR, reverse transcription quantitative PCR. Please click here to view a larger version of this figure.
Diskussion
This protocol integrates pharmacological modulation, genetic modulation, and molecular readouts to dissect a candidate signaling axis linking a natural compound to EMT-associated phenotypes in cervical cancer cells. Unlike single-agent studies that rely only on drug treatment24, or genetic studies that use knockdown or overexpression alone16, the combination of Sal B treatment with GPIbα knockdown and overexpression and with the Src-family kinase inhibitor PP2 allows convergent and orthogonal evidence to be assembled from complementary assays. Functional readouts (cell viability, wound healing, and EdU incorporation) and molecular readouts (Western blotting, RT-qPCR, and immunofluorescence) are combined in the same experimental system so that changes in EMT markers can be interpreted alongside changes in cell behavior. This design is broadly applicable to the analysis of other natural compounds and other candidate regulators of EMT in epithelial cancers.
Several steps in the protocol are critical for reproducibility. First, the working concentration of Sal B (20 μM for 24 h) was defined from the concentration-viability curve so as to produce a reproducible but submaximal reduction in viability; this choice limits confounding of downstream readouts by overt cytotoxicity and should be re-derived for any new cell line rather than transferred directly. Second, the DMSO concentration must be held constant at 0.1% across all groups, including the vehicle control, because DMSO itself has biological activity at higher concentrations24. Third, in the wound healing assay, three predefined positions per well are marked on the underside of the plate before scratching and are re-imaged at each time point, and the denuded area is outlined by an operator blinded to group allocation; without these steps, the assay is prone to sampling and analyst bias. Fourth, image acquisition settings for immunofluorescence and EdU staining are set on the control group and kept identical for all groups within an experiment. Fifth, each experiment is performed as three independent biological replicates, each initiated from a separate cell passage on a separate day, and the independent replicate rather than the technical replicate is treated as the unit of statistical analysis.
The protocol contains modifications that address common pitfalls of the individual assays. The wound healing assay is performed in serum-free medium to limit proliferation during the assay; however, because Sal B and PP2 also reduce viability and EdU incorporation at the concentrations used, wound closure should be treated as a composite readout rather than as independent evidence of impaired migration. When motility-specific evidence is required, the protocol can be extended with single-cell tracking or transwell assays performed under mitomycin C treatment. PP2 is used as a pharmacological probe of Src-family kinase-dependent signaling, but it is not selective for LYN33,34; isoform-selective approaches such as siRNA-mediated LYN knockdown, kinase-dead LYN rescue, or a more selective LYN inhibitor should be added when the specific involvement of LYN needs to be demonstrated. In siRNA and plasmid experiments, knockdown and overexpression efficiency must be verified at both the protein and mRNA levels before the results are interpreted, and non-targeting siRNA and empty vector controls must be transfected in parallel. Antibody specificity should be re-verified for each new lot, and specificity for GPIbα is further supported here by the loss of signal after siRNA-mediated knockdown.
The protocol has several limitations that should be considered when interpreting the data. First, all experiments are performed in vitro in two established cervical cancer cell lines (HeLa and SiHa); in vivo validation in xenograft or orthotopic models is required before conclusions can be drawn about tumor progression. Second, the image-based assays (wound healing, EdU incorporation, and immunofluorescence staining) are presented as representative images without intensity or count quantification, and are therefore qualitative; when quantitative comparisons are needed, the protocol should be extended with intensity thresholding, blinded manual counting, or automated segmentation, and appropriate statistical tests applied. Third, no patient tissue was examined in this work, so the clinical relevance of tumor cell-associated GPIbα, and its relevance to other epithelial cancers, remains to be established through immunohistochemistry or single-cell analysis in annotated surgical cohorts35. Fourth, because both Sal B and PP2 reduce viability and proliferative activity in parallel with wound closure, the reduction in wound closure cannot be attributed to a selective impairment of migration and should be interpreted as a composite readout as noted above.
Beyond the specific findings reported here, this protocol is applicable to other natural compounds and other candidate regulators of EMT-associated signaling in epithelial cancer cells. The current landscape of EMT-targeting strategies in cancer therapy is limited by pathway redundancy and systemic toxicity, as pathways such as TGF-β, Wnt/β-catenin, and Notch are widely expressed in normal tissues36,37,38; in this context, tumor cell-associated GPIbα emerges from the present data as a candidate regulatory molecule that participates in EMT-associated signaling. Sal B has been well characterized in cardiovascular indications with a favorable pharmacokinetic profile39, and its ability to modulate EMT-associated signaling through the proposed GPIbα/LYN/TWIST1 axis suggests potential value for further investigation, including possible combination strategies. The same experimental framework - concentration screening followed by combined genetic and pharmacological modulation and paired functional/molecular readouts - can be transposed to other cancer types (for example, breast, lung, or colorectal cancer) and to other candidate regulatory molecules in the EMT program.
In summary, this protocol provides a stepwise workflow for evaluating a natural compound as a modulator of EMT-associated cellular phenotypes in cervical cancer cells, using an integrated design that combines pharmacological and genetic modulation with paired functional and molecular readouts. Applied to salvianolic acid B in HeLa and SiHa cells, the protocol yielded in vitro evidence that Sal B reduces cell viability, wound closure, and EdU incorporation and downregulates GPIbα, together with reduced LYN phosphorylation and TWIST1 expression, while GPIbα knockdown and overexpression modulate these effects. The proposed GPIbα/LYN/TWIST1 axis may therefore represent a regulatory route through which Sal B modulates EMT-related phenotypes in cervical cancer cells; because the pharmacological evidence rests on a non-selective Src-family kinase inhibitor and the image-based assays were not quantified, these conclusions are provisional, and in vivo and preclinical studies applying this protocol in extended models are required to confirm its biological and therapeutic relevance.
Offenlegungen
The authors declare no competing interests. No generative artificial intelligence tool was used in the design of the study, the analysis of the data, the preparation of the figures, or the writing of this manuscript.
Author Contributions:
Huiling Yang, Yitong Du, and Yali Zhuang conceived and designed the study. Huiling Yang, Yitong Du, and Yichen Feng performed the cell culture, drug treatment, and functional assays. Yichen Feng and Qiaoqiao Zhan performed the Western blotting and RT-qPCR. Qiaoqiao Zhan and Tingting Zhu performed the immunofluorescence staining and image acquisition. Huiling Yang and Tingting Zhu analyzed the data and prepared the figures. Huiling Yang drafted the manuscript. Zejun Wu and Yali Zhuang supervised the study and revised the manuscript. All authors read and approved the final version of the manuscript.
Danksagungen
This work was supported by the National Natural Science Foundation of China, grant number 82274568, and by the Natural Science Foundation of Henan Province, grant number 232300420168. The funders had no role in study design, data collection and analysis, decision to publish, or preparation of the manuscript.
Materialien
| Name | Unternehmen | Katalognummer | Kommentare |
|---|---|---|---|
| 4% paraformaldehyde fixative solution | Beyotime | P0099 | Used for cell fixation |
| BCA protein assay kit | Beyotime | P0012 | Used for protein concentration measurement |
| Cell Counting Kit-8 | Dojindo | CK04 | Used for cell viability assay |
| Chemiluminescence imaging system | Bio-Rad | ChemiDoc XRS+ | Used for Western blot imaging |
| Chemiluminescent substrate | Bio-Rad | 1705061 | Used for Western blot signal detection |
| DAPI staining solution | Beyotime | C1002 | Used for nuclear staining |
| Dimethyl sulfoxide | Sigma-Aldrich | D2650 | Used as solvent for Sal B and PP2 |
| Dulbecco's modified Eagle medium | Gibco | 11965092 | Basal culture medium |
| E-cadherin antibody | Cell Signaling Technology | 3195 | Used for Western blotting; RRID:AB_2291471 |
| EdU cell proliferation kit | Beyotime | C0071S | Used for EdU staining |
| Empty vector | Invitrogen | V79020 | pcDNA3.1 empty vector control |
| Fetal bovine serum | Gibco | 10099141C | Added to culture medium at 10% |
| Fluorescence-conjugated goat anti-rabbit IgG secondary antibody | Invitrogen | A-11008 | Used for immunofluorescence staining; RRID:AB_143165 |
| GPIbα/CD42b antibody | Abcam | ab134087 | Used for Western blotting; RRID:AB_2936922 |
| GPIbα-specific siRNA | GenePharma | Custom synthesis | Used for GPIbα knockdown; final concentration, 50 nM |
| GraphPad Prism software | GraphPad Software | Prism 9.0 | Used for statistical analysis and graph generation; available at https://www.graphpad.com/; RRID:SCR_002798 |
| HeLa cells | Cell Bank of the Chinese Academy of Sciences | TCHu187 | Human cervical cancer cell line; RRID:CVCL_0030 |
| Horseradish peroxidase-conjugated goat anti-rabbit IgG secondary antibody | Cell Signaling Technology | 7074 | Used for Western blotting; RRID:AB_2099233 |
| ImageJ software | National Institutes of Health | 1.53 | Used for image and densitometric analysis; available at https://imagej.nih.gov/ij/; RRID:SCR_003070 |
| Inverted microscope | Leica Microsystems | DMi1 | Used for wound healing assay imaging |
| Lipofectamine 3000 transfection reagent | Invitrogen | L3000015 | Used for siRNA and plasmid transfection |
| LYN antibody | Cell Signaling Technology | 2796 | Used for Western blotting and immunofluorescence staining; RRID:AB_2138391 |
| N-cadherin antibody | Cell Signaling Technology | 13116 | Used for Western blotting and immunofluorescence staining; RRID:AB_2687616 |
| Negative control siRNA | GenePharma | Custom synthesis | Non-targeting siRNA control |
| Opti-MEM reduced-serum medium | Gibco | 31985070 | Used for transfection complex preparation |
| pcDNA3.1-GPIbα plasmid | GenePharma | Custom synthesis | Full-length human GP1BA coding sequence cloned into pcDNA3.1 vector |
| Penicillin-streptomycin solution | Gibco | 15140122 | Added to culture medium |
| Phosphatase inhibitor cocktail | Beyotime | P1081 | Added to protein lysis buffer |
| Phosphate-buffered saline | Gibco | 10010023 | Used for cell washing |
| Phospho-LYN antibody | Cell Signaling Technology | 2731 | Used for Western blotting and immunofluorescence staining; RRID:AB_2138262 |
| PP2 | MedChemExpress | HY-13805 | Src-family kinase inhibitor; final concentration, 10 μM |
| Protease inhibitor cocktail | Beyotime | P1005 | Added to protein lysis buffer |
| PVDF membrane | Millipore | IPVH00010 | Used for Western blotting |
| Quantitative PCR instrument | Applied Biosystems | QuantStudio 6 Flex | Used for RT-qPCR |
| Reverse transcription kit | Takara | RR047A | Used for cDNA synthesis |
| RIPA lysis buffer | Beyotime | P0013B | Used for total protein extraction |
| Salvianolic acid B | MedChemExpress | HY-N1362 | Dissolved in DMSO; stock concentration, 10 mM |
| SiHa cells | Cell Bank of the Chinese Academy of Sciences | TCHu113 | Human cervical cancer cell line; RRID:CVCL_0032 |
| SYBR Green qPCR master mix | Takara | RR820A | Used for RT-qPCR |
| Total RNA extraction reagent | Invitrogen | 15596026 | Used for total RNA extraction |
| Triton X-100 | Sigma-Aldrich | T8787 | Used for cell permeabilization |
| Trypsin-EDTA solution | Gibco | 25200056 | Used for cell dissociation |
| TWIST1 antibody | Cell Signaling Technology | 46702 | Used for Western blotting; RRID:AB_2799308 |
| Vimentin antibody | Cell Signaling Technology | 5741 | Used for Western blotting and immunofluorescence staining; RRID:AB_10695459 |
| β-actin antibody | Cell Signaling Technology | 4970 | Loading control for Western blotting; RRID:AB_2223172 |
Referenzen
- Singh D, et al. Global estimates of incidence and mortality of cervical cancer in 2020: a baseline analysis of the WHO Global Cervical Cancer Elimination Initiative. Lancet Glob Health. 2023;11:e197-e206.
- Zhang Y, et al. HPV vaccination, screening disparities, and the shifting landscape of cervical cancer burden: a global analysis of trends, inequalities, and policy implications. BMC Womens Health. 2025;25:285.
- Zhang Y, et al. Roles of human papillomavirus in cancers: oncogenic mechanisms and clinical use. Signal Transduct Target Ther. 2025;10:44.
- Pavelescu LA, et al. Molecular Insights into HPV-Driven Cervical Cancer: Oncoproteins, Immune Evasion, and Epigenetic Modifications. Microorganisms. 2025;13:1000.
- Sun X, He L, Wang S. Risk factors for pelvic lymph node metastasis in cervical cancer: a retrospective analysis of 186 patients. Front Oncol. 2025;15:1525946.
- Pastushenko I, Blanpain C. EMT Transition States during Tumor Progression and Metastasis. Trends Cell Biol. 2019;29:212-26.
- Garg M. Emerging roles of epithelial-mesenchymal plasticity in invasion-metastasis cascade and therapy resistance. Cancer Metastasis Rev. 2022;41:131-45.
- Castilla MA, et al. Micro-RNA signature of the epithelial-mesenchymal transition in endometrial carcinosarcoma. J Pathol. 2011;223:72-80.
- Babaei G, Aziz SG, Jaghi NZZ. EMT, cancer stem cells and autophagy; The three main axes of metastasis. Biomed Pharmacother. 2021;133:110909.
- Zhang H, et al. Review of possible mechanisms of radiotherapy resistance in cervical cancer. Front Oncol. 2023;13:1164985.
- Jin W. Role of JAK/STAT3 Signaling in the Regulation of Metastasis, the Transition of Cancer Stem Cells, and Chemoresistance of Cancer by Epithelial-Mesenchymal Transition. Cells. 2020;9:217.
- Sun L, et al. Transcription factor Twist1 drives fibroblast activation to promote kidney fibrosis via signaling proteins Prrx1/TNC. Kidney Int. 2024;106:840-55.
- Lou XL, et al. Aspirin inhibit platelet-induced epithelial-to-mesenchymal transition of circulating tumor cells (Review). Biomed Rep. 2014;2:331-4.
- Scridon A. Platelets and Their Role in Hemostasis and Thrombosis-From Physiology to Pathophysiology and Therapeutic Implications. Int J Mol Sci. 2022;23:12772.
- Yang L, Wang Q, He L, Sun X. The critical role of tumor microbiome in cancer immunotherapy. Cancer Biol Ther. 2024;25:2301801.
- Zhang Y, Ehrlich SM, Zhu C, Du X. Signaling mechanisms of the platelet glycoprotein Ib-IX complex. Platelets. 2022;33:823-32.
- Tian Y, et al. Platelets and diseases: signal transduction and advances in targeted therapy. Signal Transduct Target Ther. 2025;10:159.
- Bendas G, Schlesinger M. The GPIb-IX complex on platelets: insight into its novel physiological functions affecting immune surveillance, hepatic thrombopoietin generation, platelet clearance and its relevance for cancer development and metastasis. Exp Hematol Oncol. 2022;11:19.
- Bagnato G, Leopizzi M, Urciuoli E, Peruzzi B. Nuclear Functions of the Tyrosine Kinase Src. Int J Mol Sci. 2020;21:2675.
- Ingley E. Functions of the Lyn tyrosine kinase in health and disease. Cell Commun Signal. 2012;10:21.
- Tornillo G, et al. Dual mechanisms of LYN kinase dysregulation drive aggressive behavior in breast cancer cells. Cell Rep. 2018;25:3674-92 e10.
- Fattet L, et al. Matrix rigidity controls epithelial-mesenchymal plasticity and tumor metastasis via a mechanoresponsive EPHA2/LYN complex. Dev Cell. 2020;54:302-16 e7.
- Ren J, et al. Salvia miltiorrhiza in Treating Cardiovascular Diseases: A Review on Its Pharmacological and Clinical Applications. Front Pharmacol. 2019;10:753.
- An Q, et al. Salviae miltiorrhiza against human lung cancer: A review of its mechanism (Review). Exp Ther Med. 2023;25:139.
- Wang J, et al. Salvianolic acid B suppresses EMT and apoptosis to lessen drug resistance through AKT/mTOR in gastric cancer cells. Cytotechnology. 2021;73:49-61.
- Han G, et al. Salvianolic acid B acts against non-small cell lung cancer A549 cells via inactivation of the MAPK and Smad2/3 signaling pathways. Mol Med Rep. 2022;25:184.
- Katary MA, et al. Salvianolic Acid B slows the progression of breast cancer cell growth via enhancement of apoptosis and reduction of oxidative stress, inflammation, and angiogenesis. Int J Mol Sci. 2019;20:5653.
- Liu F, et al. Salvianolic acid B inhibits hepatic stellate cell activation and liver fibrosis by targeting PDGFRbeta. Int Immunopharmacol. 2023;122:110550.
- Liu Q, et al. Salvianolic Acid B Attenuates Experimental Pulmonary Fibrosis through Inhibition of the TGF-beta Signaling Pathway. Sci Rep. 2016;6:27610.
- Zhao Y, et al. Salvianolic acid B inhibits atherosclerosis and TNF-alpha-induced inflammation by regulating NF-kappaB/NLRP3 signaling pathway. Phytomedicine. 2023;119:155002.
- Wang W, Hu W. Salvianolic acid B recovers cognitive deficits and angiogenesis in a cerebral small vessel disease rat model via the STAT3/VEGF signaling pathway. Mol Med Rep. 2018;17:3146-51.
- Xu Z, et al. Salvianolic acid B and tanshinone IIA synergistically improve early diabetic nephropathy through regulating PI3K/Akt/NF-kappaB signaling pathway. J Ethnopharmacol. 2024;319:117356.
- Choi YL, et al. LYN is a mediator of epithelial-mesenchymal transition and a target of dasatinib in breast cancer. Cancer Res. 2010;70:2296-306.
- Sun Y, et al. The role of the tyrosine kinase Lyn in allergy and cancer. Mol Immunol. 2021;131:121-6.
- Babion I, et al. miR-9-5p Exerts a Dual Role in Cervical Cancer and Targets Transcription Factor TWIST1. Cells. 2020;9(1):65.
- Wang X, Eichhorn PJA, Thiery JP. TGF-beta, EMT, and resistance to anti-cancer treatment. Semin Cancer Biol. 2023;97:1-11.
- Tang Q, et al. TM4SF1 promotes EMT and cancer stemness via the Wnt/beta-catenin/SOX2 pathway in colorectal cancer. J Exp Clin Cancer Res. 2020;39:232.
- Yang X, et al. m(6) A-Dependent Modulation via IGF2BP3/MCM5/Notch Axis Promotes Partial EMT and LUAD Metastasis. Adv Sci (Weinh). 2023;10:e2206744.
- Cheng J, et al. Safety, tolerance, and pharmacokinetics of salvianolic acid B in healthy Chinese volunteers: A randomized, double-blind, placebo-controlled phase 1 clinical trial. Front Pharmacol. 2023;14:1146309.