Este protocolo describe la generación y la caracterización fenotípica de un modelo de ratón C57BL/6N-Cracdem1(c.538-83 to c.3352+255 del) mediante la tecnología CRISPR/Cas9 para estudiar el papel de CRACD en el remodelado cardíaco tras un infarto de miocardio.
Artículo de método
Generación y Caracterización Fenotípica de un Modelo Murino Deficiente en Cracd Modificado con CRISPR/Cas9 para Estudios de Remodelación Post-Infarto de Miocardio
En este artículo
Resumen
Resumen
Myocardial infarction (MI) remains a major cause of morbidity and mortality worldwide. This protocol describes a method for generating and characterizing a Cracd-deficient mouse line on the C57BL/6N background using CRISPR/Cas9 technology. Zygotes were co-injected with Cas9 mRNA, a gRNA construct, and a donor template designed to generate a 3153-bp genomic deletion. The edited allele was confirmed by PCR genotyping and Sanger sequencing. To assess the functional role of CRACD in post-MI remodeling, Cracd-deficient and wild-type (WT, C57BL/6N) mice underwent MI induced by permanent ligation of the left anterior descending coronary artery. On postoperative day 7, cardiac function and left ventricular wall motion were assessed using transthoracic echocardiography and speckle-tracking strain imaging, followed by histopathological evaluation with H&E and Masson's trichrome staining. Representative results showed that Cracd-deficient mice exhibited reduced ventricular dilation and preserved systolic function compared to WT controls. This protocol provides a reliable experimental platform for mechanistic studies of CRACD in cardiac pathophysiology.
Introducción
El infarto de miocardio (IM) sigue siendo una de las principales causas de morbilidad y mortalidad en todo el mundo, lo que representa una carga significativa para la salud cardiovascular global.1El pronóstico a largo plazo tras un infarto de miocardio está determinado principalmente por el proceso de remodelación del ventrículo izquierdo (VI).2, que implica dilatación ventricular, adelgazamiento de la pared y fibrosis intersticial3,4, que son factores clave en la progresión hacia la insuficiencia cardíaca (IC). La incidencia global de IC derivada del remodelado cardíaco post-infarto de miocardio agrava aún más la carga de la enfermedad cardiovascular5A pesar de estas observaciones clínicas bien establecidas, faltan estudios sistemáticos que utilicen modelos in vivo sensibles y reproducibles para evaluar el papel de genes específicos en la remodelación post-infarto de miocardio. Actualmente no existe ningún protocolo que combine un modelo de knockout modificado con CRISPR/Cas9 con imágenes avanzadas de deformación para evaluar un regulador del citoesqueleto como CRACD. Por lo tanto, se necesita urgentemente un método que permita una manipulación genética precisa y un fenotipado cardíaco de alta resolución.
El regulador de la dinámica de actina que inhibe la proteína de cierre (CRACD), también conocido como KIAA1211, es un regulador de la polimerización de actina predominantemente localizado en el citosol que desempeña un papel fundamental en la dinámica del citoesqueleto6. Regula positivamente la polimerización de actina al unirse a las proteínas de cierre de actina (CAPZA1, CAPZA2, CAPZB) e impedir que se unan a los extremos punta de los filamentos de actina7. En los tejidos epiteliales, CRACD desempeña un papel crítico en el mantenimiento de la morfología celular y la transducción de señales al preservar la integridad del citoesqueleto de actina8,9. En células tumorales, su desregulación se asocia con una mayor metástasis y proliferación celular6,10. El papel de CRACD en el corazón aún no se comprende completamente. Estudios sobre el transcriptoma cardíaco y de intervención experimental muestran que la expresión del gen Cracd responde al estrés patológico y podría regular genes relacionados con la dinámica del citoesqueleto durante la remodelación ventricular9,11. Además, su proteína inhibidora CapZ ha estado estrechamente relacionada con la patología cardíaca: la fosforilación de CapZ regula el crecimiento de los miofibrillas durante la hipertrofia inducida por fenilefrina12. Nuestra investigación previa indica que una leve disminución de CRACD confiere protección contra el daño miocárdico y preserva la contractilidad del mionofilamento tras una isquemia aguda13. Estos hallazgos sugieren la posibilidad de que CRACD desempeñe un papel en la remodelación ventricular maladaptativa tras un infarto de miocardio (MI). Sin embargo, han faltado estudios sistemáticos in vivo de pérdida de función que prueben si la deficiencia de Cracd modula la remodelación post-MI, principalmente debido a la ausencia de un protocolo validado paso a paso para generar y fenotipar un ratón deficiente en Cracd bajo estrés isquémico.
Existen varios enfoques para generar ratones knockout constitutivos. La recombinación homóloga tradicional en células madre embrionarias (ES) es precisa, pero costosa, lenta (12–18 meses) y limitada a ciertas cepas de ratón14. La mutagénesis con ENU (N-etil-N-nitrosourea) produce mutaciones puntuales aleatorias que requieren retrocruzamientos y secuenciación extensos15. En contraste, CRISPR/Cas9 ofrece ventajas prácticas distintas para este estudio: (i) la inyección directa en cigotos acorta el tiempo a 4–6 meses; (ii) permite la eliminación de un fragmento genómico grande (3153 pb) para asegurar la pérdida completa de función; (iii) funciona directamente sobre el fondo genético C57BL/6N sin necesidad de conversión de cepa; y (iv) evita el uso de un marcador seleccionable, minimizando interferencias transcripcionales no deseadas. Por lo tanto, CRISPR/Cas9 es la opción más eficiente para generar una línea deficiente en Cracd adecuada para fenotipado cardiovascular de rutina. Esta tecnología se ha utilizado ampliamente para realizar estudios precisos in vivo de pérdida de función16,17.
La imagen de deformación mediante seguimiento de moteado es una técnica de posprocesamiento que sigue el movimiento de los moteados acústicos naturales dentro del miocardio cuadro por cuadro, lo que permite el cálculo de parámetros de deformación miocárdica como la deformación (cambio fraccional en longitud) y la velocidad de deformación (tasa de deformación)18. A diferencia de la ecocardiografía en modo M convencional o bidimensional, que proporciona índices funcionales globales (fracción de eyección, acortamiento fraccional, diámetro interno del ventrículo izquierdo) y es relativamente insensible a las anomalías regionales del movimiento de la pared, la imagen de deformación puede cuantificar la función contráctil segmentaria. Esto es particularmente importante en el período temprano posterinfarto, donde la hipercinesia compensatoria de los segmentos no infartados puede preservar la fracción de eyección global a pesar de una disfunción regional significativa. El seguimiento de moteado ofrece varias ventajas sobre los puntos finales estándar: proporciona valores segmentarios de deformación y velocidad de deformación, desplazamiento y velocidad, detectando así cambios subclínicos sutiles19; puede identificar la disincronía y los déficits contráctiles iniciales antes de que ocurra la remodelación irreversible; y examina directamente la subendocardio, la capa más vulnerable a la isquemia20. En este estudio, CRACD es un regulador del citoesqueleto que podría influir en la contractilidad de las miofibras a nivel microscópico. Las mediciones convencionales basadas en la cavidad podrían pasar fácilmente por alto tales efectos mecánicos locales. Por lo tanto, la integración del análisis mediante seguimiento de moteado en este protocolo mejora la capacidad de detectar los efectos protectores tempranos de la deficiencia de Cracd. En consecuencia, integrar el seguimiento de moteado en este protocolo proporciona una herramienta sensible y cuantitativa para evaluar la remodelación posterinfarto, especialmente durante la primera semana tras el infarto de miocardio, cuando emergen la dilatación temprana y la disfunción contráctil21,22.
Este protocolo está diseñado para investigadores que estudian el impacto funcional de una deleción génica específica en la remodelación aguda (7 días) posterior al IAM, utilizando una combinación de ratones knockout constitutivos y técnicas de imagen de alta resolución. Es apropiado para estudios generadores de hipótesis en los que se acepte la pérdida global del gen diana y el punto final principal sea la evaluación de la función sistólica temprana y los cambios estructurales. Sin embargo, deben considerarse varias limitaciones. Primero, el ratón deficiente en Cracd es un knockout global; por lo tanto, los efectos cardioprotectores observados no pueden atribuirse exclusivamente a la pérdida de CRACD en los cardiomiocitos, ya que las contribuciones sistémicas también podrían desempeñar un papel. Serán necesarios estudios futuros que utilicen estrategias de knockout condicional para lograr una deleción específica del corazón. Segundo, el protocolo se centra en un único punto temporal (día 7) y no aborda la remodelación crónica ni la progresión de la IC. Serán necesarios estudios longitudinales más allá de la fase aguda. Tercero, el análisis mediante seguimiento de puntos (speckle-tracking) requiere imágenes de alta calidad (bordes endocárdicos bien definidos) y software especializado, que puede no estar disponible en todas las instalaciones centrales. A pesar de estas limitaciones, el protocolo proporciona una plataforma robusta y reproducible para la caracterización funcional inicial de genes implicados en la remodelación cardíaca post-IAM.
Este estudio tuvo como objetivo utilizar el sistema CRISPR/Cas9 para generar y validar un modelo murino deficiente en Cracd (C57BL/6N-Cracdem1 (c.538-83 a c.3352+255 del)) con el fin de investigar el impacto de la deficiencia de Cracd en el remodelado cardíaco post-infarto de miocardio (IM) y en el movimiento de la pared ventricular. Se indujo un infarto de miocardio (IM) tanto en ratones de tipo silvestre (WT, C57BL/6N) como en ratones deficientes en Cracd, y se realizaron evaluaciones exhaustivas una semana después del IM. Las evaluaciones incluyeron parámetros ecocardiográficos convencionales, análisis de deformación por seguimiento de puntos (speckle-tracking), y evaluación histopatológica. Nos enfocamos específicamente en la fase temprana posterior al IM (día 7) para captar los eventos iniciales de remodelado y determinar si la deficiencia de Cracd afecta la dilatación ventricular y la función sistólica durante la fase aguda del IM. Se espera que los hallazgos proporcionen información valiosa sobre el papel de CRACD en la modulación del remodelado cardíaco adverso tras un infarto de miocardio.
Protocolo
All animal experiments were approved by the Institutional Animal Care and Use Committee of the Guangdong Institute of Biotechnology (Approval No. IACUC2025179). The study utilized 20 SPF Cracd-deficient and 20 age- and weight-matched WT mice. All mice were 10–12 weeks old and weighed 20–25 g. All male animals were housed in an AAALAC-accredited facility (License No. SYXK (Yue) 2016-0122) at the Guangdong Institute of Biotechnology (Guangdong Laboratory Animals Monitoring Institute). The housing environment was maintained at 22–25 °C with 50–70% relative humidity under a 12 h light/12 h dark cycle.
1. Generation of Cracd-deficient mice using CRISPR/Cas9
- Use CRISPR/Cas9 gene editing technology to generate Cracd-deficient mice on a C57BL/6N background. Delete the genomic sequence from c.538-83 to c.3352+255 (partial intron 5 to intron 6) of Cracd by homology-directed repair.
NOTE: The mouse Cracd gene (NCBI RefSeq: NM_001163793.1; Ensembl: ENSMUSG00000036377) is located on chromosome 5 and contains 9 exons, with the ATG start codon in exon 2 and the TAA stop codon in exon 9. - Design the sequence of gRNA targeting vector and donor oligonucleotide (with targeting sequence flanked by 120 bp homologous sequences combined on both sides).
- Log in to the NCBI website, select the Primer-BLAST function, and design PCR primers for genotyping.
- Paste the NCBI reference sequence number of Cracd (NM_001163793.1) into the PCR template field, specify the exon range for amplification, and click “Get Primers” to retrieve multiple pairs of candidate primers for PCR-based detection of the deletion and wild-type alleles.
- Design single-guide RNAs (gRNAs) to target sites flanking the intended deletion interval in the Cracd gene.
- Select four gRNA sequences (20 nt upstream of the PAM) using online CRISPR design tools.
- To minimize potential off-target effects, score the candidate gRNAs with CRISPRater and select the two optimal sequences (including the NGG PAM).
NOTE: Example selected sequences:
gRNA-A1: CGGCGCTCTTAACATCCAGAGGG (score: 0.71)
gRNA-A2: CCCTTCAGTCTGGGTAGTAGAGG (score: 0.71)
Accept gRNAs with a CRISPRater score ≥ 0.5. For in vitro validation, accept gRNAs with > 50% cleavage efficiency in a Cas9/gRNA target efficiency detection kit.
- Design a single-stranded donor oligonucleotide to promote efficient joining of the intended breakpoints. Example donor sequence: TTAACCATCAACGGGCCGCTGCAAGGGCTGCTGT
GTCTATA CTCAGGACCACCTGCCCTCTAGAGGCAGGAAGGT
AGAGTTCCAAGCTCTGCTGTGCTAGGTTAAATGCAACTTAACATC. - Co-inject Cas9 mRNA, gRNA and donor oligonucleotide into fertilized eggs to generate Cracd-deficient mice. Prepare Cas9 mRNA and gRNA by in vitro transcription.
- Preparation of gRNA.
- Transcribe gRNAs in vitro from DNA templates using the MEGAshortscript™ T7 transcription kit (see Table of Materials) following the manufacturer's protocol.
- Purify the transcribed gRNAs using an RNA purification kit (see Table of Materials) and elute them in RNase-free water.
- Assess gRNA cleavage activity using an in vitro Cas9/gRNA target efficiency detection kit (see Table of Materials).
- Perform all RNA preparation steps on ice using RNase‑free consumables (pipette tips, tubes, water). Keep RNA samples on ice at all times to prevent degradation.
- To perform the cleavage assay: mix the transcribed gRNA (25 ng/µL) with recombinant Cas9 protein (50 ng/µL) and a PCR-amplified DNA fragment containing the target sequence (50 ng).
- Incubate the reaction at 37 °C for 30 min.
- Run the products on a 2% agarose gel to visualize uncleaved and cleaved bands.
- Calculate cleavage efficiency as the ratio of cleaved band intensity to total (cleaved + uncleaved) band intensity.
- Accept gRNAs with > 50% cleavage efficiency.
- Preparation of Cas9 mRNA.
- Thaw the reagents from the T7 ARCA mRNA Kit (see Table of Materials).
- At room temperature, combine 10 µL of 2× ARCA/NTP mix, 1 µL of template DNA, 2 µL of T7 RNA polymerase mix, and nuclease-free water to 20 µL.
- Mix thoroughly, pulse-spin in a microfuge (5 s at 5000 × g), and incubate at 37 °C for 30 min.
- Remove the template DNA by adding 2 µL of DNase I (1 U/µL), mix well, and incubate at 37 °C for 15 min to obtain Cas9 mRNA. Optionally add 1 µL of RNase inhibitor (40 U/µL) (see Table of Materials) to the reaction to prevent RNA degradation.
- Perform all steps on ice with RNase‑free consumables. Keep the Cas9 mRNA on ice until use.
- Superovulate 4-week-old C57BL/6N female mice by intraperitoneal injection of 5 IU of pregnant mare serum gonadotropin (PMSG), followed 48 h later by 5 IU of human chorionic gonadotropin (hCG).
CAUTION: PMSG and hCG are hormones that may cause skin sensitization. Wear gloves and dispose of needles in a sharps container. - Approximately 14–18 h after hCG injection, euthanize the C57BL/6N female mice and one 8–12-week-old C57BL/6N male mouse by cervical dislocation. Collect oocytes from the oviducts of the females and sperm from the cauda epididymis of the male.
CAUTION: Euthanasia must be performed in accordance with institutional guidelines. Cervical dislocation should only be performed by trained personnel. - Capacitate the sperm in capacitation medium (see Table of Materials).
- Add a small volume of the sperm suspension to the oocytes for in vitro fertilization and co-culture for 3–4 h at 37 °C to obtain fertilized zygotes.
- Dilute the transcribed gRNA and Cas9 mRNA with RNase-free water to working concentrations (typically 25 ng/µL for gRNA and 50 ng/µL for Cas9 mRNA) and donor oligonucleotide at 10 ng/µL.
- Microinject 1–2 pL of the mixture into the cytoplasm of fertilized zygotes using a microinjection system (see Table of Materials).
- Identify healthy zygotes by the presence of two distinct pronuclei and an intact polar body under a stereomicroscope.
- Transplant 300 healthy fertilized zygotes into the oviducts of pseudopregnant female mice that have been mated with vasectomized males.
NOTE: This results in the generation of 2 positive founder mice (F0). - Use RNase‑free water and ice‑cold conditions during dilution to maintain RNA integrity.
- Identify F0 mice by PCR genotyping of tail biopsies (see section 1.6).
- Breed F0 founders with WT mice to generate F1 heterozygous offspring, to obtain germline transmission of the deletion.
- Intercross heterozygous F1 mice to produce F2 homozygous Cracd-deficient mice.
- Preparation of gRNA.
- Genotype by Polymerase Chain Reaction (PCR)
NOTE: The following protocol uses a commercial TIANamp Genomic DNA Kit (see Table of Materials). Buffer GL is the lysis buffer, Buffer GB is the binding buffer, and Buffer WA and Buffer WB are wash buffers.- Place approximately 2–5 mm of mouse tail tissue in a microcentrifuge tube containing 180 µL of Buffer GL, 20 µL of Proteinase K (20 mg/mL stock solution), and 10 µL of RNase A (10 mg/mL stock solution).
- Incubate the sample at 56 °C overnight to digest the tissue.
- Centrifuge the tube at 13800 × g for 2 min at room temperature to pellet tissue debris and transfer the supernatant to a new tube.
- Add 200 µL of Buffer GB and 200 µL of 100% ethanol to the supernatant, mix thoroughly, and apply the mixture to a spin column placed in a collection tube.
- Centrifuge at 13800 × g for 2 min at room temperature and discard the flow-through.
- Add 500 µL of Buffer WA to the column, centrifuge at 13800 × g for 1 min at room temperature and discard the flow-through.
- Carefully add 700 µL of Buffer WB (wash buffer containing ethanol, pre-mixed with 100% ethanol) to the spin column, centrifuge at 13800 × g for 1 min at room temperature and discard the flow-through.
- Apply Buffer WB to the inner wall of the column to wash residual salts.
- Repeat step 1.6.5 once, then transfer the column into a new collection tube and centrifuge at 13800 × g for 2 min at room temperature to dry the membrane and remove residual ethanol.
- Place the column into a new 1.5 mL microcentrifuge tube. Add 50–200 µL of sterilized water or elution buffer (preheated to 65 °C) to the center of the membrane, incubate for 5 min.
- Centrifuge the column at 13800 × g for 2 min at room temperature to elute the DNA.
- To increase DNA yield, either reapply the flow-through to the membrane or add an additional 50–200 µL of sterilized water, incubate for 5 min.
- Perform a final centrifugation at 13800 × g for 2 min.
NOTE: Expect DNA yield of 50–200 ng/µL from tail tissue; A260/A280 ratio of 1.8–2.0 indicates pure DNA.
- Place approximately 2–5 mm of mouse tail tissue in a microcentrifuge tube containing 180 µL of Buffer GL, 20 µL of Proteinase K (20 mg/mL stock solution), and 10 µL of RNase A (10 mg/mL stock solution).
- Genotyping by multiplex PCR using three primers in a single reaction.
- Design three primers to distinguish WT, heterozygous, and homozygous genotypes in one PCR reaction: Forward primer F1 (5’-CAGAAGTCATAGCAGCAAGGCAG-3’, binds upstream of the deletion), Forward primer F2 (5’-GAGGGAATTGAGAGGGAGCC-3’, binds within the deleted region, present only in the WT allele), and Reverse primer R1 (5’-GCCAATTTAGCTGCTTCAAATGTTC-3’, common reverse primer downstream of the deletion).
NOTE: The targeted allele generates a 421 bp amplicon (F1 + R1) only when the deletion is present; the WT allele generates a 357 bp amplicon (F2 + R1) only when the intact allele is present. - Set up the PCR reaction in a 25 µL total volume containing 50–100 ng genomic DNA, 0.2 µM of each primer (F1, F2, and R1), 200 µM dNTPs, 1.5 mM MgCl₂, and 1 U Taq DNA polymerase (see Table of Materials).
- Use the following thermocycling program: initial denaturation at 95 °C for 3 min; 35 cycles of denaturation at 95 °C for 15 s, annealing at 60°C for 15 s, and extension at 72 °C for 25 s; and a final extension at 72 °C for 5 min.
- Separate the PCR products by 1–2% agarose gel electrophoresis (120 V, 30 min) in 1× TAE buffer.
- Genotype interpretation based on band pattern: WT shows only a 357 bp band (F2+R1); Heterozygous shows both 421 bp (F1+R1) and 357 bp (F2+R1) bands; Homozygous shows only a 421 bp band (F1+R1).
- Design three primers to distinguish WT, heterozygous, and homozygous genotypes in one PCR reaction: Forward primer F1 (5’-CAGAAGTCATAGCAGCAAGGCAG-3’, binds upstream of the deletion), Forward primer F2 (5’-GAGGGAATTGAGAGGGAGCC-3’, binds within the deleted region, present only in the WT allele), and Reverse primer R1 (5’-GCCAATTTAGCTGCTTCAAATGTTC-3’, common reverse primer downstream of the deletion).
2. Myocardial infarction model establishment
- Anesthetize the mice via inhalation of 3% isoflurane (delivered in 100% oxygen at 1 L/min), place them in a supine position on a surgical platform, and confirm deep anesthesia by the absence of pedal withdrawal reflex.
CAUTION: Isoflurane is a volatile anesthetic. Use only in a well-ventilated area or under a fume hood to avoid inhalation. - Perform orotracheal intubation using a 20-gauge intravenous catheter sheath. Apply ophthalmic ointment to both eyes to prevent corneal drying during surgery.
- Connect the tube to a mechanical ventilator upon successful intubation to maintain ventilation and anesthesia with 2% isoflurane.
NOTE: Successful intubation is confirmed by visible chest movements synchronized with the ventilator.
- Connect the tube to a mechanical ventilator upon successful intubation to maintain ventilation and anesthesia with 2% isoflurane.
- Remove hair from the anterior chest with depilatory cream. Disinfect the surgical area by applying povidone-iodine and 70% alcohol in a circular motion for multiple times, starting from the center and moving outward.
- After fully exposing the skin, make a 1–1.5 cm incision in the left chest wall between the 2nd and 3rd intercostal spaces to open the thoracic cavity.
- Incise the pericardium to fully expose the heart.
CAUTION: Surgical procedures must be performed under sterile conditions. Use appropriate personal protective equipment (PPE), including gloves and a surgical mask.
- Using the inferior border of the left auricle as a landmark, pass a 7–0 atraumatic suture needle beneath the left anterior descending coronary artery (LAD) approximately 2–3 mm distal to its origin.
- Pass the needle to a depth of approximately 0.5–1 mm and tighten the ligature slowly to avoid myocardial tearing.
- Confirm successful occlusion by observing pallor (whitening) of the left ventricular anterior wall distal to the ligation site within 30 s.
- In sham-operated controls, open the chest and pass the suture beneath the coronary artery without tying the knot.
- After establishing the model, sequentially suture the ribs (4-0 absorbable suture, simple interrupted pattern) and skin (4-0 absorbable suture, continuous pattern) to close the thoracic cavity. Remove the endotracheal tube once the mouse resumes stable spontaneous breathing.
- Place mice on a heating pad (37 °C) until fully conscious.
- Administer postoperative analgesia (e.g., buprenorphine 0.05–0.1 mg/kg, subcutaneously, every 12 h for 48 h) according to institutional IACUC guidelines and closely monitor the postoperative health status for several days.
NOTE: Monitor for signs of distress (hunched posture, ruffled fur, reduced mobility, weight loss > 20%).
- Administer postoperative analgesia (e.g., buprenorphine 0.05–0.1 mg/kg, subcutaneously, every 12 h for 48 h) according to institutional IACUC guidelines and closely monitor the postoperative health status for several days.
- Mortality and exclusion criteria.
- Record the number of mice that die within the first 7 days after MI surgery.
NOTE: In a typical cohort, expect a mortality rate of approximately 10–20% by postoperative day 7, with no significant difference between WT and Cracd‑deficient mice. Common causes of death include extensive infarction leading to acute heart failure, surgical bleeding, or pneumothorax. Exclude any mouse with persistent arrhythmia (heart rate < 350 bpm) or signs of severe distress (e.g., hunched posture, ruffled fur, weight loss > 20%) from subsequent echocardiographic and histological analyses. For sham‑operated mice, mortality should be < 5%.
- Record the number of mice that die within the first 7 days after MI surgery.
3. Echocardiographic assessment
- Animal Preparation and Anesthesia
- Power on the high-resolution small animal ultrasound imaging system (see Table of Materials) and its integrated heated stage.
- Ensure that the appropriate high-frequency transducer is securely connected to the mounting apparatus following the manufacturer’s instructions. Set the temperature of the heated stage to 37 °C and allow it to stabilize.
- Place mice in an induction chamber and anesthetize them with 3% isoflurane in oxygen (1–2 L/min) until the pedal withdrawal reflex is absent. Transfer anesthetized mice to the heated platform in a supine position.
- Maintain anesthesia with 1–1.5% isoflurane delivered via a nose cone, adjusting to maintain heart rate between 450–550 beats per min.
- Apply ophthalmic ointment to both eyes to prevent corneal drying.
- Shave the thoracic region, evenly apply depilatory cream for no longer than 3 min, then remove the depilatory cream thoroughly with wet gauze.
- Rinse the skin gently with warm saline if necessary and dry the area. Attach surface ECG electrodes to the limbs using electrode gel at the contact sites and secure them with tape.
NOTE: Confirm stable ECG and heart rate within 450–550 bpm before proceeding to ultrasound imaging.
- Power on the high-resolution small animal ultrasound imaging system (see Table of Materials) and its integrated heated stage.
- Conventional Echocardiography Image Acquisition
- Position the mouse in a horizontal, supine posture on the heated stage, with a slight leftward tilt if needed to optimize cardiac imaging.
- Apply a generous amount of pre-warmed ultrasound coupling gel to the hairless left precordial region, avoiding air bubbles.
- Place the transducer gently on the chest wall at the left parasternal position. Adjust its orientation so that the index mark points toward the mouse’s right shoulder and fine-tune the angle and pressure to optimize image quality.
- Switch to B-mode (two-dimensional) imaging, adjust depth, focus zone, and frame rate to obtain a clear parasternal long-axis view of the left ventricle. Acceptable image quality requires clear visualization of the endocardial border with no dropouts.
- Once the heart rate stabilizes (450–550 bpm), acquire three separate parasternal long-axis B-mode cine loops, each containing at least 3–5 consecutive cardiac cycles.
- Save each loop by pressing “Cine Store”, and store representative still frames using “Frame Store”.
- From the long‑axis view, rotate the transducer 90° clockwise to obtain a short‑axis view at the mid‑papillary level.
- Acquire three separate short‑axis B‑mode cine loops (each with ≥ 3–5 cycles).
- Activate M‑mode, position the cursor perpendicular to the interventricular septum and posterior wall, and record three separate M‑mode tracings.
NOTE: Acceptable M‑mode tracings require clear endocardial borders throughout the cardiac cycle.
- Use the VevoLab 3.2.0 software (see Table of Materials) to measure the following parameters from M‑mode tracings according to the American Society of Echocardiography leading‑edge method: interventricular septum thickness at diastole and systole (IVSd, IVSs), left ventricular internal diameter at diastole and systole (LVIDd, LVIDs), and left ventricular posterior wall thickness at diastole and systole (LVPWd, LVPWs).
- Calculate left ventricular ejection fraction (EF) and fractional shortening (FS) using the Teichholz formula: EF (%) = [(LV Vold - LV Vols) / LV Vold] × 100, LV Vold = ((7 / (2.4 + LVIDd)) × LVIDd3), LV Vol;s = ((7 / (2.4 + LVIDs)) × LVIDs3), FS (%) = [(LVIDd – LVIDs) / LVIDd] × 100.
NOTE: For each mouse, measurements were averaged from three consecutive cardiac cycles per M‑mode recording, and the average was taken across three separate recordings, resulting in a total of 9 measurements per parameter per mouse.
- Calculate left ventricular ejection fraction (EF) and fractional shortening (FS) using the Teichholz formula: EF (%) = [(LV Vold - LV Vols) / LV Vold] × 100, LV Vold = ((7 / (2.4 + LVIDd)) × LVIDd3), LV Vol;s = ((7 / (2.4 + LVIDs)) × LVIDs3), FS (%) = [(LVIDd – LVIDs) / LVIDd] × 100.
- Position the mouse in a horizontal, supine posture on the heated stage, with a slight leftward tilt if needed to optimize cardiac imaging.
- Speckle-Tracking Strain Analysis
- Perform speckle-tracking analysis using the dedicated analysis software (VevoStrain module within VevoLab 3.2.0).
- Open a clear parasternal long-axis B-mode cine loop, select "Vevo Strain" to enter the strain analysis mode, retain only complete cardiac cycles, and choose "Long Axis".
- Manually trace the endocardial border at the end‑diastolic frame. After the endocardial border is drawn, the software automatically generates an epicardial border (adjust as needed). Then start the strain analysis and activate the "toggle contour/vector/orbit line/B mode" function to visualize the motion trajectory.
- Assess tracking quality via the colour‑coded mesh: it should appear green, closely follow the endocardial and epicardial borders without jerking, and move synchronously with myocardial contraction/relaxation. If not, manually refine the borders and re‑analyze.
- Activate "Time‑to‑peak analysis" to divide the left ventricle into six segments (basal anterior, mid anterior, apical anterior, apical posterior, mid posterior, basal posterior), with each colour representing an individual segment. Once satisfactory tracking is achieved, export data for wall motion parameters: velocity (cm/s), displacement (cm), strain (%), strain rate (1/s) for both longitudinal and radial.
NOTE: If tracking quality remains poor after three acquisition attempts (e.g., erratic strain curves, or inability to visualise clear motion trajectories), exclude the mouse from strain analysis.
- Perform speckle-tracking analysis using the dedicated analysis software (VevoStrain module within VevoLab 3.2.0).
4. Histopathological analysis
- After echocardiography, administer a lethal dose of isoflurane to deeply anesthetized mice and apply a secondary physical method (e.g., cervical dislocation) according to institutional guidelines.
- Open the thoracic cavity, rapidly harvest the hearts and rinse the hearts gently in cold phosphate-buffered saline (PBS).
CAUTION: Euthanasia must be performed according to institutionally approved protocols.
- Open the thoracic cavity, rapidly harvest the hearts and rinse the hearts gently in cold phosphate-buffered saline (PBS).
- Trim the hearts, remove the great vessels and cut transversely from apex to base into 2–3 slices (approximately 2–3 mm thick).
- Immerse the tissue slices in 4% paraformaldehyde in PBS and fix them at 4 °C for 12–24 h.
NOTE: Use a volume ratio of fixative to tissue of at least 10:1.
CAUTION: Paraformaldehyde is toxic and a suspected carcinogen. Handle in a fume hood and wear appropriate PPE (gloves, lab coat, safety goggles). Dispose of paraformaldehyde waste as hazardous chemical waste according to institutional guidelines.
- Immerse the tissue slices in 4% paraformaldehyde in PBS and fix them at 4 °C for 12–24 h.
- Dehydrate tissue through a graded ethanol series (50%, 70%, 80%, 95%, 100% ethanol, each for 1 h), clear them in xylene (2 changes, 30 min each), embed them in paraffin, and section them at 4–5 µm thickness using a microtome.
NOTE: Sections should be free of folds and tears.
CAUTION: Xylene is flammable and toxic. Use only in a fume hood and avoid skin contact. Collect xylene waste in a designated container and dispose of as hazardous chemical waste. - Deparaffinize the sections in xylene (2 changes, 5–10 min each), rehydrate them through descending ethanol series (100%, 95%, 80%, 70%, each for 3 min) to water.
- Stain them using standard Hematoxylin and Eosin (H&E) (see Table of Materials) and Masson’s trichrome protocols (see Table of Materials).
CAUTION: Xylene is toxic. Use only in a fume hood and avoid skin contact. Dispose of xylene waste as hazardous material.
- Stain them using standard Hematoxylin and Eosin (H&E) (see Table of Materials) and Masson’s trichrome protocols (see Table of Materials).
- Examine the stained sections under a light microscope (see Table of Materials).
- For quantitative analysis, capture digital images at 4×, 20×, and 40× magnification using a digital camera attached to the microscope. Measure infarct size and fibrotic area using ImageJ.
NOTE: Infarct size (%) = (infarct area / total LV area) × 100; collagen content (%) = (blue-stained area / total myocardial area) × 100.
- For quantitative analysis, capture digital images at 4×, 20×, and 40× magnification using a digital camera attached to the microscope. Measure infarct size and fibrotic area using ImageJ.
Resultados
Generation of Cracd-deficient mice
A heritable mouse model carrying a targeted deficiency in the Cracd gene was generated using CRISPR/Cas9-mediated genome editing (Figure 1A, Figure 1B). To distinguish WT, heterozygous, and homozygous genotypes, a multiplex PCR was performed using three primers (F1, F2, R1) in a single reaction. Mice homozygous for the deletion (Cracd‑deficient) displayed only the 421 bp band, WT mice showed only the 357 bp band (Figure 1C). Sanger sequencing of genomic DNA from Cracd-deficient mice confirmed the predicted deletion in the target gene compared to WT controls (Figure 1D). Western blot analysis further demonstrated a marked reduction in CRACD protein levels in cardiac tissues from Cracd-deficient mice compared with WT controls (Figure 1E). Together, these data confirm the successful establishment of the Cracd-deficient mouse line.
Echocardiography
Echocardiographic assessment on postoperative day 7 revealed pronounced pathological cardiac remodeling in WT mice after MI (WT-MI) compared with sham-operated controls (Figure 2A). The WT-MI group showed thinning of the interventricular septum (Figure 2B, C), significant left ventricular (LV) dilation as reflected by increased LVIDd (Figure 2D) and LVIDs (Figure 2E), and thinning of the posterior wall (Figure 2F, G). These structural alterations were associated with a pronounced decline in global systolic function, as demonstrated by significantly reduced EF (Figure 2H) and FS (Figure 2I). In contrast, Cracd-deficient mice displayed a cardioprotective phenotype following MI. LV dilation was significantly attenuated, with notably smaller LVIDd and LVIDs compared with the WT-MI group. Furthermore, these mice exhibited improved systolic thickening of the posterior wall and maintained significantly higher EF and FS values. These findings indicate that Cracd deficiency effectively attenuates post-infarction LV dilation and preserves global systolic function.
Speckle-tracking strain analysis
Left ventricular myocardial motion and deformation were further evaluated by speckle‑tracking echocardiography using only parasternal long‑axis views (Figure 3A). To ensure data reliability, we defined pragmatic criteria for acceptable output based on the capabilities of the VevoStrain software. Acceptable strain analysis required: (i) a clear parasternal long‑axis view with endocardial borders visible throughout the cardiac cycle; (ii) a stable heart rate between 450–550 bpm during acquisition; (iii) after automatic tracking, the colour‑coded mesh (activated via “toggle contour/vector/orbit line/B mode”) had to closely follow the endocardial and epicardial borders without jerking or losing contact; and (iv) strain curves had to be smooth, show consistent waveforms across segments, and lack sudden spikes or arrhythmic interruptions. Suboptimal output—most commonly erratic strain curves or inability to visualise clear motion trajectories—led to manual adjustment of endocardial or epicardial contours and re‑analysis. If quality remained poor after three attempts, the mouse was excluded. Using these criteria, we obtained reliable strain data in WT‑MI mice and Cracd‑deficient MI mice.
Compared with the sham group, WT-MI mice exhibited significantly reduced radial velocity (Figure 3B) and longitudinal velocity (Figure 3C), as well as radial displacement (Figure 3D) and longitudinal displacement (Figure 3E), indicating impaired global myocardial motion. The absolute values of radial strain (Figure 3F), radial strain rate (Figure 3G), longitudinal strain (Figure 3H), and longitudinal strain rate (Figure 3I) were also markedly decreased, reflecting severely compromised regional myocardial deformation and function. In contrast, Cracd-deficient mice showed significant improvement in these parameters. Compared with the WT-MI group, they displayed better recovery of radial and longitudinal displacements. Furthermore, radial velocity, radial strain, and radial strain rate were maintained at higher levels, while longitudinal strain and longitudinal strain rate were significantly improved. These results suggest that Cracd deficiency not only preserves global systolic function but also enhances regional LV myocardial deformation after MI.
The speckle‑tracking imaging analysis also included visualization of segmental strain distribution and cardiac motion trajectories. Parasternal long‑axis B‑mode images with segmented six regions (BA, MA, AA, AP, MP, BP) and color gradient mapping are displayed in Figure 4A. Cardiac motion trajectories, time‑to‑peak curves for radial and longitudinal strain, parametric distribution maps of strain synchrony, and three‑dimensional reconstructions are presented in Figure 4B. These data further support the functional improvements observed in Cracd‑deficient mice.
Histological examination
To assess the protective effect of Cracd deficiency against MI, histopathological examination was performed on heart sections from WT and Cracd-deficient mice at 7 days post-MI using H&E and Masson's trichrome staining. Whole‑heart longitudinal sections are shown in Figure 5A, with quantitative analysis of infarct size and collagen content presented in Figure 5B and Figure 5C, respectively. High‑magnification views of the infarct zone, border zone, and remote zone are displayed in Figure 5D. In WT-MI hearts, H&E staining showed pronounced left ventricular wall thinning and a well-demarcated infarct zone. Within the infarct region, extensive inflammatory cell infiltration, myocardial necrosis, and marked fibrosis with scar formation were observed. In the border zone, inflammatory infiltration, myocardial necrosis, fibrosis and cardiomyocyte hypertrophy were evident, while the remote zone displayed prominent hypertrophic changes. Corresponding Masson's trichrome staining further demonstrated extensive interstitial fibrosis within both the infarct and border zones of WT hearts following MI. In contrast, Cracd-deficient mice exhibited substantially attenuated pathological alterations, including reduced wall thinning, diminished inflammatory infiltration and myocardial necrosis, less pronounced cardiomyocyte hypertrophy, and markedly decreased interstitial fibrosis compared with WT-MI hearts. These histological findings indicate that Cracd deficiency mitigates post-infarction myocardial damage and adverse remodeling.
Successful protocol execution should yield: (i) a well‑demarcated infarct zone with extensive collagen deposition in WT-MI hearts; (ii) clear cellular morphology without staining artifacts; and (iii) significantly attenuated pathology in Cracd‑deficient MI hearts. Although infarct size may vary with ligation precision, the genotype‑dependent difference is a reliable indicator of successful performance.
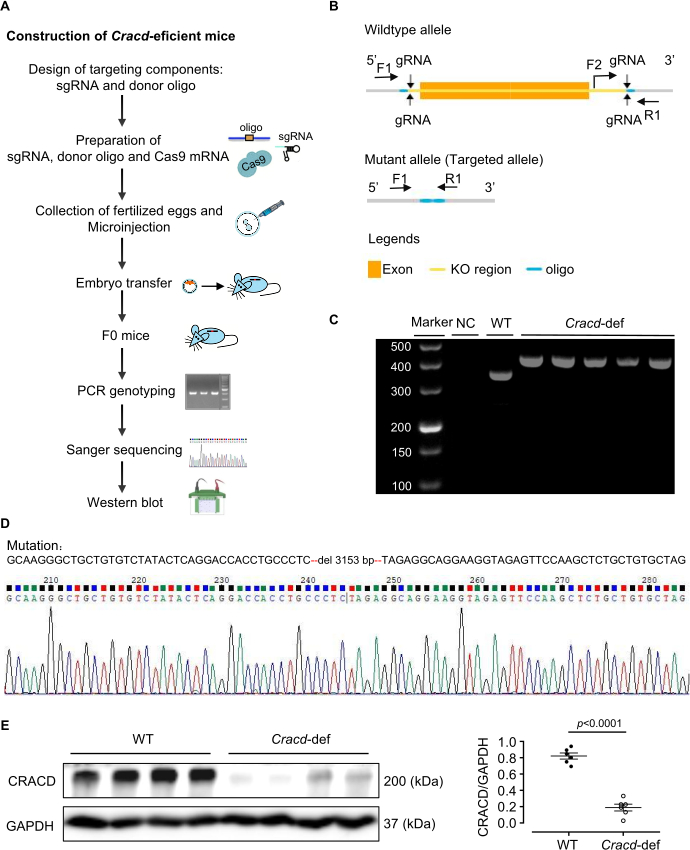
Figure 1: Generation of Cracd-deficient mice. (A) Construction of Cracd-deficient mice. (B) Schematic of the Cracd gene modification strategy. (C) PCR genotyping of tail genomic DNA. WT mice show a single 357 bp band, while homozygous (Cracd‑deficient) mice show a single 421 bp band. (D) Sanger sequencing of genomic DNA confirmed the predicted deletion in the Cracd locus of deficient mice compared to WT controls. (E) Western blot analysis showed significantly reduced CRACD protein levels in the hearts of Cracd-deficient mice compared to WT controls. n = 6 mice per group. Data are presented as mean ± SEM. Statistical significance was calculated with a two-tailed unpaired Student's t-test. Please click here to view a larger version of this figure.
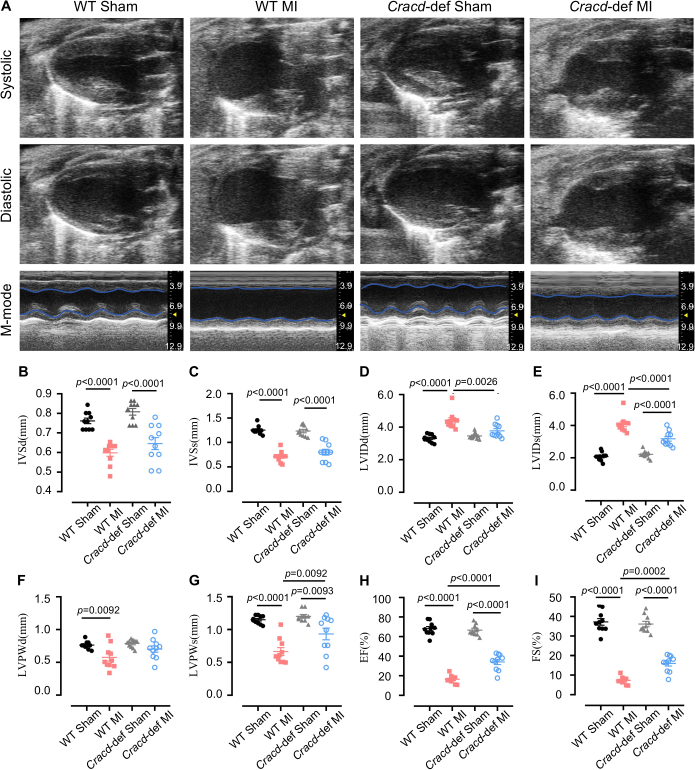
Figure 2: Echocardiographic assessment of cardiac function. (A) Representative B-mode and M-mode echocardiographic images of mouse hearts at diastole and systole. Quantitative analysis of (B) interventricular septum thickness at diastole (IVSd) and (C) systole (IVSs), (D) left ventricular internal diameter at diastole (LVIDd) and (E) systole (LVIDs), (F) left ventricular posterior wall thickness at diastole (LVPWd) and (G) systole (LVPWs), (H) ejection fraction (EF), and (I) fractional shortening (FS). n = 10 mice per group. Data are presented as mean ± SEM. Statistical significance was determined by one-way ANOVA followed by Tukey's multiple comparisons test. Please click here to view a larger version of this figure.
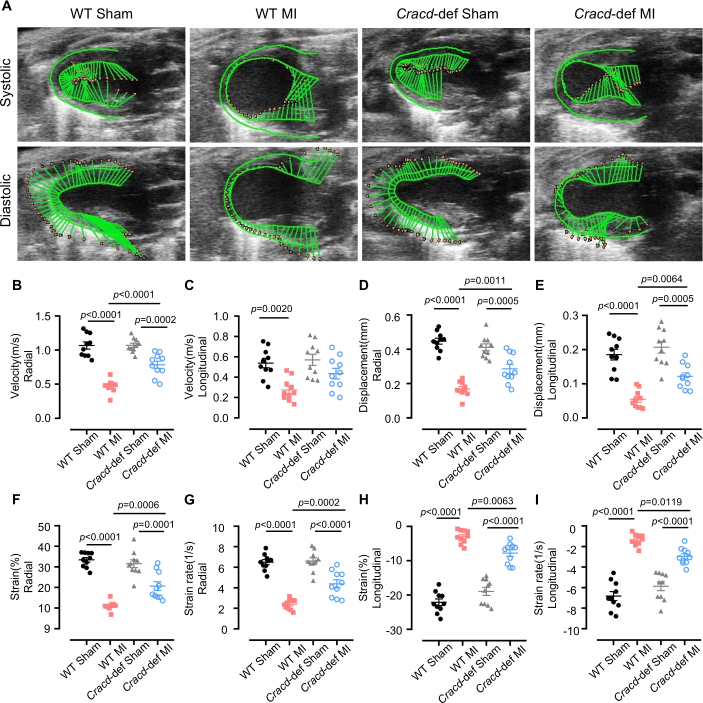
Figure 3: Speckle-tracking strain analysis. (A) Representative images of left ventricular wall motion and deformation at diastole and systole. Quantitative analyses of the following parameters: (B) radial velocity, (C) longitudinal velocity, (D) radial displacement, (E) longitudinal displacement, (F) radial strain, (G) radial strain rate, (H) longitudinal strain, and (I) longitudinal strain rate. n = 10 mice per group. Data are presented as mean ± SEM. Statistical significance was determined by one-way ANOVA followed by Tukey's multiple comparisons test. Please click here to view a larger version of this figure.
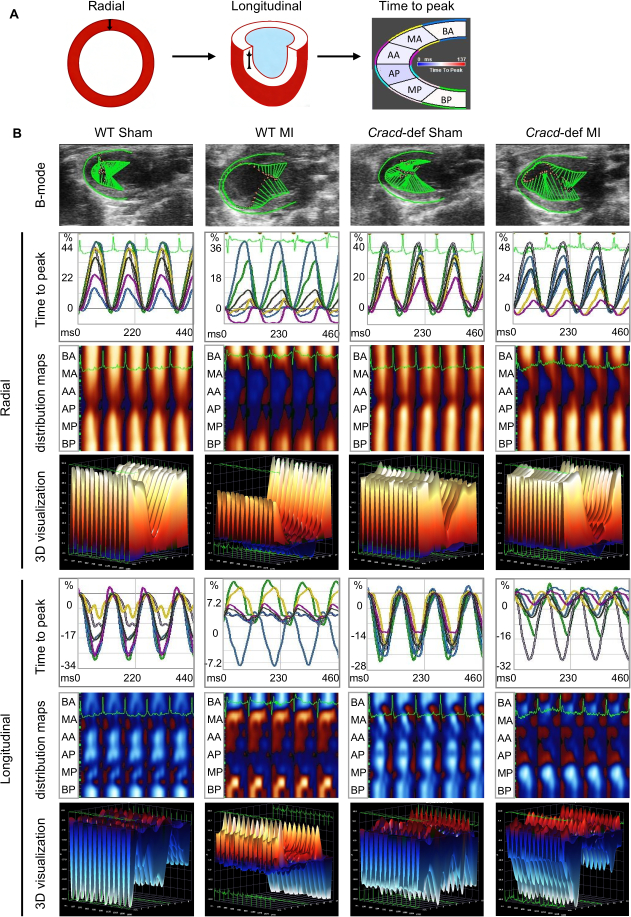
Figure 4: Speckle-tracking imaging in WT-Sham, WT-MI, Cracd-deficient Sham, and Cracd-deficient MI groups at 7 days post-MI. (A) Parasternal long‑axis B‑mode images. Left ventricular wall was segmented into six regions: BA (basal anterior), MA (mid anterior), AA (apical anterior), AP (apical posterior), MP (mid posterior), and BP (basal posterior). Color gradient from blue to red represents increasing strain magnitude. (B) Cardiac motion trajectories; time-to-peak curves for radial and longitudinal strain values along with corresponding peak times. Parametric distribution maps of strain synchrony (blue/red indicate direction: radial – away from/toward center; longitudinal – away from/toward apex). White dots = highest velocity regions, black dots = lowest velocity. Three-dimensional reconstructions (X: time, Y: spatial position, Z: strain magnitude). Please click here to view a larger version of this figure.
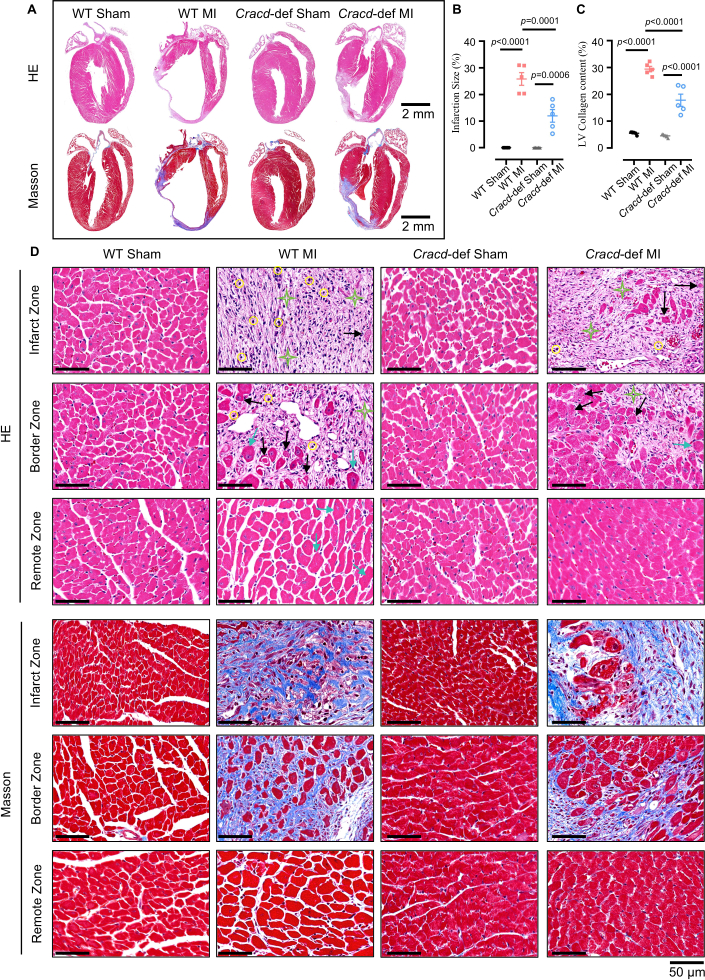
Figure 5: Histopathological analysis of cardiac remodeling after MI. (A) Whole-heart longitudinal sections with H&E and Masson's trichrome staining. Scale bars: 2 mm. (B) Quantitative analysis of infarct size and (C) collagen content. (D) High‑magnification views of infarct zone (IZ), border zone (BZ), and remote zone (RZ). H&E: yellow circles = inflammatory infiltration; black arrows = myocardial necrosis; green stars = fibrosis; blue arrows = hypertrophy. Masson’s trichrome: blue indicates collagen deposition. Scale bar: 50 μm. n = 5 mice per group. Data are presented as mean ± SEM. Statistical significance was determined by one-way ANOVA followed by Tukey's multiple comparisons test. Please click here to view a larger version of this figure.
Discusión
En este estudio, generamos un ratón deficientes en Cracd modificado mediante CRISPR/Cas9 y establecimos un protocolo para fenotiparlo tras el IM mediante ecocardiografía convencional, imagen de deformación por seguimiento de puntos y histología. El protocolo produjo animales knockout con pérdida confirmada de la proteína CRACD. Los ratones deficientes en Cracd mostraron menos dilatación ventricular, mejor FE y fibrosis reducida en comparación con los controles WT tras el IM, lo que confirma la utilidad del modelo para estudiar la remodelación cardíaca.
El éxito de este modelo depende de varios pasos críticos. El diseño de la gRNA y su validación in vitro afectan directamente la eficiencia de la edición en cigotos23. Utilizamos CRISPick o Benchling para seleccionar gRNAs con puntuaciones CRISPRater ≥ 0.5 y luego probamos la eficiencia de corte mediante un ensayo in vitro de Cas9/gRNA. Solo se microinyectan las gRNAs que logran un corte > 50%. La ligadura adecuada de la ADA también es igualmente crucial: la sutura 7‑0 debe pasar a 2–3 mm del origen de la ADA y a una profundidad de 0,5–1 mm para evitar perforar el ventrículo derecho (demasiado profundo) o no lograr la oclusión del vaso (demasiado superficial); el blanqueamiento inmediato de la pared anterior confirma la oclusión. El control de la frecuencia cardíaca durante la ecocardiografía también es esencial24; mantenerla entre 450 y 550 lpm mediante el ajuste de isoflurano (típicamente 1–2%) mejora la reproducibilidad de las mediciones convencionales y de deformación. Finalmente, para el análisis de seguimiento de puntos, la evaluación visual de la malla codificada por colores es fundamental25. La malla debe seguir los bordes miocárdicos sin movimientos bruscos; de lo contrario, se requiere ajuste manual; si la calidad sigue siendo deficiente tras tres intentos, el ratón se excluye.
Aunque se siga el protocolo minuciosamente, pueden surgir ciertas dificultades técnicas. La resolución sistemática de problemas puede solucionar la mayoría de ellas. Tasas bajas de transmisión germinativa (inferiores al 10 %) suelen indicar una integración deficiente del oligonucleótido donador o una actividad débil del ARN guía26. En consecuencia, aumentar el oligo donador a 20 ng/µL, extender los brazos de homología a 120–200 pb y volver a verificar el corte del ARN guía (> 50 %) puede mejorar la transmisión. Una mortalidad elevada tras el IM (superior al 30 %) suele deberse a neumotórax, hemorragia o una infartación extensa27. Por tanto, mantener a los ratones con oxígeno continuo hasta que despierten y utilizar una almohadilla térmica para conservar la temperatura corporal reduce notablemente las tasas de mortalidad. Si la pared anterior no se vuelve pálida tras la ligadura, probablemente se haya identificado incorrectamente la ADA o la sutura sea demasiado superficial. En este caso, localizar nuevamente la ADA (un vaso diagonal de color rojo brillante) y volver a pasar la aguja a una profundidad de 0,5–1 mm, a veces con un microscopio de disección, resuelve este problema. En caso de baja calidad en el seguimiento de puntos, las causas habituales son una baja tasa de cuadros, bordes borrosos o artefactos por movimiento28. Por consiguiente, aumentar la tasa de cuadros, ajustar finamente la ganancia, corregir manualmente el trazado endocárdico y descartar ciclos con arritmias ayuda a mejorar los resultados.
Más allá de estas consideraciones operativas, el método tiene limitaciones evidentes. La eliminación de Cracd es global, por lo que CRACD falta en todos los tejidos. En consecuencia, la protección observada no puede atribuirse exclusivamente a los cardiomiocitos, ya que las contribuciones sistémicas también podrían desempeñar un papel. Sería necesario un knockout condicional para separar funciones específicas según el tipo celular. Otra limitación es el único punto temporal en el día 7; no se observa nada sobre el remodelado crónico. Por lo tanto, deberían añadirse puntos temporales posteriores (4 u 8 semanas) para estudios a largo plazo. La reproducibilidad también se ve afectada por la dependencia de la calidad de la imagen: no todos los sistemas de ultrasonido pueden obtener bordes endocárdicos nítidos, y la experiencia del operador es importante. Por ello, se recomienda que una persona profesionalmente capacitada realice todas las cirugías y mediciones.
Dadas estas limitaciones, es útil comparar nuestro enfoque con estrategias alternativas para estudiar la función génica en la remodelación post-infarto de miocardio. La manipulación génica mediada por AAV y los oligonucleótidos antisentido (ASOs) son dos alternativas comunes29,30. El AAV9 puede lograr una sobreexpresión o silenciamiento transitorio y específico del corazón sin necesidad de cruces genéticos, pero sus limitaciones incluyen el tamaño máximo de empaquetamiento (~4,7 kb), eficiencia de transducción variable y efectos fuera del blanco, lo que constituye una desventaja31. En contraste, nuestro modelo de knockout mediante CRISPR/Cas9 ofrece una pérdida permanente y completa de función, lo cual es ventajoso para estudios a largo plazo. Los ASOs permiten un silenciamiento reversible y dependiente de la dosis con inicio rápido, lo que los hace adecuados para intervenciones agudas; sin embargo, requieren administración repetida y carecen de especificidad tisular32. Por lo tanto, el knockout constitutivo descrito aquí es el más indicado para el descubrimiento inicial y la fenotipificación crónica.
Finalmente, el protocolo puede extenderse más allá del CRACD. El mismo flujo de trabajo —la generación mediante CRISPR/Cas9 de ratones knockout combinada con ecocardiografía, imágenes de deformación y histología— puede evaluar cualquier gen candidato en la remodelación post-infarto de miocardio. El marco de fenotipado también se adapta a otros modelos de enfermedades cardiovasculares, como la constricción aórtica transversa (sobrecarga de presión) o la lesión por isquemia-reperfusión. Además, las muestras de tejido obtenidas mediante este protocolo pueden utilizarse para análisis multi-ómicos (transcriptómica, proteómica, metabolómica) con el fin de descubrir mecanismos moleculares. El modelo deficiente en Cracd puede servir como herramienta para pruebas de fármacos: se pueden evaluar compuestos cuya acción se sospecha que ocurre a través de la vía CRACD. Así, este protocolo proporciona una plataforma adaptable a una amplia gama de estudios mecanicistas y traslacionales en la investigación cardiovascular.
Divulgaciones
Los autores declaran que no tienen intereses en conflicto.
Agradecimientos
Este trabajo fue apoyado por la Fundación Básica y Aplicada de Investigación de Guangdong (2023A1515011278), el Proyecto Autogestionado del Instituto de Investigación de Biotecnología de la Provincia de Guangdong (GDBRI-ZL202602) y el Intercambio y Cooperación Académica China-Canadá sobre Modelos y Patogénesis de Enfermedades Cardiovasculares (MS202500058).
Materiales
| Nombre | Empresa | Número de catálogo | Comentarios |
|---|---|---|---|
| ACRISPR/Cas9 | |||
| Solución de clorhidrato de Trizma | Sigma-Aldrich, USA | T2663 | Utilizada para preparar el tampón de extracción de ADN |
| Proteasa K | Sigma-Aldrich, USA | 539480 | Utilizada para la digestión de cola de ratón |
| Mezcla Green Taq | Vazyme, China | P131 | Utilizada para la amplificación por PCR |
| Agarosa | BioFroxx, Alemania | 1110GR500 | Utilizada para electroforesis en gel de ADN a una concentración del 1–2% |
| Marcador de ADN | Thermo Scientific, USA | SM0242 | Utilizado como escalera de ADN para determinar el tamaño de los productos de PCR |
| Kit TIANamp para ADN Genómico | Tiangen Biotech, China | DP304 | Utilizado para extraer ADN genómico de tejido de cola de ratón |
| Kit de transcripción MEGAshortscript™ T7 | Thermo Scientific, USA | AM1354 | Utilizado para la transcripción in vitro de ARN-guía (gRNA) |
| Kit de purificación de ARN | Zymo Research, USA | R1016 | Utilizado para purificar el ARN-guía transcrito |
| Kit de detección de ARN-guía BeyoCRISPR™ | Beyotime, China | D8412S | Utilizado para evaluar in vitro la actividad de corte del ARN-guía |
| Inhibidor de ARNasa | NEB, USA | M0314 | Utilizado para prevenir la degradación del ARN durante la transcripción in vitro |
| TaKaRa Taq | Takara Bio, Japón | R001A | Utilizado para la genotipificación por PCR del ADN de cola de ratón |
| Medio de preincubación de espermatozoides FERTIUP® para ratón: PM | Cosmo Bio, Japón | KYD-002-EX | Utilizado para la capacitación de espermatozoides antes de la fertilización in vitro |
| Kit T7 ARCA para ARN mensajero | NEB, USA | E2060 | Utilizado para la transcripción in vitro del ARN mensajero de Cas9 |
| Gonadotropina de suero de yegua preñada | MCE, USA | 9002-70-4 | Utilizada para la superovulación, administrada mediante inyección intraperitoneal |
| Gonadotropina coriónica humana | ProSpec, Israel | HOR-250 | Utilizada para inducir la ovulación, administrada mediante inyección intraperitoneal |
| Agua libre de ARNasa | Aladdin, China | R665526 | Utilizada para la disolución de ARN y el montaje de reacciones de PCR |
| Primeros | Sangon Biotech, China | / | Utilizados para la genotipificación |
| Cirugía | |||
| Isóflurano | RWD Life Science, China | R510-22-10 | Utilizado para la inducción y mantenimiento de la anestesia durante la cirugía |
| Cremas depilatorias | Veet, Francia | 1000207 | Aplicadas en la zona torácica para eliminar el vello antes de la cirugía y la ecografía |
| Sutura 7-0 | Lingqiao, China | LQ7022380206 | Utilizada para la ligadura permanente de la arteria coronaria descendente anterior (LAD) |
| Sutura 4-0 | Lingqiao, China | LQ4022380412 | Utilizada para cerrar la incisión cutánea tras la cirugía |
| Ventilador de anestesia | Harvard Apparatus, USA | Tabletop | Utilizado para administrar isóflurano y apoyar la respiración |
| Ventilador para pequeños animales | Taimeng, China | HX-101E | Utilizado para proporcionar ventilación con presión positiva durante la cirugía a tórax abierto |
| Almohadilla calefactora de temperatura constante | TigerGene, USA | TG-TP-GS | Utilizada para mantener la temperatura corporal del ratón durante la cirugía y la recuperación |
| Retractor de costillas | Shenzhen Huayon Biotech, China | LN-18-4101 | Utilizado para separar las costillas y exponer el corazón para la ligadura de la arteria LAD |
| Tijeras | Shenzhen Huayon Biotech, China | 18-0551 | Utilizadas para realizar incisiones en la piel y cortar tejidos |
| Microscopio estereoscópico | Nikon, Japón | SMZ 745 | Utilizado para obtener una vista ampliada durante la cirugía de ligadura de la arteria LAD |
| Portaagujas microscópico | Shenzhen Huayon Biotech, China | 18-2211 | Utilizado para manipular la aguja de sutura 7-0 bajo el microscopio |
| Productos químicos y reactivos | |||
| Agentes acoplantes ultrasónicos | Tianjin Jinya Technology Development, China | TM-100 | Aplicados en el tórax para ecocardiografía, garantizan un buen contacto del transductor |
| Paraformaldehído | Sigma-Aldrich, USA | V900894 | Utilizado para la fijación del tejido cardíaco tras su extracción |
| Xileno | Macklin, China | 1330-20-7 | Utilizado para la eliminación de parafina y la clarificación del tejido antes de la tinción |
| Hematoxilina | Sigma-Aldrich, USA | H3136 | Tinción nuclear, utilizada en la tinción HE |
| Eosina | Sigma-Aldrich, USA | E4009 | Tinción citoplasmática, utilizada en la tinción HE |
| Ponceau S | Sigma-Aldrich, USA | P3504 | Utilizado en la tinción de Masson para la tinción del citoplasma |
| Ácido fosfomolíbdico | Sigma-Aldrich, USA | 221856 | Utilizado en la tinción de Masson como mordiente y para diferenciación |
| Solución de azul de anilina | Sigma-Aldrich, USA | 415049 | Utilizada en la tinción de Masson para la tinción de fibras de colágeno (azul) |
| Anticuerpo contra CRACD | Absea, China | KC-35356 | Anticuerpo primario para detectar la proteína CRACD mediante Western Blot, dilución 1:2000 |
| Anticuerpo contra GAPDH | CST, USA | 2118S | Anticuerpo de control de carga para Western Blot, dilución 1:5000 |
| Etileno | Macklin, China | 64-17-5 | Utilizado para deshidratación y preparación de reactivos (grados 70%, 80%, 95%, 100%) |
| Equipos de laboratorio | |||
| Centrífuga Sorvall™ Legend™ Micro 17 | Thermo Scientific, USA | 75002541 | Utilizada para la preparación rutinaria de muestras |
| Ciclador térmico para PCR | Bio-Rad Laboratories, USA | 1861096 | Utilizado para la amplificación de ADN |
| Sistema de microinyección | Eppendorf, Alemania | 5193000020 | Utilizado para la microinyección de reactivos CRISPR/Cas9 en cigotos |
| Sistema de imagen Vevo 2100 | VisualSonics, Canadá | Vevo2100 | Sistema de imagen de alta frecuencia para evaluación no invasiva de la función y estructura cardíaca tras el infarto de miocardio |
| Microscopio óptico | Leica, Alemania | DM2500 | Utilizado para observar secciones cardíacas teñidas con HE y Masson |
| Software de análisis | |||
| ImageJ | National Institutes of Health, USA | / | Utilizado para análisis de imágenes, incluyendo medición de áreas, cuantificación de señales y procesamiento de imágenes histológicas (tinción HE y Masson) |
| VevoLab 3.2.0 / VevoStrain | VisualSonics, Canadá | / | Software VevoLab para análisis de función cardíaca; módulo VevoStrain utilizado para análisis de deformación miocárdica para evaluar el rendimiento cardíaco tras el infarto de miocardio |
| GraphPad Prism 8 | GraphPad Software, USA | / | Utilizado para análisis estadístico y preparación de gráficos |
Referencias
- Fauconnier J, Meli AC, Thireau J, Roberge S, Shan J, Sassi Y, et al. Ryanodine receptor leak mediated by caspase-8 activation leads to left ventricular injury after myocardial ischemia-reperfusion. Proc. Natl. Acad. Sci. U. S. A. 2011;108(32):13258-63.
- Cohn JN, Ferrari R, Sharpe N. Cardiac remodeling-concepts and clinical implications: a consensus paper from an international forum on cardiac remodeling. J Am Coll Cardiol. 2000.
- Liu D, Tian X, Liu Y, Song H, Cheng X, Zhang X, et al. CREG ameliorates the phenotypic switching of cardiac fibroblasts after myocardial infarction via modulation of CDC42. Cell Death Dis. 2021;12(4).
- Contessotto P, Pandit A. Therapies to prevent post-infarction remodelling: from repair to regeneration. Biomaterials. 2021;275.
- Zhu R, Sun H, Yu K, Zhong Y, Shi H, Wei Y, et al. Interleukin-37 and dendritic cells treated with interleukin-37 plus troponin I ameliorate cardiac remodeling after myocardial infarction. J Am Heart Assoc. 2016;5(12).
- Chang Y, Zhang J, Huo X, Qu X, Xia C, Huang K, et al. Substrate rigidity dictates colorectal tumorigenic cell stemness and metastasis via CRAD-dependent mechanotransduction. Cell Rep. 2022;38(7).
- Seo Y, Jang J, Ko KP, Zou G, Huang Y, Zhang S, et al. Actin dysregulation induces immune evasion via oxidative stress-activated PD-L1 in gastric cancer. bioRxiv. 2024.
- Kim B, Zhang S, Huang Y, Ko KP, Jung YS, Jang J, et al. CRACD loss induces neuroendocrine cell plasticity of lung adenocarcinoma. Cell Rep. 2024;43(6).
- Jung YS, Wang W, Jun S, Zhang J, Srivastava M, Kim MJ, et al. Deregulation of CRAD-controlled cytoskeleton initiates mucinous colorectal cancer via β-catenin. Nat Cell Biol. 2018;20(11):1303-14.
- Liu Z, Cao H, Shi Y, Yang R. KIAA1211 plays an oncogenic role in human non-small cell lung cancer. J Cancer. 2019;10(26):6747-53.
- Snider PL, Snider E, Simmons O, Lilly B, Conway SJ. Analysis of uncharacterized mKiaa1211 expression during mouse development and cardiovascular morphogenesis. J Cardiovasc Dev Dis. 2019;6(2).
- Lin YH, Warren CM, Li J, McKinsey TA, Russell B. Myofibril growth during cardiac hypertrophy is regulated through dual phosphorylation and acetylation of the actin capping protein CapZ. Cell Signal. 2016;28(8):1015-24.
- Yang FH, Pyle WG. Reduced cardiac CapZ protein protects hearts against acute ischemia-reperfusion injury and enhances preconditioning. J Mol Cell Cardiol. 2012;52(3):761-72.
- Tong C, Huang G, Ashton C, Wu H, Yan H, Ying QL. Rapid and cost-effective gene targeting in rat embryonic stem cells by TALENs. J Genet Genomics. 2012;39(6):275-80.
- Cordes SP. N-ethyl-N-nitrosourea mutagenesis: boarding the mouse mutant express. Microbiol Mol Biol Rev. 2005;69(3):426-39.
- Cong L, Ran FA, Cox D, Lin S, Barretto R, Habib N, et al. Multiplex genome engineering using CRISPR/Cas systems. Science. 2013;339(6121):819-23.
- Kanke KL, Rayner RE, Bozik J, Abel E, Venugopalan A, Suu M, et al. Single-stranded DNA with internal base modifications mediates highly efficient knock-in in primary cells using CRISPR-Cas9. Nucleic Acids Res. 2024;52(22):13561-76.
- Mihos CG, Liu JE, Anderson KM, Pernetz MA, O'Driscoll JM, Aurigemma GP, et al. Speckle-tracking strain echocardiography for the assessment of left ventricular structure and function: a scientific statement from the American Heart Association. Circulation. 2025;152(10).
- Garg PK, Biggs ML, Kizer JR, Shah SJ, Psaty B, Carnethon M, et al. Glucose dysregulation and subclinical cardiac dysfunction in older adults: the Cardiovascular Health Study. Cardiovasc Diabetol. 2022;21(1).
- Asanuma T, Fukuta Y, Masuda K, Hioki A, Iwasaki M, Nakatani S. Assessment of myocardial ischemic memory using speckle tracking echocardiography. JACC Cardiovasc Imaging. 2012;5(1):1-11.
- Chong SY, Zharkova O, Yatim SMJM, Wang X, Lim XC, Huang C, et al. Tissue factor cytoplasmic domain exacerbates post-infarct left ventricular remodeling via orchestrating cardiac inflammation and angiogenesis. Theranostics. 2021;11(19):9243-61.
- Hung CL, Verma A, Uno H, Shin SH, Bourgoun M, Hassanein AH, et al. Longitudinal and circumferential strain rate, left ventricular remodeling, and prognosis after myocardial infarction. J Am Coll Cardiol. 2010;56(22):1812-22.
- Labuhn M, Adams FF, Ng M, Knoess S, Schambach A, Charpentier EM, et al. Refined sgRNA efficacy prediction improves large- and small-scale CRISPR-Cas9 applications. Nucleic Acids Res. 2018;46(3):1375-85.
- Wu J, Bu L, Gong H, Jiang G, Li L, Ma H, et al. Effects of heart rate and anesthetic timing on high-resolution echocardiographic assessment under isoflurane anesthesia in mice. J Ultrasound Med. 2010;29(12).
- Voigt JU, Pedrizzetti G, Lysyansky P, Marwick TH, Houle H, Baumann R, et al. Definitions for a common standard for 2D speckle tracking echocardiography: consensus document of the EACVI/ASE/Industry Task Force to standardize deformation imaging. J Am Soc Echocardiogr. 2015;28(2):183-93.
- Port F, Chen HM, Lee T, Bullock SL. Optimized CRISPR/Cas tools for efficient germline and somatic genome engineering in Drosophila. Proc Natl Acad Sci U S A. 2014;111(29).
- Gao E, Lei YH, Shang X, Huang ZM, Zuo L, Boucher M, et al. A novel and efficient model of coronary artery ligation and myocardial infarction in the mouse. Circ Res. 2010;107(12):1445-53.
- Rösner A, Barbosa D, Aarsæther E, Kjønås D, Schirmer H, D'Hooge J. The influence of frame rate on two-dimensional speckle-tracking strain measurements: a study on silico-simulated models and images recorded in patients. Eur Heart J Cardiovasc Imaging. 2015;16(10):1137-47.
- Argiro A, Bui Q, Hong KN, Ammirati E, Olivotto I, Adler E. Applications of gene therapy in cardiomyopathies. JACC Heart Fail. 2024;12(2):248-60.
- Micheletti R, Plaisance I, Abraham BJ, Sarre A, Ting CC, Alexanian M, et al. The long noncoding RNA Wisper controls cardiac fibrosis and remodeling. Sci Transl Med. 2017;9(395).
- Wu Z, Yang H, Colosi P. Effect of genome size on AAV vector packaging. Mol Ther. 2010;18(1):80-6.
- Juliano RL. The delivery of therapeutic oligonucleotides. Nucleic Acids Res. 2016;44(14):6518-48.
Reimpresiones y permisos
Este artículo ha sido publicado
Video próximamente