This protocol describes a high-throughput method of enzymatic hydrolysis that utilizes a microplate reader to measure and classify soil phosphorus as P monoesters, P diesters and inorganic P. Up to 96 samples can be measured at one time in a standard laboratory.
Method Article
High-Throughput Measurement and Classification of Organic P in Environmental Samples
In This Article
Summary
Abstract
Many types of organic phosphorus (P) molecules exist in environmental samples1. Traditional P measurements do not detect these organic P compounds since they do not react with colorimetric reagents2,3. Enzymatic hydrolysis (EH) is an emerging method for accurately characterizing organic P forms in environmental samples4,5. This method is only trumped in accuracy by Phosphorus-31 Nuclear Magnetic Resonance Spectroscopy (31P-NMR) -a method that is expensive and requires specialized technical training6. We have adapted an enzymatic hydrolysis method capable of measuring three classes of phosphorus (monoester P, diester P and inorganic P) to a microplate reader system7. This method provides researchers with a fast, accurate, affordable and user-friendly means to measure P species in soils, sediments, manures and, if concentrated, aquatic samples. This is the only high-throughput method for measuring the forms and enzyme-lability of organic P that can be performed in a standard laboratory. The resulting data provides insight to scientists studying system nutrient content and eutrophication potential.
Protocol
1. Phosphorus Extraction
- Prepare a 1L solution of 0.25 M sodium hydroxide (NaOH, 40.00 g/mol) + 0.05 M Ethylenediaminetetraacetic acid (EDTA, 292.24 g/mol).
- Add 30 mL of the NaOH + EDTA solution to 2 g of wet or dried soil/sample in a 50 mL conical tube.
- Incubate with agitation for 16 h at room temperature.
- Centrifuge 3000 xg for 3 minutes.
2. Sample Extract pH Adjustment
- Transfer a 0.1 mL aliquot to a 1.5 mL micro-centrifuge tube.
- Add 0.017 mL of 2.5 M acetic acid, 0.144 mL of 0.4 M acetate buffer (70.5% of sodium acetate [CH3COONa, 82.03 g/mol] and 29.5% of acetic acid, pH 5.0), and 0.739 mL of deionized water.
- The final volume of adjusted extract will be 1 mL and the final pH will be 5.0.
3. Enzyme Stock Solution Preparation
- Prepare 1 L of 0.1 M sodium acetate (CH3COONa, 82.03 g/mol) solution, pH 5.0.
- Prepare 2 x 10 mL acid phosphatase stock solutions in the sodium acetate buffer prepared in step 3.1 such that final concentrations are each 0.5 Units/mL.
Acid phosphatase Type I from Triticum aestivum (wheat germ; GP, generally 0.5 U mg-1 solid, EC 3.1.3.2)
Acid phosphatase Type IV-S from Solanum tuberosum (potato; PP, generally 4.6 U mg-1 solid, EC 3.1.3.2)
* Units of activity are specified by the supplier where 1 Unit is defined as the liberation of 1 micromole of orthophosphate to the solution per hour at 37°C. - Reconstitute lyophilized nuclease P1 (EC 3.1.30.1) from Penicillium citrinum (fungi; NP1, generally 500 U mg-1 solid) in one mL of deionized water-this can now be stored at 4°C for future use.
- Pipette NP1 into one of the 10 mL tubes prepared in step 3.2 such that the final concentration is 2.5 Units/mL NP1; gently mix by inverting several times.
- Centrifuge the two 10 mL enzyme solutions 3000 xg for 30 minutes.
4. P Calibration Curve and Controls
- Prepare 1 L of 1 mM potassium phosphate (K2HPO4, 174.18 g/mol) stock solution.
- Add 1 mL of the 1 mM potassium phosphate stock solution to a 1.5 mL centrifuge tube and perform seven 0.5 mL serial dilutions.
- Discard the first tube so you have 7 dilutions ranging from 20 nmol-0.625 nmol P.
- Transfer 80 μL from each tube in duplicate to rows B - H of a standard 96-well plate.
- Add 80 μL of sodium acetate buffer (section 3.1) to row A of columns 11 and 12-this is the 0 nmol P calibration point.
- Each column 11 and 12 now contains 8 reference samples from 0 nmol to 20 nmol inorganic phosphate.
- Column 10 will contain the following controls:
- Add 40μL PP+GP enzyme solution + 40 μL sodium acetate buffer (section 3.1) to the first three wells in Column 10.
- Add 40 μL PP+GP+NP1 enzyme solution + 40 μL sodium acetate buffer to the next three wells.
- Add 40 μL sodium acetate solution containing 10 nmol glucose-6 phosphate (C6H11Na2O9P • xH2O, 304.1 g/mol) + 40 μL PP+GP enzyme solution to one well and to the final well in Column 10 add sodium acetate solution instead of enzyme solution.
5. Sample + Enzyme Incubation
- Each sample being tested will occupy the first 9 wells in 1 row of a standard 96-well plate.
- Distribute 40 μL of pH-adjusted sample extracts from Section 2 to wells 1-9 in up to 8 rows.
- After all samples have been distributed* use a multichannel pipette to distribute PP+GP enzyme solution to columns 1-3, PP+GP+NP1 to columns
4-6 and sodium acetate buffer (prepared in section 3.1) to columns 7-9.
*This step must be performed rapidly to assure all samples get equivalent incubation time. - Cover the 96-well plate with a lid and incubate samples + enzyme solutions, controls and calibration curve exactly 1 hr at 37°C.
6. Colorimetric Measurement of Released and Background Inorganic P
- Prepare 50 mL of each of the following solutions in deionized water:
Solution A*: 0.1 M ascorbic acid (C6H8O6, 176.12 g/mol) + 0.5M trichloroacetic acid (Cl3CCOOH, 163.39 g/mol)
Solution B: 0.01 M ammonium molybdate ((NH4)2MoO4, 196.01 g/mol)
Solution C: 0.1 M sodium citrate (HOC(COONa)(CH2COONa)2 2H2O, 294.10 g/mol) + 0.2 M sodium arsenate (NaAsO2, 129.91 g/mol) + 5 % glacial acetic acid
(CH3CO2H, 60.05 g/mol) * Solution A must be prepared daily. - Add 25 μL of Solution SDS, 100 μL of Solution A, 20 μL of Solution B and 50 μL and of Solution C to all wells in the 96-well plate. Do this rapidly with a multichannel pipette.
- Cover the plate and incubate 30 minutes at room temperature.
- Measure the absorbance at 850 nm in any tunable micro-plate reader.
7. Classification of P Compounds
- Import raw data into a spreadsheet application (e.g. Microsoft Excel).
- Plot the inorganic phosphorus calibration curve: 0 to 40 nmol P on the x-axis and mean of duplicate absorbance measurements on the y-axis.
- Perform a linear regression and find the equation of the line of best fit.
- Columns 1-3: Directly apply the calibration curve-this is background inorganic P.
- Columns 4-6: Average triplicate sample values and subtract out controls (enzyme solution + background inorganic P) from gross absorbance-this is P derived from hydrolysable P monoesters.
- Columns 7-9: Same as 7.5 except subtract absorbance values from columns 4-6- this is P from hydrolysable P diesters.
- Convert absorbance data to nmol P released by applying the calibration equation.
- nmol P released can be related back to mg P/kg of original soil. Alternatively, assessing proportions of each P class may also be a useful approach for analyzing data.
8. Representative Results:
A quick visual inspection of the 96-well plate after the colorimetric chemistry will offer clues to whether or not the procedure was
performed correctly. The first thing to check is the level of liquid in each well by scanning the side profile of the plate. There should be exactly
275 μL of reagents in all wells. Next, visually inspect the color of triplicate sample wells and duplicate calibration wells. These technical replicate
should be the same shade of blue. Next apply the calibration curve to the two wells containing glucose-6 phosphate and verify they released all 10 nmol
of inorganic P. After total extracted P has been measured using ICP-OES or an alternative method, make sure the total P values calculated using this
protocol do not exceed the amount of P that was extracted.
Note: Careful data management in the spreadsheet will help guard against quantitative errors. You will be dealing with a lot of numbers at once, so creating a template will be time well-spent.
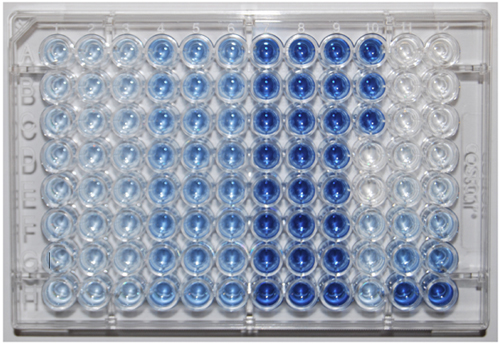
Figure 1. A 96-well plate showing results for 8 samples (rows A-H) and a calibration curve (columns 11 and 12). Controls are in column 10.
Color intensity increase between columns 1-3 and 4-6 is due to hydrolyzed monoester P compounds, between columns 4-6 and 7-9 is due to hydrolyzed diester
P compounds.
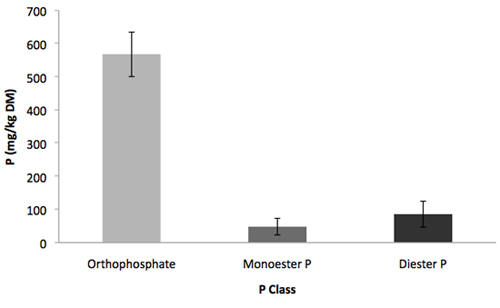
Figure 2. Distribution of P classes in a 0.25 M NaOH-0.05 M EDTA extract of a Vermont soil sample using high-throughput enzymatic hydrolysis. Error bars indicate standard deviation, n = 3.
Discussion
By its very nature, a rapid method using small volumes requires great care. Therefore the most critical steps are those involving pipetting solutions onto the plate. Accurate, and most importantly, consistent pipette technique are essential for the success of this assay.
The NaOH-EDTA extraction will allow most of the P in many samples to be characterized into three classes: orthophosphate, monoester P and diester P. Soils, manures, sediments or any other environmental sample that contains NaOH-EDTA-extractable P can be characterized. P forms in environmental samples are not necessarily stable and this technique will ensure samples are characterized before samples are compromised without needing to employ an army of researchers.
This assay is especially suitable when a large number of samples are to be processed. The reagent needs and space requirements have been scaled down to a manageable level (e.g. 1.5 mL microcentrifuge tubes rather than 50 mL glass flasks). This adaptation also limits waste production.
Disclosures
No conflicts of interest declared.
Acknowledgements
We thank the USGS and the Vermont Water Resources and Lake Studies Center for providing funding.
Materials
| Name | Company | Catalog Number | Comments |
|---|---|---|---|
| NaOH | Sigma-Aldrich | S8045 | |
| EDTA | Sigma-Aldrich | EDS | |
| Glacial Acetic Acid | Sigma-Aldrich | 242853 | |
| Sodium Acetate | Sigma-Aldrich | S2889 | |
| Wheat Acid Phosphatase | Sigma-Aldrich | P3627 | |
| Potato Acid Phosphatase | Sigma-Aldrich | P1146 | |
| Nuclease P1 | Sigma-Aldrich | N8630 | |
| Potassium Phosphate | Sigma-Aldrich | P2222 | |
| Glucose-6 Phosphate | Sigma-Aldrich | G7250 | |
| SDS | Sigma-Aldrich | L4390 | |
| Ascorbic Acid | Sigma-Aldrich | A5960 | |
| TCA | Sigma-Aldrich | T9159 | |
| Ammonium Molybdate | Sigma-Aldrich | A1343 | |
| Sodium Citrate | Sigma-Aldrich | S1804 | |
| Sodium Arsenate | Sigma-Aldrich | S9663 |
References
- Turner, B. L., Frossard, E., Baldwin, D. S. Organic phosphorus in the environment. , Cabi Publishing. Wallingford. (2005).
- Murphy, J., Riley, J. P. A modified single solution method for determination of phosphate in natural waters. Anal. Chim. Acta. 27, 31-36 (1962).
- Dick, W. A., Tabatabai, M. A. Determination of orthophosphate in aqueous solutions containing labile organic and inorganic phosphorus compounds. J. Environ. Qual. 6, 82-85 (1977).
- He, Z., Toor, G. S., Honeycutt, C. W., Sims, J. T. An enzymatic hydrolysis approach for characterizing labile phosphorus forms in dairy manure under mild assay conditions. Bioresour. Technol. 97, 1660-1668 (2006).
- He, Z., Honeycutt, C. W. A modified molybdenum blue method for orthophosphate determination suitable for investigating enzymatic hydrolysis of organic phosphates. Commun. Soil Sci. Plant Anal. 36, 1373-1383 (2005).
- Cade-Menun, B. J. Characterizing phosphorus in environmental and agricultural samples by 31P nuclear magnetic resonance spectroscopy. Talanta. 66, 359-371 (2005).
- Johnson, N. R., Hill, J. E. Phosphorus species composition of poultry manure-amended soil using high-throughput enzymatic hydrolysis. Soil Sci. Soc. Am. J. 74, 1786-1791 (2010).
Reprints and Permissions
