All procedures involving sample collection have been performed in accordance with the institute's IRB guidelines.
NOTE: Recordings from Q175 wild-type (WT) and heterozygotes (HETs) can be performed at any age and sex. Here we studied males and females at an age of 51 to 76 weeks.
1. Injection of the Glutamate Sensor iGluu for Expression in Corticostriatal Axons
- Use the pipette puller (one step mode) to prepare borosilicate glass pipettes for the injection of the virus. After pulling, break the pipette manually to obtain a tip diameter of 30–50 µm. Autoclave the pipette and surgical instruments, including the drill for opening the skull.
- Store the virus AAV9-CaMKIIa.iGluu.WPRE-hGH (7.5 x 10¹³gc/mL) at -80 °C in 10 µL aliquots. If injections are performed shortly after virus production (within 6 months), keep at 5 °C. Before surgery, take out the vial and maintain it at room temperature.
- Fill the glass pipette and remove any bubbles.
- Anesthetize the animal with an intraperitoneal injection of a solution containing 87.5 mg/kg ketamine and 12.5 mg/kg xylazine. Subcutaneously inject 0.25% bupivacain (8 mg/kg) for additional pain relief. Check the depth of anesthesia by monitoring the muscle tone and observing the absence of pain-induced reflexes.
- Shave the skin on the head and sterilize it with 70% alcohol. Fit the mouse into the stereotaxic frame.
- Use a scalpel to remove the skin and a high-speed (38,000 rpm) drill to make a 1.2 mm hole in the bone above the motor cortex.
- Mount the syringe with the attached injection pipette in the holder of a precision manipulator. Insert the vertically oriented pipette into the cortex at 4 different sites. The injection coordinates are, with respect to bregma (in mm): anterior 1.5, lateral 1.56, 1.8, 2.04, 2.28. The depth with respect to dura mater is (in mm): 1.5–1.7.
- Using the injection system, inject 0.3 µL per site of the undiluted virus solution with a velocity of 0.05 µL/min. After each injection, leave the pipette in place for 1 min before withdrawing it slowly (1 mm/min).
- Finish by closing the surgical wound with a nylon suture.
- Leave the mouse for 0.5 to 1 h on a heating pad in a clean cage before returning it to its original cage.
- Maintain the mouse on a 12 h day-night cycle for 6 to 8 weeks before the preparation of acute brain slices.
NOTE: To avoid immune reactions resulting in cell damage and synapse loss, injection of multiple viral constructs must be performed simultaneously or within 2–3 hours after the primary injection. The coordinates for iGluu injection were selected according to the Paxinos and Franklin brain atlas. They correspond to the M1 motor cortex. Immunostaining of injected brains visualized numerous but mostly well isolated axons and axon varicosities in the ipsi- and contralateral striatum and in the contralateral M1 and S1 cortices.
2. Search for Glutamatergic Terminals Expressing the Glutamate Sensor iGluu
- Calibration mode
- Prepare the sCMOS camera and the camera control software with the following settings. On the Readout page set Pixel readout rate: 560 MHz (= fastest readout), Sensitivity/Dynamic Range: bit, Spurious Noise Filter: Yes, Overlap Readout: Yes. On the Binning/ROI page, select Full screen.
- Prepare a glass slide containing a drop of 5 mg/mL Lucifer Yellow (LY) under a cover slip.
- Place the LY slide under a 63x objective, open the laser shutter and perform a serial acquisition using the following settings: Pixel Binning: 1x1, Trigger mode: Internal, Exposure time: Minimal (to be determined).
- Adjust the laser power to produce a fluorescence spot of 4 µm in diameter (the image should not contain saturated pixels).
- To perform a calibration of the laser positioning system, select the following settings in the laser positioning software: Spot-size diameter: 10, Scanning velocity: 43.200 kHz. Click the Start image acquisition button on the right panel. Set Runs: 0, Run delay: 0, and select the Run at TTL option on the Sequence page. Click the Calibrate button on the Calibration page and calibrate the laser control software according instructions shown in the top-left corner of the acquisition screen.
- If the setup uses independent software for camera and laser control, acquire screenshots from the camera acquisition window and send it to the laser control software for a re-calculation of the XY coordinates. If the software is installed on different computers, then use a video grabber to import the image into the laser control software. The laser control software will need the information on the XY scaling factors and offsets. For this purpose, determine the coordinates of the top-left, bottom-left and bottom-right corners of the image within the acquisition window of the laser control program. Calculate the scaling factors according to the following equations: X factor = (X bottom-right – X bottom-left)/2048, X offset = X bottom-left, Y factor = (Y top-left – Y bottom-left)/2048, Y offset = Y bottom-left.
- At the end of the calibration procedure, create a rectangular region of interest (ROI) of 267x460 pixels, move it to the center of the screen and click the Start sequence button.
- Return to the following camera control software settings: Binning: 2x2, Trigger mode: External exposure, Exposure time: Minimal (to be determined).
- Autofluorescence correction mode
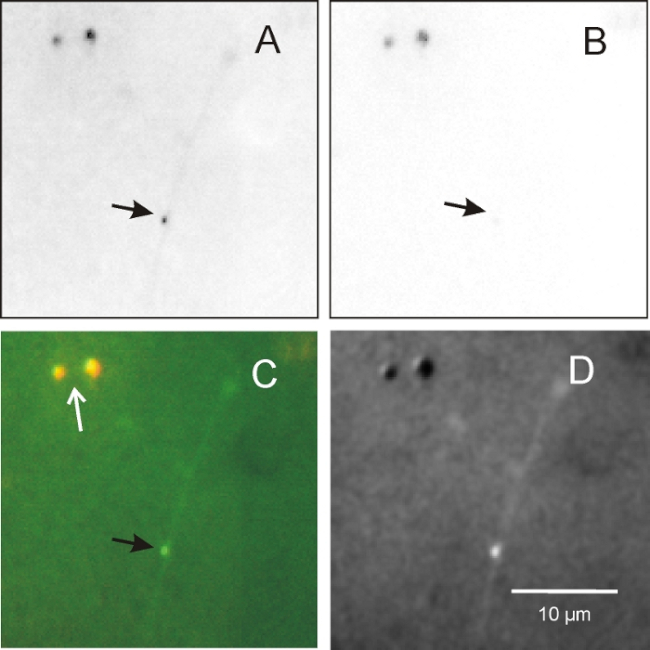
NOTE: The resting level of [Glu] in the environment of active synaptic terminals is typically below 100 nM. Accordingly, any sensor of glutamate, especially a low affinity sensor like iGluu will be rather dim in the absence of synaptic glutamate release. Nevertheless, some iGluu fluorescence can even be detected at rest, but must be distinguished from the tissue autofluorescence. The 473 nm illumination elicits both iGluu fluorescence and autofluorescence (Figure 1A–C). The latter occupies a wide range of wavelengths, while iGluu fluorescence is limited to 480–580 nm (with a maximum at 510 nm). The correction for autofluorescence is based on the acquisition of two images with different high-pass filters.
- Prepare brain slices in advance as described elsewhere. Keep bran slices ready.
- Transfer the slices into the recording chamber, submerging them into oxygenized artificial cerebrospinalfluid (ACSF) containing 125 mM sodium chloride (NaCl), 3 mM potassium chloride (KCl), 1.25 mM di hydrogen sodium phosphate (NaH2PO4), 25 mM sodium bicarbonate (NaHCO3), 2 mM calcium chloride (CaCl2), 1 mM magnesium chloride (MgCl2), 10 mM glucose (pH 7.3, 303 mOsm/L), supplemented with 0.5 mM sodium pyruvate, 2.8 mM sodium ascorbate and 0.005 mM glutathione. Use a flow rate of 1–2 mL/min. Keep the bath temperature at 28–30 °C.
- Locate the dorsal striatum under a 20x water immersion objective. Fix the slices with a nylon grid on a platinum harp to minimize the tissue movement. Switch to the 63x /NA 1.0 water immersion objective. Select filters reflecting light at 473 nm (dichroic mirror) and passing light with wavelengths >510 nm (emission filter).
- Synchronize illumination, stimulation and image acquisition using an Analog-to-Digital (AD)/Digital-to-Analog (DA) (AD/DA) board with the respective control software. Set the trigger program to control acquisition with a laser exposure time of 180 ms and an image acquisition time of 160 ms. Use the laser positioning device to send the laser beam to a predetermined number of points and define the settings for Scanning velocity and Spot size.
- Acquire an image of both autofluorescence and iGluu-positive structures using a high pass filter at 510 nm ("yellow image").
- Acquire an image with autofluorescence alone using a high-pass filter at 600 nm ("red image").
- Scale the red and yellow images, using the mean intensities of the 10 brightest and the 10 darkest pixels to define the range. Perform a subtraction "yellow minus red image" and rescale the subtracted image to generate a standard 8-bit tif file for convenient visualization of the bouton of interest (Figure 1D). It contains the bright pixels from the iGluu-positive structures, grey pixels from the background and dark pixels from structures with autofluorescence.
NOTE: With the given equipment the mean resting fluorescence (F) will be below 700 A.U.
- Bouton search mode
NOTE: iGluu-positive pixels may belong to functionally different elements of the axonal tree, such as axon branches of different order, sites of bifurcation, varicosities after vesicle depletion or fully active varicosities. However, it is almost impossible to identify functional synaptic terminals just by visual inspection. Therefore, each glutamatergic synaptic terminal needs identification by its responsiveness to electrical depolarization. Sites that do not respond to stimulation have to be discarded. The physiological means to induce glutamate release from corticostriatal axons is to elicit an action potential. This can either be achieved by using a channel rhodopsin of appropriate spectral characteristics or by electrical stimulation of an axon visualized by iGluu itself. To avoid accidental opsin activation, we preferred the latter approastep
- Use the micropipette puller (in a four-step mode) to produce stimulation pipettes from borosilicate glass capillaries. The internal tip diameter should be about 1 µm. When filled with ACSF, the electrode resistance should be about 10 MΩ.
- To induce the action potential-dependent release of glutamate from a set of synaptic boutons attached to the same axon, use 63x magnification, the 510 nm emission filter and the subtracted image to place a glass stimulation electrode next to a fluorescent varicosity. Avoid the proximity of additional axons.
- Turn on the stimulator to deliver depolarizing current pulses to the stimulation pipette. Use current intensities around 2 µA (no more than 10 µA).
- Turn on the multi-channel bath application system where one channel delivers the standard bath solution and the other channels deliver the necessary blockers of ion channels, transporters or membrane receptors. Control the flow at the site of recording and then switch to the tetrodotoxin (TTX) channel (bath solution plus 1 µM TTX). After 2–3 min, stimulate the bouton of interest again, but now in the absence of action potential generation. The release is directly due to calcium influx through voltage-depended calcium channels.
- By turning the intensity key on the stimulator, adjust the stimulation current to obtain responses similar to those elicited via action potentials. Typically, the stimulation current would be around 6 µA for a 0.5 ms depolarization.
- For basic testing of the preparation, apply 0.5 mM CdCl2. The presence of this calcium channel blocker glutamate release completely prevents the synaptic glutamate release thereby validating the calcium dependence of the directly evoked glutamate signal.
NOTE: The following general recommendation may help to increase the success rate of single synapse experiments in the striatum. To select glutamatergic synaptic terminals with intact release machinery, a varicosity should: (i) Have a smooth spindle-like shape; (ii) Not be associated with an axon bifurcation; (iii) Be brighter than other structures on the "yellow image"; (iv) Reside in the striatal neuropil rather than in the fiber tracts; (v) Reside on a very thin axon branch; (vi) Not reside within the deeper parts of the slice.
3. Visualization of Glutamate Release and Clearance
- Recording mode
NOTE: After the subtraction of the autofluorescence (step 2.2) and a few initial tests for responsiveness of the bouton of interest (Step 2.3), data acquisition can begin. The responses to electrical activation of glutamate release from single axon terminals can be observed in the image directly (Figure 2), without applying further analysis tools. However, it proved to be very convenient to immediately extract some basic indicators of synapse performance (Figure 3). This information is needed to make decisions on subsequent course of experiment, such as selection of particular terminal types, rapid assessment of HD-related alterations, the number and frequency of trials or drugs to be applied with the superfusion system. It might also be necessary to deal with eventually appearing artifacts. First, the standard settings for data recording is described.
- Using the microscope XY drives, place the tested iGluu-positive bouton close to the viewfield center. Stop the image acquisition with the Abort acquisition button. On the last acquired picture, determine the XY position of the resting bouton center by clicking on it with the left mouse button. The XY coordinates of the set cursor will be shown on the bottom status panel of the acquisition window.
- Using the calibration data (step 2.1.6), calculate the coordinates of the site where the laser beam should be sent for the excitation of the iGluu fluorescence. Use the following equations: X laser = X camera * X factor + X offset, Y laser = Y offset – Y camera * Y factor. While performing this recalculation, pay attention to the vertical or horizontal flip settings of the camera.
- Create a one-point sequence in the laser control software using the calculated coordinates. For this purpose, select Point in the Add to sequence box on the Sequence page of the laser control software. Select 10 µs for the delay to trigger onset and 180 ms for the laser pulse time. Move the mouse to the calculated coordinates and click left button.
- Select the following settings in the laser control software: Runs: 0, Run delay: 0, Sequence: Run at TTL. Then click Start sequence.
- In the camera control software, select the following settings: On the Binning/ROI page, set Image Area: Custom, Pixel Binning: 2x2, Height: 20, Width: 20, Left: X-coordinate of the resting iGluu-positive spot minus 10 px, Bottom: Y-coordinate of the resting iGluu-positive spot minus 10 px, Acquisition Mode: Kinetic Series, Kinetic Series Length: 400, Exposure Time: 0.0003744s (minimal value). With such settings, the acquisition rate will be 2.48 kHz.
- Select Trigger mode: External. Click Take signal in the camera control software. Initiate the experimental protocol laid down for the trigger device.
- Implement the experimental protocol Trial with the following time line: 0 ms – start trial, 1 ms – start laser illumination, 20 ms – start image acquisition with camera, 70 ms – start electrical stimulation 1, 120 – start electrical stimulation 2, 181 ms – end trial (laser and camera off). Thus, during one trial the camera acquires 400 frames with a frequency of 2.48 kHz. See steps 2.3.3 and 2.3.5. for details on electrical stimulation.
- To allow for sufficient recovery of presynaptic vesicle pools, apply the protocol Trial with a repetition frequency of 0.1 Hz or lower.
- Off-line construction of the glutamate transient and rapid assessment of glutamate release and clearance for the identification of pathological synapses
- Turn on the evaluation routines. Here, we use an in-house-written software SynBout v. 3.2. (author: Anton Dvorzhak). The following steps are needed to construct a ΔF/F transient from the pixels with elevated iGluu fluorescence as in the video of Figure 2.
- To determinate the bouton size, calculate the mean and standard deviation (SD) of the ROI fluorescence intensity at rest (F), before the onset of stimulation. Determine and box the area occupied by pixels with F>mean + 3 SD (Figure 3A). Determine a virtual diameter (in µm) assuming a circular form of the supra-threshold area.
- Determine ΔF as the difference between the peak intensity value and F. Plot the stimulating current and ΔF/F against time (Figure 3B). Calculate the SD of ΔF/F at rest (before the onset of stimulation) and the "Peak amplitude". Use pixel with peak amplitude more than 3 SD of ΔF/F to perform monoexponential fitting for the decay from peak. Determine the time constant of decay TauD of ΔF/F.
- To estimate the "Maximal amplitude" at a given synapse, select the pixel with the highest ΔF/F value. It is typically located within or next to the boundaries of the resting bouton iGluu fluorescence. The "Maximal amplitude" would be the best indicator of the glutamate load presented to the clearance machinery of a single synapse.