Telomere and telomerase play essential roles in ageing and tumorigenesis. The goal of this protocol is to show how to generate two murine inducible telomerase knock-in alleles and how to utilize them in the studies of tissue degeneration/regeneration and cancer.
Method Article
Utilizing Murine Inducible Telomerase Alleles in the Studies of Tissue Degeneration/Regeneration and Cancer
In This Article
Summary
Abstract
Telomere dysfunction-induced loss of genome integrity and its associated DNA damage signaling and checkpoint responses are well-established drivers that cause tissue degeneration during ageing. Cancer, with incidence rates greatly increasing with age, is characterized by short telomere lengths and high telomerase activity. To study the roles of telomere dysfunction and telomerase reactivation in ageing and cancer, the protocol shows how to generate two murine inducible telomerase knock-in alleles 4-Hydroxytamoxifen (4-OHT)-inducible TERT-Estrogen Receptor (mTERT-ER) and Lox-Stopper-LoxTERT (LSL-mTERT). The protocol describes the procedures to induce telomere dysfunction and reactivate telomerase activity in mTERT-ER and LSL-mTERT mice in vivo. The representative data show that reactivation of telomerase activity can ameliorate the tissue degenerative phenotypes induced by telomere dysfunction. In order to determine the impact of telomerase reactivation on tumorigenesis, we generated prostate tumor model G4 PB-Cre4 PtenL/L p53L/L LSL-mTERTL/L and thymic T-cell lymphoma model G4 Atm-/- mTERTER/ER. The representative data show that telomerase reactivation in the backdrop of genomic instability induced by telomere dysfunction can greatly enhance tumorigenesis. The protocol also describes the procedures used to isolate neural stem cells (NSCs) from mTERT-ER and LSL-mTERT mice and reactivate telomerase activity in NSCs in vitro. The representative data show that reactivation of telomerase can enhance the self-renewal capability and neurogenesis in vitro. Finally, the protocol describes the procedures for performing telomere FISH (Fluorescence In Situ Hybridization) on both mouse FFPE (Formalin Fixed and Paraffin Embedded) brain tissues and metaphase chromosomes of cultured cells.
Introduction
Telomerase is an enzyme responsible for maintaining telomeres. These are repetitive sequences at the ends of chromosomes that protect their integrity. The core components of telomerase holoenzyme are a reverse transcriptase catalytic subunit (TERT) and an RNA subunit (TERC) that serves as the template for adding the telomeric repeats1,2. While generally suppressed in differentiated somatic cells, telomerase exhibits robust activity and plays important roles in germ cells, cancer cells and stem cells.
mTERC and mTERT knockout mice provide great in vivo model systems to study the functions of telomerase in both stem cells and cancer. The mTERC and mTERT knockout mice (G1) did not show any obvious phenotypes due to the long reserve of telomeres in mice3. However, serially intercrossing mTERC and mTERT knockout mice to late generation (G5-G6) resulted in progressive erosion of telomeres and eventually provoked severe degeneration of highly proliferative tissues4. Late generation (G5-G6) mTERC-/- mice are infertile due to the high rates of apoptosis in testis and germ cell depletion. G5-G6 mTERC-/- mice also exhibit degenerative phenotypes in highly proliferative tissues including bone marrow, intestine and skin due to high rates of apoptosis and defective self-renewal capability in tissue stem/progenitor cell compartments4. Hematopoietic stem cells in the bone marrow of late generation mTERC-/- mice exhibit loss of proliferative potential, compromised self-renewal capability, enhanced apoptosis and, eventually functional exhaustion5,6. Similarly, progressively increased apoptotic bodies in intestinal crypts were observed in each successive generation of G1-G6 mTERC-/- mice7,8. The deleterious effect of dysfunctional telomeres doesn’t seem to be limited to high turnover tissues since both the proliferation of adult neural stem cells in vitro and the neurogenesis in vivo were severely impaired in late generation (G4-G5) mTERC-/- mice9. The role of telomerase in stem cells is further supported by the findings in a rare human genetic disorder dyskeratosis congenita (DKC), which in some ways resembles premature ageing10,11. DKC is caused by mutations in TERC, TERT, and genes that encode dyskerin, a core telomerase subunit, and other dyskerin associated proteins12. In average, telomeres in DKC patients are shorter than 99% of age-matched controls. The major morbidity of the disease is due to aplastic anemia, which is caused by defective maintenance of hematopoietic stem cells. Other aspects of the disease such as oral leukoplakia, nail dystrophy, mental retardation, testes atrophy and pulmonary complications all suggest impaired functions of tissue stem cells and progenitor cells10, findings in close agreement with those in late generation of telomerase knockout mice. DKC patients are prone to myelodysplastic syndrome and have an increased prevalence of malignant mucosal neoplasms. Thus, deficiency of telomerase in human patients recapitulates the defects of stem cell functions and tumor predisposition that are observed in late generation telomerase knockout mice.
Short telomeres and high telomerase activity are hallmarks of cancer. As normal or premalignant cells divide, the low or absent telomerase activity results in the eventual erosion of telomeres and activation of cellular checkpoints similar to those provoked by DNA double-stranded-breaks (DSBs)13. Like classical DSBs, telomere dysfunction has been shown to induce p53 and associated cellular responses, such as senescence and/or apoptosis14,15. Upon mutational inactivation of p53, cell cycling and cell survival are enhanced in cells with telomere dysfunction, which provides a pro-carcinogenic mutator mechanism characterized by translocations and regional amplifications and deletions16,17. At the same time, continued telomere dysfunction and associated rampant chromosomal instability (even in p53 null cells) appear to constrain full malignant progression of such cancers. For instance, late generation G4-G5 mTERC-/- Ink4a/Arf-/- mice showed significantly reduced lymphoma incidence compared with Ink4a/Arf null mice due to telomere attrition. In another study, more advanced adenomatous lesions in G4 mTERT-/- APCmin mice were greatly suppressed in comparison with APCmin mice due to significant growth arrest and apoptosis18,19. The observation that telomere dysfunction-induced genomic instability inhibits tumor progression prompts the speculation that the activation of telomerase may enable malignant progression in part by quelling genomic instability to a level compatible with cancer cell viability and/or neutralizing p53-dependent or -independent checkpoint mechanisms.
In order to study whether telomerase reactivation can stop or even reverse ageing of stem cells, and whether telomerase reactivation can promote the tumorigenesis against the backdrop of genomic instability, we generated two inducible murine telomerase alleles. The first one is 4-Hydroxytamoxifen (4-OHT)-inducible TERT-Estrogen Receptor (mTERT-ER) fusion knock-in allele. In the absence of 4-OHT, mice homozygous for mTERT-ER (designated mTERTER/ER) are telomerase activity deficient and sustain same cytogenetic and cellular phenotypes as conventional mTERT or mTERC knockout model. Upon 4-OHT treatment, TERT-ER protein activity can be restored to levels comparable to the native TERT protein20, 21. The second allele is a novel inducible TERT knock-in allele containing an intronic LoxP-Stopper-LoxP cassette (LSL-mTERT); upon Cre-mediated excision of LSL, mTERT is re-expressed under endogenous expression control mechanisms22.
Protocol
NOTE: All the steps in this protocol have been approved by UT MD Anderson Cancer Center.
1. Generation of mTERT-ER Allele
- Introduce knock-in targeting vector containing the ERT2-LBD (Ligand Binding Domain) upstream and in frame with the mTERT genomic sequence (exon 1 through intron 2) and a Lox-pgk-Neo-Lox fragment (Figure 1A) into mouse ES cells with electroporation.
- Culture the ES cells in neomycin for 6-10 days. Pick neomycin-resistant clones and expand in 48 well plates. Extract the genomic DNA using a commercial kit and confirm the knock-in allele by southern blot.
- Inject two ES lines with over 95% normal karyotypes into C57BL/6 blastocysts with a micromanipulation kit under an inverted microscope. Implant the blastocysts into the uterus of surrogate mothers23. Mate the high-grade male chimaeras (70-90%) to C57BL/6 females.
- Confirm the genotyping of heterozygous mTERT-ERneo animals by southern blot.
- Mate the heterozygous mTERT-ERneo animals and EIIa-Cre animals to delete the NeoR cassette. Mate the heterozygous animals to C57BL/6 animals for at least three times, and further inter-breed heterozygous mTERT-ER animals to generate homozygosity.
2. Generation of LSL-mTERT Allele
- Introduce the knock-in targeting vector containing a LoxP-triple Stopper-Neo-LoxP fragment and the mTERT genomic sequence (between exon 1 and intron 2, Figure 1B) into mouse ES cells with electroporation23.
- Culture the ES cells in neomycin for 6-10 days. Pick neomycin-resistant clones and expand in 48 well plates. Extract the genomic DNA using a commercial kit and confirm the knock-in allele by southern blot23.
- Inject two ES lines with over 95% normal karyotypes into C57BL/6 blastocysts with a micromanipulation kit under an inverted microscope. Implant the blastocysts into the uterus of surrogate mothers23. Mate the high-grade male chimaeras (70-90%) to C57BL/6 females.
- Confirm the genotyping of heterozygous LSL-mTERT animals by southern blot.
- Mate the heterozygous animals to C57BL/6 animals for at least three times, and further inter-breed heterozygous LSL-mTERT animals to generate homozygosity.
3. Reactivation of Telomerase in mTERT-ER and LSL-mTERT Mice In Vivo
For mTERT-ER
- Sterilize all the surgical tools before the injection.
- Anesthetize the mice with isoflurane chamber (4% for induction, 2% for maintaining) in 50% (v/v) oxygen/50% (v/v) dinitrogen monoxide gas mixture. Or anesthetize mice by a ketamine-xylazine mixture (100 mg/kg bodyweight + 10 mg/kg bodyweight).
- After deep anesthesia is reached, remove the anesthetized animal from the induction chamber, and keep their head inside the tube connected to the isoflurane chamber (2%).
- Pinch the foot pads of the mice to ensure the animal is deeply anaesthetized. Put ointment on both eyes in order to prevent the eyes from drying out. Wipe the back of the mice with povidone-iodine solution.
- Inject the slow-releasing 4-OHT pellet with precision trochar (10 G) under the skin of the back and push the pellet all the way to the midline between two shoulders.
- Seal the incision with wound clip applier and monitor the mice for recovery from anesthesia. Remove the clips 10 days later. Supplemental heat is not necessary because the procedure is finished shortly.
- Period of treatment with 4-OHT pellet should be optimized according to the purpose of the study.
For LSL-mTERT
- Tamoxifen (10 mg/ml, dissolved in corn oil) is injected intraperitoneally two consecutive days (200 ul/25 g/day).
4. Isolation of Neural Stem Cells and Reactivation of Telomerase In Vitro
- Mice are euthanized with carbon dioxide and the brains are removed. Follow the protocol of commercially available neural tissue dissociation kit as per manufacturer.
- Resuspend the lyophilized powder in the vial labeled Solution 4 with 1 ml of cell culture medium for Solution 4. Do not vortex. This solution should then be aliquoted and stored at –20 °C for later use.
- Pre-Heat the mixture at 37 °C for 15 min before use.
- Make Enzyme Mix 1: Solution 1 (50 µl) and Solution 2 (1,900 µl). Make Enzyme Mix 2: Solution 3 (20 µl) and Solution 4 (10 µl).
- Prepare 1,950 µl enzyme mix 1 for up to 400 mg tissue and vortex. Pre-heat the mixture at 37 °C for 15 min before use.
- Take out the 1-day mouse brains, and keep the forebrains by removing the olfactory bulbs and the cerebellum. Keep the forebrain tissues in 1 ml of cold culture medium since removal and store in 4 °C. Make sure to process the neural tissue within 1 hr.
- Determine the weight of tissue to make sure the 400 mg limit per digestion is not exceeded. Place the brain on the lid of a 35 mm diameter Petri dish, and crush the brain using a scalpel.
- Using a 1 ml pipette tip, add 1 ml of HBSS (w/o Ca/Mg) and pipette pieces back into a 15 ml tube. Rinse with HBSS (w/o Ca/Mg). Centrifuge at 300 × g for 2 min at room temperature and aspirate the supernatant carefully.
- Add 1,950 µl of pre-heated enzyme mix 1 (Solutions 1 and 2) per up to 400 mg tissue. Incubate in the 15 ml tube for 15 min at 37 °C, mixing by inverting or shaking the tube every 5 min.
- Prepare 30 µl enzyme mix 2 per tissue sample by adding 20 μl of Solution 3 to 10 μl of Solution 4. Then add to sample. Invert gently to mix. Do not vortex.
- Dissociate tissue mechanically using a wide-tipped, fire-polished Pasteur pipette by pipetting up and down 10 times slowly. Avoid forming air bubbles.
- Incubate at 37 °C for 10 min, inverting the tube every 3 min.
- Repeat the step 4.11 and step 4.12 if the tissues are bigger than 200 mg.
- Apply the cell suspension to a 70 μm cell strainer, placed on a 50 ml tube. Apply 10 ml of PBS through cell strainer. Discard cell strainer and centrifuge cell suspension at 300 g for 20 min at room temperature. Aspirate supernatant completely.
- Resuspend cells with stem cell medium to the required volume for further applications.
- To activate telomerase in LSL-mTERT NSCs, treat the cells with 100 µM 4-OHT for two days. To activate telomerase in mTERT-ER NSCs, keep the cells in culture medium with 100 µM 4-OHT.
5. Telomere FISH
- Prepare the metaphase chromosomes from cultured cells.
- For FFPE (Formalin Fixed and Paraffin Embedded) tissue sections, deparaffinize in xylene and rehydrate in ethanol series for 5 minutes each (100%, 90%, 70%, 50% ethanol) and PBS for 5 min.
- Post-fix in the methanol: acetic acid (3:1) for 1-2 hr. Dehydrate in cold ethanol series for 5 min each (70%, 90%, 100% ethanol) and air dry. Wash in 1x PBS at 37 °C for 5 min.
- Denature chromosomes in 4% formaldehyde at 37 °C for 2 min. Dehydrate in cold ethanol series 5 min each (70%, 90%, 100% ethanol) and air dry.
- Apply 12 to 25 µl of the PNA hybridization mixture to each slide. (Hybridization mix: 70% formamide, 0.06x SSC, 0.2% BSA, 0.5 ng/µl tRNA, 0.5 ng/µl telomere or centromere probes)
- Seal the cover slip with rubber cement. Post-denature chromosomal preps and tissue sections at 80 °C for 4 min. Hybridize at room temperature or 37 °C for 2-4 hr in humid chamber.
- Wash at room temperature with washing buffer 2 x 15 min. (Wash buffer: 70% formamide, 0.06x SSC, pH 7.2). Wash at room temperature 3 x 5 min with PBST. Counter-stain slides with DAPI or far-red fluorescence for microscopic examination.
Results
The strategies to generate murine mTERT-ER and LSL-mTERT knock-in alleles were described in Figure 1A and 1B. Specifically, a LoxP-triple Stopper-Neo-LoxP fragment was inserted between exon 1 and exon 2 of mTERT locus to generate LSL-mTERT allele. To generate mTERT-ER allele, ERT2-LBD domain in frame with the mTERT gene was inserted into the N-terminus of exon 1. We showed that when telomerase was transiently reactivated in telomere dysfunction mice by treating them with 4-OHT pellets for 4 weeks, the degenerative phenotype could be ameliorated in multiple organs such as brain (Figure 2A) and testes (Figure 2B). In order to determine the impact of telomerase reactivation on cells cultured in vitro, we isolated neural stem cells (NSCs) from late generation G4 LSL-mTERT and G4 mTERT-ER mice. We showed that when telomerase was reactivated in telomere dysfunctional NSCs, the self-renewal capability of NSCs was greatly increased (Figure 3A), and in vitro neurogenesis was also significantly enhanced (Figure 3B). In order to determine the impact of telomerase reactivation on tumorigenesis in the context of telomere dysfunction, we generated PB-Cre4 PtenL/L p53L/L LSL-mTERTL/L (prostate tumor model) and Atm-/- mTERTER/ER (thymic T-cell lymphoma model) late generation cohorts. When telomerase was reactivated by tamoxifen treatment in these mice with injection (Figure 4A) or 4-OHT pellets for 8 weeks (Figure 4B), the tumorigenesis was greatly enhanced in both prostate tumor model (Figure 4A) and thymic T-cell lymphoma model (Figure 4B). Lastly, we reported the protocols of performing telomere FISH on FFPE mouse brain tissues (Figure 5) and metaphase chromosomes (Figure 5, inset).
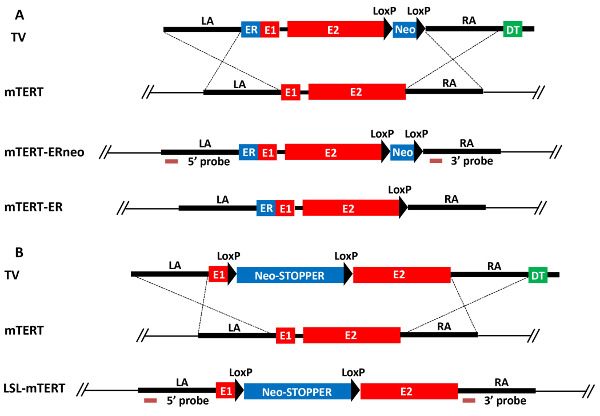
Figure 1: (A) mTERT-ER knock-in strategy. TV, targeting vector; WT, wild type allele; KI, knock-in allele; LA, left arm; RA, right arm; E1, exon 1; E2, exon 2; neo, pgk promoter-driven neomycin resistant gene; ER, modified estrogen receptor (ERT2) ligand binding domain; DT, dyphteria toxin gene. (B) LSL-mTERT knock-in strategy. TV, targeting vector; WT, wild type allele; KI, knock-in allele; LA, left arm; RA, right arm; E1, exon 1; E2, exon 2; neo, pgk promoter-driven neomycin resistant gene; STOPPER, three repetitive transcriptional stop sequences; DT, dyphteria toxin gene.
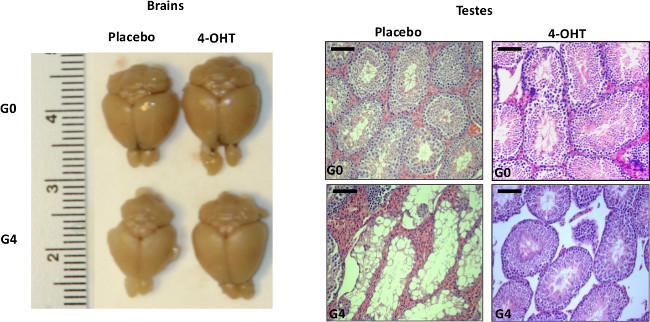
Figure 2: Representative data to show telomerase reactivation ameliorates degenerative phenotypes of organs. Representative images of brains (left) and testes (right) of G0 and G4 mTERT-ER mice treated with placebo or 4-OHT for 4 weeks. Scale bars indicate 50 µm. Re-print with permission from 20. Please click here to view a larger version of this figure.
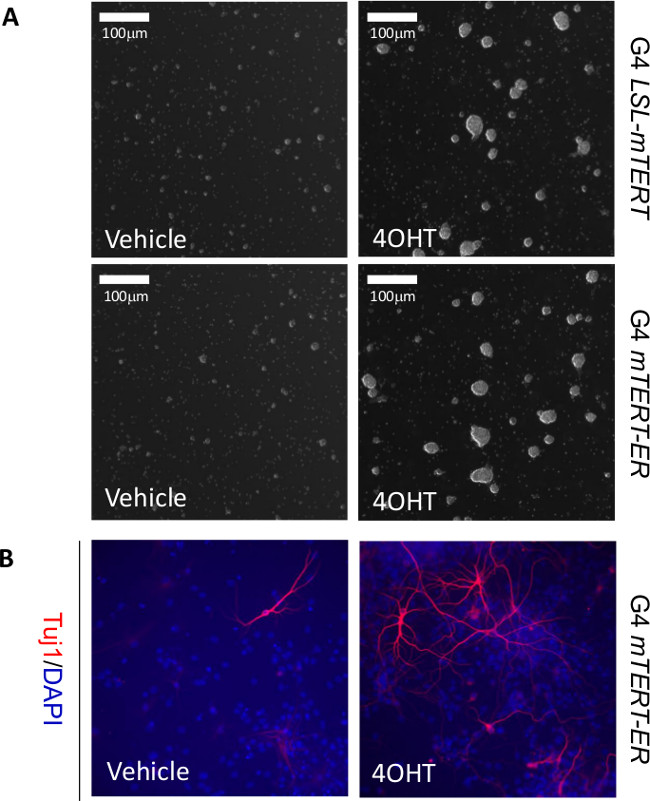
Figure 3: Representative data to show telomerase reactivation enhances self-renewal and neurogenesis of neural stem cells in vitro. (A) Representative images of neural stem cells isolated from G4 LSL-mTERT (upper panel) and G4 mTERT-ER (lower panel) growing in stem cell medium treated with vehicle or 4-OHT. (B) Representative images of in vitro neurogenesis (Tuj1+) of neural stem cells isolated from G4 mTERT-ER cultured in differentiation medium (with 1% FBS) treated with vehicle or 4-OHT. Scale bars indicate 100 µm.
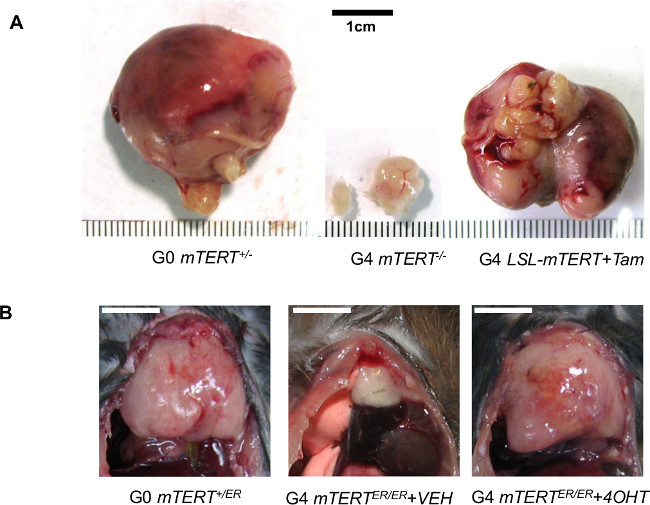
Figure 4: Representative data to show telomerase reactivation enhances tumorigenesis against the backdrop of genomic instability. (A) Representative images of prostate tumors dissected from G0 PB-Cre4 PtenL/L p53L/L LSL-mTERT+/-, G4 PB-Cre4 PtenL/L p53L/L LSL-mTERT-/-, and G4 PB-Cre4 PtenL/L p53L/L LSL-mTERTL/L treated with tamoxifen. Re-print with permission from 22. (B) Representative images of thymic T-cell lymphomas dissected from G0 Atm-/- mTERT+/ER, G4 Atm-/- mTERTER/ER treated with vehicle, and G4 Atm-/- mTERTER/ER treated with 4-OHT for 8 weeks. Scale bars indicate 1 cm.
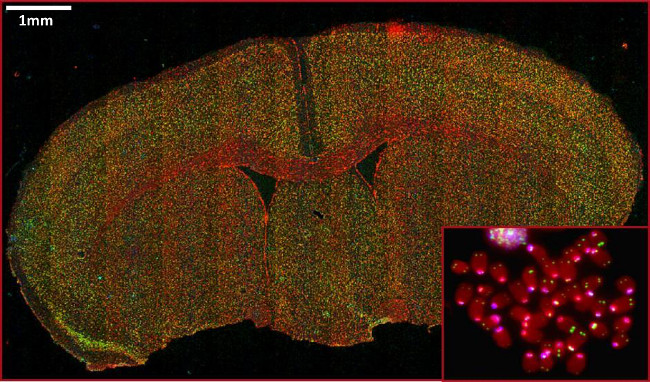
Figure 5: Representative images of telomeric and centromeric FISH on FFPE mouse brain tissue and metaphase (inset). Red indicates DNA, green indicates telomere staining, and cyan indicates centromere staining. Scale bars indicate 1 mm.
Discussion
Here, we report the generation of two inducible murine telomerase alleles and how to reactivate telomerase in vivo and in vitro. The critical step for reactivating mTERT-ER activity is to keep a continuous concentration of tamoxifen, so we choose to use 4-OHT time-release pellets manufactured by Innovative Research of America. The pellets keep releasing 4OHT at a steady state blood level of 1 ng/ml for up to 60 days. In a previous study, we showed that reactivating telomerase activity with this strategy was able to ameliorate the degenerative phenotypes such as stem cell exhaustion, impairment of tissue injury responses and organ failure in multiple organs that were induced by telomere dysfunction in G4mTERTER/ER mice20.
Other than studying the function of telomerase in ageing, these two inducible telomerase alleles can also be used to study cancer. Previous studies took advantage of these alleles to explore the role of telomere attrition and telomerase reactivation in shaping the genomes and impacting the biology of T-cell thymic lymphoma21 and prostate cancer22. These two studies showed that telomere dysfunction in late generation G4 Atm-/- mTERTER/ER and G4 PB-Cre4 PtenL/L p53L/L LSL-mTERTL/L mice provides a mechanism fueling the acquisition of early mutagenic events for tumor initiation, yet preventing progression of fully malignant tumors. When telomerase was reactivated in the context of telomere dysfunction-induced genomic instability, DNA damage checkpoints and rampant chromosomal instability were suppressed , which allowed the full progression of malignant tumors with new biological properties such as bone metastasis of prostate cancer21 and brain infiltration of thymic lymphoma21. Similar phenomena were also observed in other cancer types including colon cancer and pancreatic cancer (personal communications with Drs. Haoqiang Ying, Adam Boutin and Ronald DePinho).
Because TERT-ER protein can be easily toggled between on and off states depending on whether the animals are treated with tamoxifen or vehicle, the tumor models generated by mTERT-ER allele can be utilized to test anti-telomerase therapy. In previous study, tumors generated in G4 Atm-/- mTERTER/ER animals were released from 4-OHT; upon telomerase depletion, tumors eventually shrank due to the reinstatement of telomere dysfunction-induced checkpoints21. However, some of the tumors acquired resistance in response to telomerase extinction by activating an Alternative Lengthening of Telomeres (ALT) mechanism. Further characterization of these ALT+ resistant tumors showed that they have aberrant transcription of genes involved in mitochondrial biology and oxidative defense including a master regulator of mitochondrial synthesis and oxidative defense PGC-1β. Knockdown of PGC-1β or SOD2 (another regulator of oxidative defense) significantly eliminates ALT+ tumor cells while keep telomerase+ tumor cells remain relatively intact21 .
One limitation of these two knock-in alleles is that they can only afford reactivation of telomerase at endogenous level because they are in the native locus of the telomerase gene. In most human cancers, telomerase is actually overexpressed at a much higher level. In order to enhance the level of telomerase, one modification we can consider is to insert the mTERT-ER construct with a stronger promoter such as PGK (phosphoglycerate kinase) promoter into Rosa26 locus.
In conclusion, these two novel inducible murine telomerase alleles provide unprecedented genetic tools to study the functions of telomerase in ageing and tissue homeostasis as well as the tumor progression, especially under the background of pre-acquired telomere dysfunction-induced genomic instability. The mTERT-ER allele can also be used to study anti-telomerase therapy by crossing into other tumor-prone mouse models.
Disclosures
The authors have nothing to disclose.
Acknowledgements
J.H. is supported by NIH K99/R00 Pathway to Independence Award (5K99CA172700) and NCI Brain Cancer SPORE Career Development Award (2P50CA127001).
Materials
| Name | Company | Catalog Number | Comments |
|---|---|---|---|
| Leica AM6000 Micromanipulation Kit | Leica | Per quote | |
| Leica DMI6000 B inverted microscope | Leica | Per quote | |
| Neomycin | Life technologies | 21810031 | |
| isoflurane vaporizer | Veterinary Anesthesia Systems | 911103 | |
| isoflurane | Henry Schein | 1005796 | |
| ketamine-xylazine mixture | Sigma-Aldrich | K113-10ML | |
| 4-OHT powder | Sigma-Aldrich | H7904-5MG | |
| Tamoxfien | Sigma-Aldrich | T5648-1G | |
| 4-OHT pellet | Innovative Research of America | Custermized | |
| Precision Trochar (10 Gauge) | Innovative Research of America | MP-182 | |
| wound clip applier | Fischer Scientific | 01-804 | |
| clip | Fischer Scientific | 01-804-5 | |
| Neural Tissue Dissociation Kit | Miltenyi Biotec | 130-092-628 | |
| HBSS | Life technologies | 14025092 | |
| PBS | Life technologies | 10010023 | |
| xylene | Fischer Scientific | X3P-1GAL | |
| methanol | Fischer Scientific | A-433S4 | |
| acetic acid | Fischer Scientific | A38-500 | |
| ethanol | Fischer Scientific | 22-032-104 | |
| formamide | Fischer Scientific | F84-1 | |
| PNA telomere probe | Panagene | F1001-5 | |
| PNA centromere probe | Panagene | F3003-5 | |
| 20X SSC | Fischer Scientific | BP1325-4 | |
| BSA | Sigma-Aldrich | A2153-10G | |
| tRNA | Sigma-Aldrich | R5636-1ML | |
| Tween 20 | Fischer Scientific | BP337-100 | |
| rubber cement | Walmart | Elmer's | |
| DAPI | Sigma-Aldrich | D9542 |
References
- Bass, A. J., et al. Genomic sequencing of colorectal adenocarcinomas identifies a recurrent VTI1A-TCF7L2 fusion. Nat Genet. 43, 964-968 (2011).
- Beroukhim, R., et al. The landscape of somatic copy-number alteration across human cancers. Nature. 463, 899-905 (2010).
- Blasco, M. A., et al. Telomere shortening and tumor formation by mouse cells lacking telomerase RNA. Cell. 91, 25-34 (1997).
- Lee, H. W., et al. Essential role of mouse telomerase in highly proliferative organs. Nature. 392, 569-574 (1998).
- Rossi, D. J., et al. Deficiencies in DNA damage repair limit the function of haematopoietic stem cells with age. Nature. 447, 725-729 (2007).
- Wong, K. K., et al. Telomere dysfunction and Atm deficiency compromises organ homeostasis and accelerates ageing. Nature. 421, 643-648 (2003).
- Rudolph, K. L., et al. Longevity, stress response, and cancer in aging telomerase-deficient mice. Cell. 96, 701-712 (1999).
- Wong, K. K., et al. Telomere dysfunction impairs DNA repair and enhances sensitivity to ionizing radiation. Nat Genet. 26, 85-88 (2000).
- Ferron, S., et al. Telomere shortening and chromosomal instability abrogates proliferation of adult but not embryonic neural stem cells. Development. 131, 4059-4070 (2004).
- Savage, S. A., Alter, B. P. Dyskeratosis congenita. Hematol Oncol Clin North Am. 23, 215-231 (2009).
- Armanios, M. Syndromes of telomere shortening. Annu Rev Genomics Hum Genet. 10, 45-61 (2009).
- Vulliamy, T., et al. The RNA component of telomerase is mutated in autosomal dominant dyskeratosis congenita. Nature. 413, 432-435 (2001).
- Harley, C. B., Harley, S. W. Telomerase, checkpoints and cancer. Cancer surveys. 29, 263-284 (1997).
- Karlseder, J., Broccoli, D., Dai, Y., Hardy, S., de Lange, T. p53- and ATM-dependent apoptosis induced by telomeres lacking TRF2. Science (New York, N.Y.). 283, 1321-1325 (1999).
- Steensel, B., Smogorzewska, A., de Lange, T. TRF2 protects human telomeres from end-to-end fusions. Cell. 92, 401-413 (1998).
- Chin, L., et al. p53 deficiency rescues the adverse effects of telomere loss and cooperates with telomere dysfunction to accelerate carcinogenesis. Cell. 97, 527-538 (1999).
- Artandi, S. E., et al. Telomere dysfunction promotes non-reciprocal translocations and epithelial cancers in mice. Nature. 406, 641-645 (2000).
- Rudolph, K. L., Millard, M., Bosenberg, M. W., DePinho, R. A. Telomere dysfunction and evolution of intestinal carcinoma in mice and humans. Nat Genet. 28, 155-159 (2001).
- Greenberg, R. A., et al. Short dysfunctional telomeres impair tumorigenesis in the INK4a(delta2/3) cancer-prone mouse. Cell. 97, 515-525 (1999).
- Jaskelioff, M., et al. Telomerase reactivation reverses tissue degeneration in aged telomerase-deficient mice. Nature. 469, 102-106 (2011).
- Hu, J., et al. Antitelomerase therapy provokes ALT and mitochondrial adaptive mechanisms in cancer. Cell. 148, 651-663 (2012).
- Ding, Z., et al. Telomerase reactivation following telomere dysfunction yields murine prostate tumors with bone metastases. Cell. 148, 896-907 (2012).
- Nagy, A. Manipulating the mouse embryo : a laboratory manual. , 3rd Edn, Cold Spring Harbor Laboratory Press. Cold Spring Harbor, N.Y. (2003).
Reprints and Permissions
