The objective of the study was to assess the biological impact of 15 cigarette smoke constituents using a combination of an impedance-based real time cell analyzer and a high-content screening (HCS)-based platform for toxicological assessment in vitro. This study provides information on effective doses, toxicity and modes of action of the tested compounds.
Method Article
High Content Screening Analysis to Evaluate the Toxicological Effects of Harmful and Potentially Harmful Constituents (HPHC)
In This Article
Summary
Abstract
Cigarette smoke (CS) is a major risk factor for cardiovascular and lung diseases. Because CS is a complex aerosol containing more than 7,000 chemicals1 it is challenging to assess the contributions of individual constituents to its overall toxicity. Toxicological profiles of individual constituents as well as mixtures can be however established in vitro, by applying high through-put screening tools, which enable the profiling of Harmful and Potentially Harmful Constituents (HPHCs) of tobacco smoke, as defined by the U.S. Food and Drug Administration (FDA).2
For an initial assessment, an impedance-based instrument was used for a real-time, label-free assessment of the compound's toxicity. The instrument readout relies on cell adhesion, viability and morphology that all together provide an overview of the cell status. A dimensionless parameter, named cell index, is used for quantification. A set of different staining protocols was developed for a fluorescence imaging-based investigation and a HCS platform was used to gain more in-depth information on the kind of cytotoxicity elicited by each HPHC.
Of the 15 constituents tested, only five were selected for HCS-based analysis as they registered a computable LD50 (< 20 mM). These included 1-aminonaphtalene, Arsenic (V), Chromium (VI), Crotonaldehyde and Phenol. Based on their effect in the HCS, 1-aminonaphtalene and Phenol could be identified to induce mitochondrial dysfunction, and, together with Chromium (VI) as genotoxic based on the increased histone H2AX phosphorylation. Crotonaldehyde was identified as an oxidative stress inducer and Arsenic as a stress kinase pathway activator.
This study demonstrates that a combination of impedance-based and HCS technologies provides a robust tool for in vitro assessment of CS constituents.
Introduction
Toxicological risk assessment has historically relied on the use of animal models which, though fundamental in the life sciences, are also linked with shortcomings such as inconsistent translatability to humans and high cost. Furthermore, there has been an increasing effort to find alternatives to animal testing in the spirit of "The 3Rs"2 (replacement, reduction, and refinement). This effort has been accelerated over the past few years, not only because of recent advances such as high-throughput techniques and systems biology approaches, but also because of legislation restricting the use of animal testing, especially in the European Union.
The complexity of cellular signaling pathways regulating the response to toxic insults makes it evident that using single toxicological endpoints will not be sufficient to describe the toxicological basis of certain compounds. For this, the interplay of hundreds of interacting proteins contributing to a biological network will also need to be taken into account. To study the effect of toxicants on those networks, a system toxicology approach combined with phenotypic medium- and high-throughput screening assays is useful to infer potencies and at the same time provide more information on the mechanism of action of individual toxicants.
In this study, we employed HCS as a powerful screening tool, which is composed of an automated microscope and a biological software application, that can acquire, process and analyze image data derived from specific fluorescence-based cellular assays. This allows for visual changes within a cell to be quantified, at a single cell or subcellular level, and many parameters to be analyzed simultaneously.3 For example, DNA double-strand breaks were evaluated using an antibody-based identification of histone H2AX phosphorylation and reactive oxygen species (ROS) were quantified using a cell-permeable superoxide sensitive dye.
Because lung epithelial cells represent the first biological barrier against inhaled toxicants, including cigarette smoke, we utilized primary bronchial epithelial cells as an in vitro model to profile the effect of HPHCs published by the United States Food and Drug Administration.4 This manuscript is a follow-up on a previous study5 in which we evaluated the biological impact of a different subset of HPHCs.
As part of our workflow to assess cytotoxicity in vitro, we initially evaluated the potencies of a selection of 15 HPHC's, using an impedance-based real-time cellular analysis (RTCA) system which allowed us to establish dose-ranges, suitable for subsequent HCS analysis (Figure 1). A toxicological HCS assessment was then conducted using nine multi-parametric endpoints of cellular toxicity, each monitored at two time points (4 and 24 hr). The markers used were indicative of mitochondrial toxicity, DNA damage, stress kinase, reactive oxygen species (ROS), glutathione (GSH) content, caspase 3 - 7 activity, cytochrome C release and cell membrane permeability, as described in Table 1.
Our approach enabled identification and characterization of the effect of cigarette smoke constituents through dose- and time-dependent sampling. Ultimately, this produced an in vitro toxicological profile for each HPHC. Multi-omics approaches can also be used to further complement the HCS analysis. This would finally also provide a deeper understanding of the effects at the cell signaling and/or transcriptional level.
Protocol
1. Harvesting Normal Human Bronchial Epithelial Cells (NHBEs)
- Pre-warm the cell culture medium (bronchial epithelial cell growth medium-supplemented medium), the HEPES, trypsin, and trypsin neutralizing solution (TNS) in the water bath at 37 °C.
- Harvest the cells when 80% of confluence is reached.
NOTE: The following NHBE cell culture seeding conditions may be used to obtain optimal confluence in uncoated T75 flasks with 20 ml medium:- Seed 1 x 10⁶ cells for 3-day culture, 0.5 x 10⁶ cells for 4-day culture and 0.25 x 10⁶ cells for 5-day culture. Change medium every 2 days when cells are in culture to refresh nutrients. Culture cells at 37 °C and 5% CO2.
- Remove the supernatant from the flask(s) and add HEPES to wash the cells (e.g., 3 ml for a 75 cm2 flask). Rotate each flask to cover the cell monolayer with the HEPES solution.
- Remove the HEPES solution and add trypsin solution (e.g., 3 ml for a 75 cm2 flask). Rotate the flask to cover the cell monolayer with trypsin solution.
- Incubate the flask for 5 min at 37 ± 2 °C. Monitor cell detachment under the microscope and if necessary, incubate longer and gently tap the flask to release any remaining attached cells.
- Add TNS to stop the reaction (e.g., 3 ml for a 75 cm2 flask) and transfer the cell suspension to a 15 ml tube.
- Centrifuge the cell suspension at 300 × g for 5 min.
- Discard the supernatant and re-suspend the cell pellet in 10 ml of fresh medium, mixing gently to yield a homogeneous cell suspension.
- Filter the cell suspension through a 100 µM cell strainer to remove aggregates and count the cells. Note: In our laboratory an electric field multi-channel cell counting system was used to precisely and consistently evaluate the viable cells number.
2. Real Time Cell Analyzer (RTCA)-based Dose Range Finding (DRF)
NOTE: An impedance-based measurement system was used to: 1) evaluate compound toxicity, 2) select compounds to be further investigated by HCS and 3) select appropriate doses for HCS. The NHBE cells in the RCTA plates are dosed by adding 25 μl of test compound dilutions to 100 μl medium present in each well. Therefore, all test solutions are prepared at 5 times (5x) the desired final concentration.
- Seeding NHBE Cells
- Program the instrument to define the number and duration of impedance measurements. In this study, data were recorded every 15 min for 48 hr (from 24 hr ± 2 hr before and 24 hr after dosing the cells with test agents).
- Measure the plate background by pipetting 50 μl of pre-warmed medium into each well of a 96-well RTCA plate. Note: This step represents a technical requirement for the instrument to calculate the medium electrical resistance which is then used as a baseline reference for cell-based calculation.
- Prepare a cell suspension at a concentration of 144,000 cells/ml (± 5%) and add 50 μl cell suspension (7,200 cells/well) to each well of the RTCA plate in which 50 μl/well of medium was already added for instrument background measurement.
- Let the cells adhere for 30 min at room temperature before placing them into the RTCA cradle (to improve the homogeneous distribution of the cells). Incubate the RTCA plates in the RTCA cradle in the incubator (37 °C and 5% CO2) and start recording the data for the next 24 ± 2 hr prior to dosing.
- Dilutions of HPHCs and Positive Controls
- Positive Control Dilution
- Dilute the Staurosporine stock solution (10 mM) 1:10 in DMSO (see Table 3) and add 5 μl of the dilution to 195 μl of medium to obtain a 5x working solution.
- HPHC Dilution
- Dissolve/dilute each HPHC in the vehicle (Table 2) to generate a 1 M stock solution. Dilute each HPHC stock solution 1:10 in medium to generate a 100 mM solution.
- Generate the "compound master plate" by performing a five-step 1:10 serial dilution using medium + 10% vehicle to obtain the 5x working solutions (Figure 2). Note: Ultimately, the final doses will be: 0.2 μM, 2 μM, 20 μM, 0.2 mM, 2 mM, 20 mM. Also prepare the dose 0, corresponding to the only vehicle, in this step.
- Dosing
- Pause the RTCA instrument and open the cradle to remove the plate.
- Remove the plate and place it in the RTCA plate temperature tool (designed to stabilize the temperature of the RTCA plate during experimental procedures outside the RTCA station) to avoid cooling the cells, which could impact the impedance measurement.
- Add 25 μl 5x solution from the "compound master plate" to cells in triplicate maintaining the same dosing order as in the compound master plate (highest dose in the top row and vehicle control in the row number 7) (Figure 2). Do not remove the existing (100 µl) cell culture medium.
- Add 25 μl 5x positive control solution to the cells in the bottom row (half-right) without removing existing culture medium. Add 25 μl medium to the cells in the bottom row (half-left) without removing existing cell culture medium.
- Seal the plate with plate sealer. Place the plate back in the RTCA cradle and lock it. Restart data recording for the desired exposure time (e.g., 24 hr). Note: The use of this sealant film is recommended to avoid potential contamination, including well-to-well cross-contamination.
- Data Analysis RTCA and LD50 Calculation
- Export raw data as a text (.txt) or excel (.xls) file. Note: The file will contain all the information regarding the plate layout (Compounds, doses and well position). Raw cell index values are organized in a 96 well format (mirroring plate well distribution) and are provided for every time points at which the recording occurred. The value at position i in the 96 well plate at time t is denoted by CIt(i).
- Identify as a normalization reference the latest time point before the dosing for each position i in the 96 well plate (e.g., Cell Index at 23 hr 50 min 00 sec at position i, CIt(i)=23:50:00 = CIRef(i)). Note: This information must be annotated when the dosing is performed.
- Divide, on a well base, every time point values by the normalization reference to normalize all the values at the dosing time. The normalized value at position i in the 96 well plate at time t is denoted by NCIt(i) and is thus defined by NCIt(i) = CIt(i) / CIRef(i) for all t.
- Calculate the area under the curve (AUC) at 24 hr post-dosing for each sample i (position i in the 96 well plate), including positions for positive control and vehicle.
- Obtain the AUC at position i is obtained by summing the areas of each rectangle, each rectangle being between two timepoints denoted by tk and tl (tk l); calculate each rectangle area using x*y with x = tl- tk being the distance between two timepoints and y being the mean of the activity of the two timepoints (y = (NCItk(i) + NCItl(i)) / 2).
Note: The AUC at 24 hr post-dosing for position i is denoted by AUC(i). As all the conditions are plated in triplicate wells the median of the three values is used.
- Obtain the AUC at position i is obtained by summing the areas of each rectangle, each rectangle being between two timepoints denoted by tk and tl (tk l); calculate each rectangle area using x*y with x = tl- tk being the distance between two timepoints and y being the mean of the activity of the two timepoints (y = (NCItk(i) + NCItl(i)) / 2).
- Normalize the values using the following equation:

where i is the position in the 96 well plate for which AUC was calculated at 24 hr post-dosing,
Vehicle is the median of the AUC values for the vehicle wells on a plate at 24 hr post-dosing,
Positive control is the median of the AUC values for the positive control wells on a plate at 24 hr post-dosing,
CR is the desired median normalized value for the vehicle (0%), and
SC is the desired median normalized value for the positive controls (-100%)
NOTE: At the end of this step, a data set is obtained that contains, for each position i in the 96 well plate, a concentration ci (in logarithmic units) that is applied to the sample contained in position/well i and its corresponding normalized AUC at 24 hr post-dosing AUC_normalized(i). - Plot and fit the (ci, AUC_normalized(i))-values using a 4-parameters Hill equation. When possible, also calculate LD50.
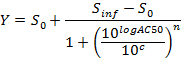
where Y = AUC_normalized,
Zero Activity S0 = Activity level at zero concentration of test compound,
Infinite Activity Sinf = Activity level at infinite concentration,
AC50 = Concentration at which activity reaches 50% of maximum level,
Hill coefficient n = Measure of the slope at AC50, and
c = Concentration in logarithmic units corresponding to the values on the x-axis of the dose-response curve plot.
NOTE: AC50 corresponds to LD50 (cytotoxicity assays). It is a measure of potency where low values indicate high potency.
- Positive Control Dilution
3. Measuring Toxicological Effects by HCS
NOTE: A total of nine multi-parametric markers of toxicity, grouped in six different assays, are measured using the HCS platform (Table 1). Based on the RTCA cell viability analysis (Section 2) the dose range of each constituent is defined and a 3R4F reference dose is also included. The reference dose is equivalent to the amount of HPHC present in the smoke of one stick from the reference cigarette 3R4F.
- Seeding NHBE Cells
- Prepare a cell suspension at 120,000 cells/ml (± 5%) and add 100 µl cell suspension to each well of a 96-well HCS plate (12,000 cells/well). Prepare enough plates for the assessment of all assays (Cytotoxicity, DNA damage, Stress kinase, ROS, GSH content and Apoptosis) and timepoints (4 and 24 hr).
- Leave the HCS plates at room temperature for 30 min to allow cells to attach to wells and then incubate at 37 °C and 5% CO2 for 24 ± 2 hr prior to dosing.
- Dilution of HCHPs and Positive Controls
NOTE: The NHBE cells in the HCS plates will be dosed by adding 25 μl of test sample solutions to 100 μl of medium already present in each well. Therefore, all doses are prepared at 5x the desired final concentration.- Positive Controls Dilution (Positive Control Plate)
- Dispense 40 µl of stock solution of each positive control (see Table 3) in column # 2 (Figure 4a, wells shaded in red). Dispense 20 µl of vehicle in columns # 3 and # 5 (Figure 4a, wells shaded in light blue) and 40 µl of vehicle in column # 4 (Figure 4a, wells shaded in light blue).
- Withdraw 12 µl from the wells in column # 2, dispense it to the wells in column # 3 and mix (Figure 4b), continue till a final serial dilution with 3 doses (d1, d2, and d3) and vehicle (V) for each positive control compound is obtained (Figure 4c). To generate the positive control plate, prepare a 1:40 dilution of compounds in media (Figure 4d).
- HPHC Dilution (Compound Master Plate)
NOTE: The selected dose ranges of HPHCs for HCS are listed in Table 2.- Dilute each HPHC stock solution (1 M) 1:10 in medium for a concentration of 100 mM. Perform dilutions using medium with 10% vehicle to obtain the selected 5x doses for each HPHC.
- Positive Controls Dilution (Positive Control Plate)
- Dosing
- Add 25 μl of 5x solutions from the compound master plate to the cells in triplicate maintaining the same dosing order as in the compound master plate (highest dose in the top row and vehicle control in the row number 7) (Figure 5). Do not remove the existing (100 µl) cell culture medium.
- Add 25 μl of 5x solution from the positive control plate to the cells in the bottom row maintaining the same dosing order as in the positive control plate (Figure 5). Do not remove the existing (100 µl) cell culture medium. Note: Each assay has a specific positive control; see Table 3. Incubate the plate at 37 °C and 5% CO2 for the desired exposure time (4 or 24 hr).
- Staining
- Preparation for all Assays
- Pre-warm the Wash buffer (PBS) solutions at 37 °C.
- Prepare the Fixation solution (4% formaldehyde solution) adding 10.81 ml of 37% formaldehyde to 89.19 ml of wash buffer and pre-warm it at 37 °C.
- Prepare the Permeabilization buffer by adding 10 ml of 10x permeabilization buffer to 90 ml of wash buffer and pre-warm it at 37 °C.
- Prepare the Blocking buffer by adding 10 ml of 10x blocking buffer to 90 ml of wash buffer and pre-warm it at 37 °C.
- Pre-warm the Cell culture medium at 37 °C.
- Remove the HCS plates from the incubator once the 4 and 24 hr exposure times are reached and perform the following specific protocols for each assay.
- Cytotoxicity Assay
- Prepare a sufficient volume (V) of Live Cell Staining Solution according to the following formula: Volume of Medium (μl) V = 50 x W x 1.2 (W Number of wells)
- Dilute the Mitochondria dye in the Live Cell Staining Solution according to vendor's instruction. Dilute the Membrane Permeability dye in the Live Cell Staining Solution according to vendor's instruction.
- Add 50 μl Live Cell Staining solution to each well of the plate(s) designated "Cytotoxicity assay". DO NOT remove cell culture medium and incubate for 30 min at 37 °C, 5% CO2.
- Gently aspirate the medium and staining solution and add 100 μl/well of fixation solution to each well, then incubate plate(s) for 20 min at room temperature in the dark.
- Gently aspirate fixation solution and wash once with 100 μl/well wash buffer.
- Remove wash buffer and add 100 μl/well 1x permeabilization buffer to each well and incubate for 10 min at room temperature in the dark.
- Aspirate permeabilization buffer and wash plate twice with 100 μl/well of wash buffer.
- Aspirate wash buffer and add 100 μl of 1x blocking buffer to each well and incubate for 15 min at room temperature in the dark.
- Prepare a sufficient volume (V) of Primary Antibody Solution according to the following formula: Volume of Blocking buffer (μl) V = 50 x W x 1.2 (W Number of wells). Dilute the anti-cytochrome C antibody (mouse) 1:250 in Primary Antibody Solution.
- Aspirate blocking buffer and add 50 μl/well Primary Antibody Solution to each well and incubate for 60 min at room temperature in the dark.
- Prepare a sufficient volume (V) of Secondary Antibody and Nuclear Solution according to the following formula: Volume of Blocking buffer (μl) V = 50 x W x 1.2 (W Number of wells). Dilute the anti-mouse antibody 1:500 in Secondary Antibody and Nuclear Solution. Dilute the Nuclear dye 1:1,000 in Secondary Antibody and Nuclear Solution.
- Aspirate Primary Antibody Solution and wash plate three times with 100 μl/well of wash buffer using the plate washer.
- Aspirate wash buffer and add 50 μl/well of Secondary Antibody and Nuclear Solution to each well of the plate(s) and incubate for 60 min at room temperature in the dark.
- Aspirate Secondary Antibody and Nuclear Solution and wash plate three times with 100 μl/well of wash buffer using the plate washer. Add 100 μl/well of wash buffer. Plate(s) is (are) now ready to be evaluated on the HCS reader.
- DNA Damage Assay
- Gently aspirate the medium from the plates designated "DNA damage".
- Perform the same steps as described in sequence: 3.4.2.4 - 3.4.2.8. Note that in this instance, only medium is removed during step 3.4.2.4.
- Prepare a sufficient volume (V) of Primary Antibody Solution according to the following formula: Volume of Blocking buffer (μl) V = 50 x W x 1.2 (W Number of wells)
- Dilute the anti-phospho H2AX antibody (mouse) 1:2,000 in Primary Antibody Solution.
- Perform the same step as described in 3.4.2.10.
- Prepare a sufficient volume (V) of Secondary Antibody and Nuclear Solution according to the following formula: Volume of Blocking buffer (μl) V = 50 x W x 1.2 (W Number of wells)
- Dilute the anti-mouse antibody 1:500 in Secondary Antibody and Nuclear Solution.
- Dilute the Nuclear dye 1:1,000 in Secondary Antibody and Nuclear Solution.
- Perform the same steps as described in sequence: 3.4.2.12-3.4.2.14.
- Stress Kinase Assay
- Gently aspirate the medium from each of the plates designated "Stress Kinase".
- Perform the same steps as described in sequence: 3.4.2.4 - 3.4.2.8. Note that in this instance, only medium is removed during step 3.4.2.4.
- Prepare a sufficient volume (V) of Primary Antibody Solution according to the following formula: Volume of Blocking buffer (μl) V = 50 x W x 1.2 (W Number of wells)
- Dilute the anti-phospho cJun antibody (rabbit) 1:200 in Primary Antibody Solution.
- Perform the same step as described in 3.4.2.10.
- Prepare a sufficient volume (V) of Secondary Antibody and Nuclear Solution according to the following formula: Volume of Blocking buffer (μl) V = 50 x W x 1.2 (W Number of wells)
- Dilute the anti-rabbit antibody 1:500 in Secondary Antibody and Nuclear Solution.
- Dilute the Nuclear dye 1:1,000 in Secondary Antibody and Nuclear Solution.
- Perform the same steps as described in sequence: 3.4.2.12-3.4.2.14.
- ROS Assay
- Prepare a sufficient volume (V) of Live Cell Staining Solution according to the following formula: Volume of Medium (μl) V = 50 x W x 1.2 (W Number of wells).
- Dilute the ROS dye in Live Cell Staining Solution according to vendor instruction
- Dilute the Nuclear dye 1:1,000 in Live Cell Staining Solution.3.4.5.4) Add 50 μl Live Cell Staining Solution to each well plates designated "ROS"; DO NOT remove cell culture media and incubate for 30 min at room temperature in the dark.
- Gently aspirate the medium and staining solution and wash plate three times with 100 μl/well medium.
- Aspirate the medium, add 100 μl/well fixation solution to each well and incubate plate for 20 min at room temperature in the dark.
- Gently aspirate fixation solution and wash plate three times with 100 μl/well wash buffer.
- Add 100 μl/well wash buffer. Plate(s) is (are) now ready.
- Evaluate the plate on the HCS reader within 1 hr.
- GSH Content Assay
- Prepare a sufficient volume (V) of Live Cell Nuclear Staining Solution according to the following formula: Volume of Medium (μl) V = 50 x W x 1.2 (W Number of wells).
- Dilute the Nuclear dye (Far Red) 1:1,000 in Live Cell Nuclear Staining Solution.3.4.6.3). Add 50 μl of Live Cell Nuclear Staining Solution to each well of the plates designated "GSH content". DO NOT remove cell culture media and incubate for 30 min at 37 °C, 5% CO2.
- Prepare a sufficient volume (V) of Live Cell GSH Staining Solution according to the following formula: Volume of HBSS (μl) V = 50 x W x 1.2 (W Number of wells)
- Dilute the GSH dye in Live Cell GSH Staining Solution according to vendor's instructions.
- Gently aspirate the medium and the nuclear staining solution and wash plate three times with 100 μl/well medium.
- Aspirate medium and add 100 μl/well of Live Cell GSH Staining Solution to each well of the plate(s).
- Incubate for 10 min at room temperature in the dark. Plate(s) is (are) now ready.
- Evaluate plate(s) on the HCS Reader within 1 hr.
- Apoptosis Assay
- Prepare a sufficient volume (V) of Live Cell Staining Solution according to the following formula: Volume of Medium (μl) V = 50 x W x 1.2 (W Number of wells).
- Dilute the Caspase dye 1:300 in Live Cell Staining Solution.
- Remove cell culture media, add 50 μl Live Cell Staining Solution to each well of the plate(s) designated "Apoptosis" and incubate for 30 min at 37 °C, 5% CO2.
- Prepare a sufficient volume (V) of Live Cell Nuclear Staining Solution according to the following formula: Volume of Fix solution (μl) V = 50 x W x 1.2 (W Number of wells).
- Dilute the Nuclear dye 1:1,000 in Live Cell Nuclear Staining Solution.
- Remove the live cell staining solution, add 100 μl/well of Live Cell Nuclear Staining Solution to each well of the plate(s) and incubate for 30 min at room temperature in the dark.
- Aspirate the fixative/nuclear dye solution and wash plate(s) three times with 100 μl/well wash buffer.
- Add 100 μl/well wash buffer. Plate(s) is (are) now ready.
- Evaluate plate(s) on the HCS reader.
- Preparation for all Assays
- Data Analysis HCS
- Export raw data as excel (.xls) file. Note: Raw cell index values are organized in a 96 well format (mirroring plate well distribution) and are provided for every end points at a given time point post-dosing.
- Normalize the values using the following equation:

where i is the measured raw signal value of a well,
Vehicle is the median of the measured signal values for the vehicle wells on a plate,
CR is the desired median normalized value for the vehicle (0%), and
SC is the desired median normalized value for the positive controls (100),
NOTE: At the end of this step, a data set is obtained that contains, for each position i in the 96 well plate, a concentration ci (in logarithmic units) that was applied to the sample contained in position/well i and its corresponding normalized signal N(i). - Plot and fit the (ci, N(i))-values using a 4-parameters Hill equation.
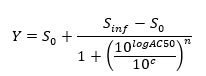
where Zero Activity S0 = Activity level at zero concentration of test compound,
Infinite Activity Sinf = Activity level at infinite concentration,
AC50 = Concentration at which activity reaches 50% of maximum level,
Hill coefficient n = Measure of the slope at AC50, and
c = Concentration in logarithmic units corresponding to the values on the x-axis of the dose-response curve plot.
NOTE: AC50 is a measure of potency where low values indicate high potency.
Results
RTCA
Because the HCS endpoints will not be informative when no toxic effect is detected, those compounds not showing decreased cell viability up to the highest concentration in the RCTA are not tested by HCS (Figure 3b,c,d,g,k,l,m,p). Compounds showing decreased cell viability at only the highest concentration (Figure 3e,o) are also deselected for HCS. Finally, only the constituents with a computable LD50 (< 20 mM) are selected for further HCS analysis (Figure 3a,f,h,j,n). HPHCs meeting the above criteria are: 1-aminonaphtalene, Arsenic (V), Chromium (VI), Crotonaldehyde and Phenol.
HCS
As a Quality Check (QC), positive controls are first analyzed to assure that staining procedure is correctly performed. Representative pictures of positive control-treated cells are shown in Figure 6. Data values are normalized to vehicle as previously described. No dose-response curves are plotted as only three doses are tested and not all the three doses are considered at every time-point. Positive control doses are selected (based on previous experiments, data not shown) so that appropriate responses are observed for each endpoint at both 4 hr and 24 hr. In particular doses 1 and 2 are used to evaluate the effect at 4 hr while doses 2 and 3 are used to evaluate the effect at 24 hr. Plates are discarded if no response is observed for the positive control doses. Note that for all the endpoints, except mitochondrial membrane potential and GSH content, an increase of the signal intensity is expected.
All compounds, except for Phenol, induced a necrotic phenotype, based on increased cell membrane permeability (Figure 7a,f,h,l). 1-aminonaphtalene, Chromium (VI), Crotonaldehyde and Phenol were identified as being genotoxic based on increased phosphorylation of the histone H2AX (Figure 7e,j,n,p). Phenol and 1-aminonaphtalene were found to induce severe mitochondrial dysfunction (Figure 7b,o) which, with 1-aminonaphtalene, led to an increased cytochrome C release (Figure 7c). Detection of increased caspase 3/7 activity provided evidence of apoptotic event upon chromium exposure. Oxidative stress induction (ROS or GSH) was also detected upon treatment with 1-aminonaphtalene, Crotonaldehyde and Phenol (Figure 7d,m,q). Finally, Arsenic induces cell stress as demonstrated by the increased phosphorylation of the transcription factor cJun (Figure 7g).
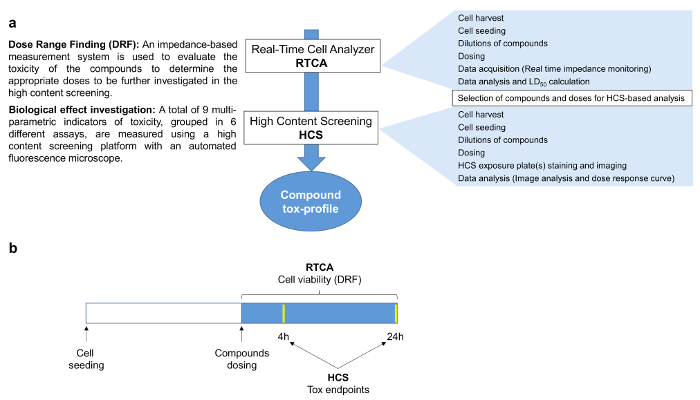
Figure 1. Compound Tox-Profiler Workflow. a) Schematic of the workflow followed in this study. First, a dose-range finding was performed using the RTCA platform to select appropriate doses for subsequent HCS to characterize the compound-specific toxicity profiles. b) Experimental design of the study. 24 hr after seeding, cells were dosed and impedance values continuously monitored over the following 24 hr, whereas HCS endpoints were investigated 4 and 24 hr after dosing. Please click here to view a larger version of this figure.
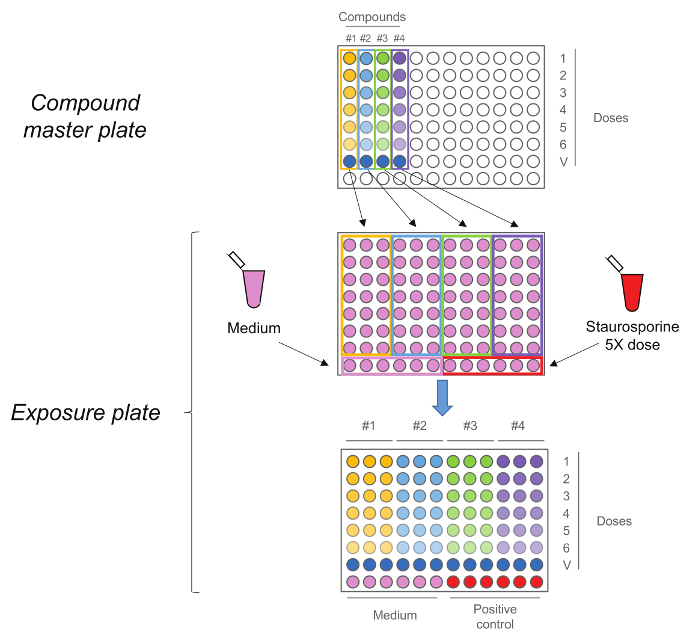
Figure 2. RTCA Exposure Plate. Compound master plate is first generated by performing a five-step 1:10 serial dilution. Each compound, including the vehicle control (dose 0) is then added in triplicate to the exposure plate together with medium and Staurosporine as controls. Note that the doses sequence is maintained upon transfer, highest doses are in row number 1 while vehicle controls are in row number 7. Please click here to view a larger version of this figure.
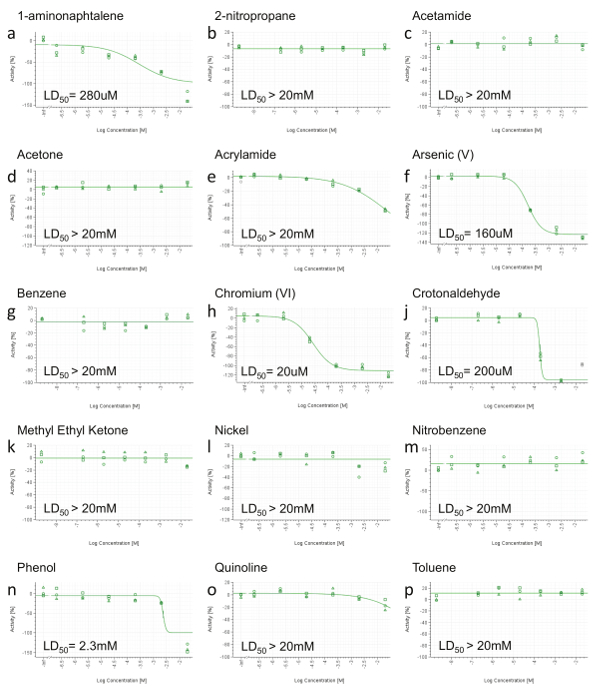
Figure 3. Representative RTCA Cell Viability Results. a) 1-aminonaphtalene, b) 2-nitropropane, c) Acetamide, d) Acetone, e) Acrylamide, f) Arsenic (V), g) Benzene, h) Chromium (VI), j) Crotonaldehyde, k) Methyl Ethyl Ketone, l) Nickel (II), m) Nitrobenzene, n) Phenol, o) Quinoline, p) Toluene. At 24 hr post-dosing, area under the curve (AUC) was calculated for each dose (including positive control and vehicle) and normalized in a range from 0 to -100% activity (y-axis), where 0 reflects the activity of the vehicle and -100 of the positive control. Values were then plotted and fitted using a four-parameter Hill equation and, when possible, LD50 was calculated. Concentrations are expressed on a log scale (x-axis). Please click here to view a larger version of this figure.
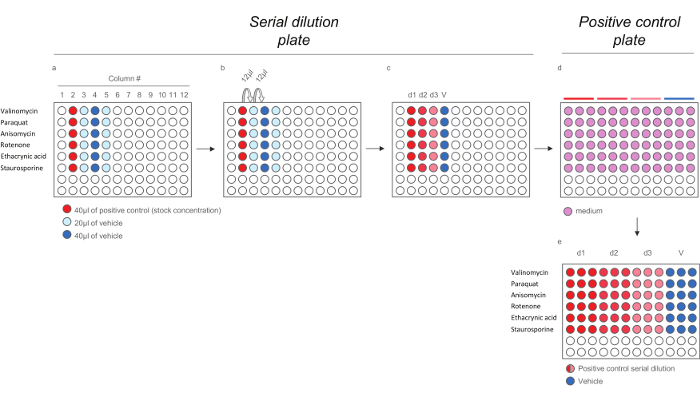
Figure 4. Dilution Scheme for Positive Control Compounds for HCS Assays. a) Addition of Positive controls and vehicle to the serial dilution plate. b) Serial dilution of the positive controls. c) 200X positive controls doses. d-e) Dilution of the 200x positive controls doses in medium (1:40) to generate the positive control plate containing the 5x doses. Note that each doses is diluted in triplicates to reflect the final layout in the exposure plate). Please click here to view a larger version of this figure.
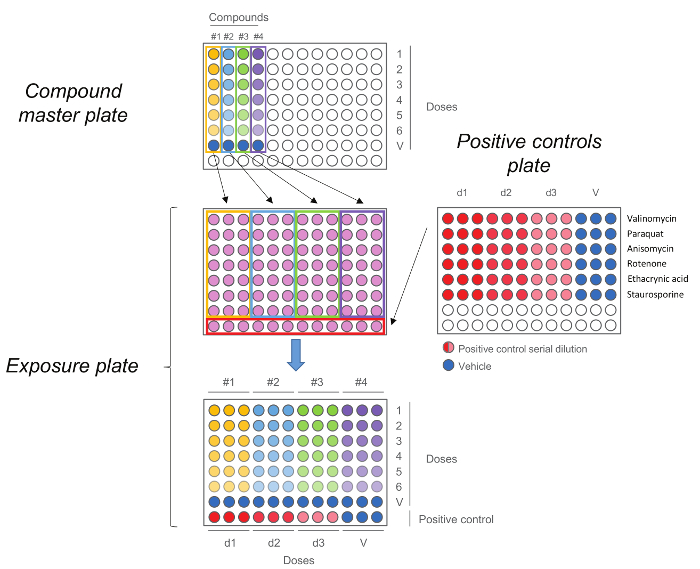
Figure 5. HCS Exposure Plate. Compound master plate is first generated by performing a five-step dilution. Each compound, including the vehicle control (dose 0) is then added in triplicate to the exposure plate together with the positive controls. Note that the doses order is maintained upon transfer, highest doses are in row number 1 while vehicle controls are in row number 7. Please click here to view a larger version of this figure.
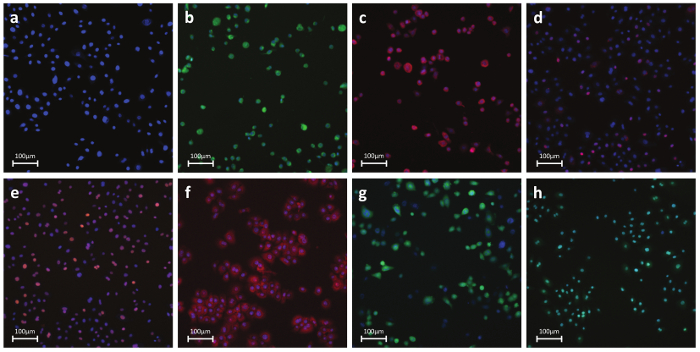
Figure 6. Representative Fluorescent Photos of Antibody- or Dye-Stained Cells. a) Nuclear parameters - Nuclear dye: A permeable dye which binds to DNA in live or fixed cells. This stain is used to identify individual cells labeling the nuclear region. b) Necrosis - Cell membrane permeability dye: Dye-based detection of cell membrane integrity. Reagent is intrinsically impermeable to the cell membrane. During necrosis, the membrane becomes permeable and the dye enters the cell and binds to DNA producing a strong fluorescent signal. c) Apoptosis - Cytochrome C: Antibody-based detection of cytochrome C release, a well-known hallmark of early apoptosis. Upon induction of apoptosis, cytochrome c is released from the mitochondria and diffuses into the nucleus. d) DNA Damage - pH2AX: Antibody-based detection of phosphorylation of histone H2AX, a well-known hallmark of double strand DNA breaks. e) Stress Kinase - cJun: Antibody-based detection of phosphorylation at Ser-73 of cJun, a well-known hallmark of cellular stress. f) Oxidative stress - DHE: Dye-based detection of superoxide radicals. Dihydroethidium itself fluoresces blue in the cytoplasm while the oxidized form ethidium fluoresces red upon DNA intercalation. g) GSH - mBcl: Dye-based detection of free GSH molecules. mBcl reacts with GSH to generate a highly fluorescent product. h) Apoptosis - Caspase 3/7 activation: Dye-based detection of caspase 3/7 activity. Reagent is non-fluorescent with a four amino acid peptide that inhibits DNA binding. Upon caspase-3/7 activation, the peptide is cleaved enabling the dye to bind to DNA and produce a bright, fluorogenic response. Panels b-h show positive control-treated cells. Please click here to view a larger version of this figure.
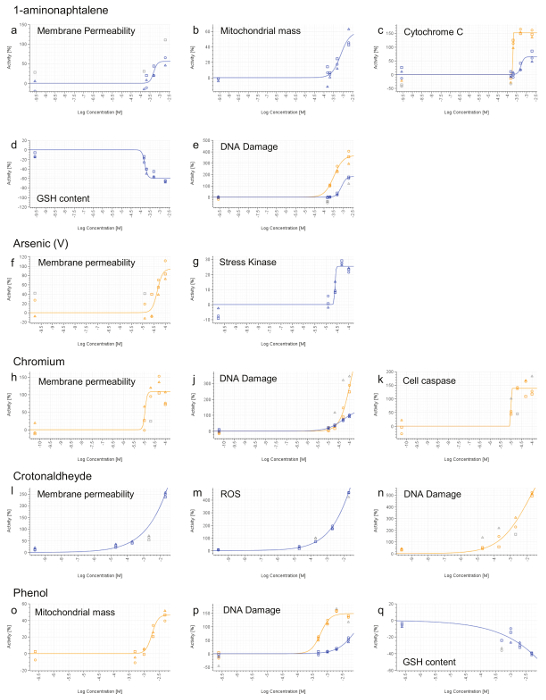
Figure 7. Representative HCS Results. 1-aminonaphtalene (a-e), Arsenic (V) (f and g), Chromium (VI) (h-k), Crotonaldehyde (l-n) and Phenol (o-q). 4 hr (blue line) and 24 hr (orange line) signals were calculated for each doses and normalized to the vehicle activity (0%). Values that are not included in curve fitting computations are shown in grey. Concentrations are expressed on a log scale (x-axis). Please click here to view a larger version of this figure.
| Assay | Endpoint # | Biological endpoint | Cellular compartment | Output feature |
| Cytotoxicity | 1 | Mitochondrial mass 6 | Cytoplasm | Spot average area |
| 2 | Mitochondrial membrane potential 6 | Cytoplasm | Spot average intensity | |
| 3 | Cytochrome C release 7 | Nucleus | Average intensity | |
| 4 | Cell membrane permeability 8 | Nucleus | Average intensity | |
| DNA Damage | 5 | phospho-H2AX 9 | Nucleus | Average intensity |
| Stress Kinase | 6 | phospho-cJun10 | Nucleus | Average intensity |
| ROS | 7 | ROS 11 | Nucleus | Average intensity |
| GSH content | 8 | GSH 12 | Cytoplasm | Spot average intensity |
| Apoptosis | 9 | Caspase 313 | Cytoplasm | Spot average intensity |
Table 1. List of HCS assays and endpoints.
| Vehicle | RTCA doses (µM) | LD50 | HCS doses | |||||||||||
| Cell viability-selected (µM) | 3R4F (nM) | |||||||||||||
| 1-Aminonaphtalene | EtOH | 20,000 | 2,000 | 200 | 20 | 2 | 0.2 | 280 µM | 2,000 | 500 | 200 | 150 | 0.27 | |
| 2-Nitropropane | EtOH | 20,000 | 2,000 | 200 | 20 | 2 | 0.2 | >20 mM | ||||||
| Acetamide | EtOH | 20,000 | 2,000 | 200 | 20 | 2 | 0.2 | >20 mM | ||||||
| Acetone | Water | 20,000 | 2,000 | 200 | 20 | 2 | 0.2 | >20 mM | ||||||
| Acrylamide | Water | 20,000 | 2,000 | 200 | 20 | 2 | 0.2 | >20 mM | ||||||
| Arsenic (V) | Water | 20,000 | 2,000 | 200 | 20 | 2 | 0.2 | 160 µM | 200 | 100 | 50 | 25 | 0.17 | |
| Benzene | EtOH | 20,000 | 2,000 | 200 | 20 | 2 | 0.2 | >20 mM | ||||||
| Chromium (VI) | Water | 20,000 | 2,000 | 200 | 20 | 2 | 0.2 | 20 µM | 100 | 50 | 20 | 10 | 0.06 | |
| Crotonaldehyde | Water | 20,000 | 2,000 | 200 | 20 | 2 | 0.2 | 200 µM | 20,000 | 2,000 | 200 | 20 | 2,000 | |
| Methyl Ethyl Ketone | Water | 20,000 | 2,000 | 200 | 20 | 2 | 0.2 | >20 mM | ||||||
| Nickel | Water | 20,000 | 2,000 | 200 | 20 | 2 | 0.2 | >20 mM | ||||||
| Nitrobenzene | EtOH | 20,000 | 2,000 | 200 | 20 | 2 | 0.2 | >20 mM | ||||||
| Phenol | EtOH | 20,000 | 2,000 | 200 | 20 | 2 | 0.2 | 2,300 µM | 5,000 | 2,000 | 1,000 | 500 | 240 | |
| Quinoline | EtOH | 20,000 | 2,000 | 200 | 20 | 2 | 0.2 | >20 mM | ||||||
| Toluene | Water | 20,000 | 2,000 | 200 | 20 | 2 | 0.2 | >20 mM | ||||||
Table 2. List of Tested HPHC Compounds with Relative LD50 at 24 hr of Treatment. Compounds selected for HCS analysis are highlighted in orange and doses tested are also given. The 3R4F dose is equivalent to the amount of constituent present in the smoke of one stick from the reference cigarette 3R4F.
| Assay | Compound | Stock Solution | Solvent | Dose(s) (µM) | ||
| Cell viability | Staurosporine | 10 mM | DMSO | 50 | ||
| Cytotoxicity | Valinomycin | 10 mM | DMSO | 50 | 20 | 5 |
| DNA Damage | Paraquat | 100 mM | DMSO | 500 | 200 | 50 |
| Stress Kinase | Anisomycin | 2 mM | DMSO | 10 | 4 | 1 |
| ROS | Rotenone | 200 mM | DMSO | 1,000 | 400 | 100 |
| GSH content | Ethacrynic acid | 200 mM | DMSO | 1,000 | 400 | 100 |
| Apoptosis | Staurosporine | 40 mM | DMSO | 200 | 50 | 20 |
Table 3. List of Positive Controls and Concentrations Used for Each Assay.
Discussion
The needs for alternatives to animal experimentation and for new high throughput testing approaches have been widely discussed over the past years. This has led scientists and regulatory authorities to investigate alternative methods for standard toxicity testing, utilizing cellular assays that closely mimic the physiology of target tissues. In this study, we have demonstrated the applicability of combining a real-time cell analyzer (RTCA) with a high content screening (HCS) platform to assess the impact of exposure to single CS constituents on human lung epithelial cells. This setup could be analogously applied to evaluate cytotoxicity induced by various other airborne pollutants, airborne particles, and nanoparticles. Furthermore, the obtained results can be matched with those from whole-genome transcriptomics and computational methods based on causal biological networks. As previously reported, this approach allowed us to corroborate data on molecular pathway perturbation upon CS exposure5 with HCS endpoints, addressing these pathway perturbations also phenotypically.
As a flowchart assay, real-time cell analysis provides cell viability-related information in a dose- and time-dependent resolution, which allows better decision making which dose and exposure time point may be favorable for downstream analysis14. The principle of the analyzer relies on changes in electrical impedance generated by the cells as they attach and spread on a culture well surface covered with a gold microelectrode. The impedance is converted into a dimensionless parameter named cell-index, which can be used to monitor cell adhesion, spreading, morphology and ultimately cell viability. Though this technique does not provide information on cytotoxic mechanisms, its sensitivity enables detection of morphological cellular changes even at very low doses at which the HCS is not informative (data not shown). Based on previous experiments, we have noted that RTCA methodology is able to detect morphological changes at lower doses compared to the HCS endpoints.
Following initial screening with the real-time cell analyzer, a HCS platform was used to gain more in-depth information on the kind of cytotoxicity elicited by each HPHC. The HCS assay panel allowed to profile HPHCs towards their potential impact on cellular compartments/organelles as well as to identify those eliciting genotoxicity or oxidative stress. The analysis revealed distinct profiles whereby the selected HPHCs induce cytotoxicity in NHBE cells. In general, all the compounds, except Phenol, were found to induce necrosis at the highest tested doses. Consistent with a potential role in cancer development 1-aminonaphtalene induced phosphorylation of H2AX as a marker for genotoxicity, however the HCS panel also uncovered activity of this HPHC in the mitochondrial toxicity readout (mass increased and cytochrome C release) and oxidative stress (GSH depletion). Similarly, as previously described, Phenol was identified to induce mitochondrial dysfunction, and cause DNA damage as well as GSH depletion. Chromium (VI), one of the compounds classified as group I carcinogens, and Crotonaldehyde were also both identified as genotoxic, in particular Chromium (VI) also induced apoptosis (caspase cascade activation) and Crotonaldehyde caused increased ROS generation. Finally Arsenic (V), was found to induce cJun phosphorylation which is a marker of stress kinase pathway activation.
In this study, we utilized NHBE cells as a model for lung epithelial cells in vitro. Using these cells in a HCS setting is unprecedented and enabled the investigation of a broader range of endpoints, including genotoxicity and oxidative stress markers. Both live cell and fixed cell staining approaches were described within our protocols, demonstrating the flexibility of the overall technique. In fact, the very same protocols can be applied to a broader range of targets, which can be addressed by the use of any fluorescent dye or antibody. For the successful execution of the live staining protocols, it is important to respect the incubation time, as some of the dyes have a limited half-life and the fluorescence signal may decrease before the image acquisition is completed. It is also important to consider that if a different cell type is used, all the staining conditions should be re-evaluated, as the optimal dye concentration and the incubation time may be different.
In the current paper we have described a scenario where only five compounds where screened with the HCS methodology. Considering the previously described plate layout, they were dosed over 2 different plate sets for a total of 24 plates (6 assays and 2 time-points).The number of plates could also be increased, thereby allowing for the simultaneous screening of more compounds or the investigation of more endpoints. Before doing so, however, one should take into consideration that certain endpoints (GSH and ROS) require immediate acquisition, and as a consequence, the dosing of the plates should be performed in a staggered fashion to permit the acquisition of the previous plate. On the other hand, using a fixed cell staining protocol represents an advantage as the plates can be stacked, interrupting the protocol at any step after the fixation, for completion of the staining procedure at a later stage. This approach, for example, would provide the operator with the time to complete all live cell staining plates without compromising the data quality.
To further optimize the workflow by decreasing the number of plates, it would also be possible to multiplex more endpoints together. For example in this context DNA Damage and Stress Kinase could be investigated together simply using two secondary antibody with fluorochromes emitting in different channels. Continuous development of the HCS platform, including fully automated cell seeding, compound dilution, dosing and staining, as well as the addition of new endpoints will further expand the capability of the HCS platform as a powerful profiling tool for HPHCs on epithelial and other cell types.
Disclosures
All authors are employees of Philip Morris International. Philip Morris International is the sole source of funding and sponsor of this project.
Acknowledgements
The authors would like to thank Karsta Luettich and Grégory Vuillaume for their review of the manuscript.
Materials
| Name | Company | Catalog Number | Comments |
|---|---|---|---|
| Cellomics ArrayScan VTI HCS Reader | Thermo | N01-0002B | |
| xCelligence RTCA MP | ACEA | 05331625001 | |
| Screener (HCS) | Genedata | NA | |
| CASY counter TTC | Roche | 05 651 719 001 | |
| e-Plates VIEW 96 | ACEA | 06 472 451 001 | |
| RTCA Frame 96 | ACEA | 05232392001 | |
| RTCA Cardio Temperature Tool | ACEA | 2801171 | |
| Plate sealer breathseal | Greiner bio-one | 676051 | |
| Normal Human Bronchial Epithelial cells (NHBE) | Lonza | CC-2540 | non-smoking 60-year-old Caucasian male donor |
| BEGM BulletKit | Lonza | CC-3170 | Warm at 37 °C before use |
| ReagentPack Subculture Reagents kit | Lonza | CC-5034 | Warm at 37 °C before use |
| Penicillin/Streptomycin (100x) | Corning | 30-002-CI | |
| Easy Flask filter cap 75 cm2 | Thermo Scientific | 12-565-349 | |
| 96 well assay plate black | Corning | 3603 | |
| Hoechst 33342 | Fisher Scientific | PI-62249 | |
| Draq5 (For Far Red Nuclear Staining) | Biostatus | DR50200 | |
| Mitochondrial Dye: MitoTracker Red CMXRos | Life technologies | M-7512 | |
| Mitochondrial Dye: MitoTracker Red CM-H2XRos | Life technologies | M-7513 | |
| ROS Dye: Dihydroethidium | Sigma | D7008 | |
| ROS Dye: CellROX | Life technologies | C10422 | |
| ROS Dye: MitoSOX | Life technologies | M36008 | |
| GSH Dye: Monochlorobimane | Sigma | 69899 | Toxic |
| GSH Dye: Monobromobimane | Life technologies | M-1378 | Toxic |
| Membrane permeability Dye: YO-PRO-1 | Life technologies | Y3603 | Irritating |
| Membrane permeability Dye: TO-PRO-1 | Life technologies | T3602 | Irritating |
| Membrane permeability Dye: TOTO-1 | Life technologies | T3600 | Irritating |
| Caspase Dye: Cellevent Caspase 3/7 green | Life technologies | C10423 | Irritating |
| Anti-Cytochrome C antibody (Mouse) | Thermo | MA5-11823 | |
| Anti-phospho-c-Jun antibody (Mouse) | Thermo | MA5-15889 | |
| Anti-phospho-H2AX antibody (Mouse) | Thermo | MA1-2022 | |
| Goat anti-Mouse IgG DyLight 650 | Abcam | ab96878 | |
| 10x permeabilization buffer | Fisher | 8408400 | |
| 4% Formaldehyde solution | Sigma | F1635 | Toxic |
| 10x blocking buffer | Fisher | 8408500 | |
| Dulbecco’s Phosphate Buffered Saline | Sigma | D8537 | |
| Hanks' Balanced Salt solution | Sigma | H8264 | |
| Staurosporine | Sigma | S4400 | Toxic |
| Valinomycin | Sigma | V0627 | Toxic |
| Paraquat | Sigma | 36541 | Toxic |
| Anisomycin | Sigma | A9789 | Toxic |
| Ethacrynic acid | Sigma | E4754 | Toxic |
| 1-Aminonaphthalene | Sigma | 34390 | Toxic |
| 2-Nitropropane | Sigma | 130265 | Toxic |
| Acetamide | Sigma | 695122 | Toxic |
| Acetone | Sigma | 650501 | Toxic |
| Acrylamide | Sigma | A9099 | Toxic |
| Arsenic (V) | Sigma | A6756 | Toxic |
| Benzene | Sigma | 12540 | Toxic |
| Chromium (VI) | Sigma | 216623 | Toxic |
| Crotonaldehyde | Sigma | 262668 | Toxic |
| Methyl ethyl ketone | Sigma | 34861 | Toxic |
| Nickel | Sigma | 203866 | Toxic |
| Nitrobenzene | Sigma | 48547 | Toxic |
| Phenol | Sigma | P5566 | Toxic |
| Quinoline | Sigma | 241571 | Toxic |
| Toluene | Sigma | 34866 | Toxic |
References
- Rodgman, A., Perfetti, T. A. The chemical components of tobacco and tobacco smoke. , CRC Press. Boca Raton, FL. (2013).
- Russell, W. M. S., Burch, R. L. The Principles of Humane Experimental Technique. , Methuen, London. (1959).
- Zock, J. M. Applications of high content screening in life science research combinatorial chemistry & high throughput screening. Comb. Chem. High. Throughput. Screen. 132 (9), 870-876 (2009).
- US Food and Drug Administration. Harmful and potentially harmful constituents in tobacco products and tobacco smoke; established list, federal register. , 20034-20037 (2012).
- Gonzalez-Suarez, I. Systems Biology Approach for Evaluating the Biological Impact of Environmental Toxicants in Vitro. Chem. Res. Toxicol. 27 (3), 367-376 (2014).
- Camilleri-Broet, S., Vanderwerff, H., Caldwell, E., Hockenbery, D. Distinct alterations in mitochondrial mass and function characterize different models of apoptosis. Exp. Cell. Res. 239 (2), 277-292 (1998).
- Li, P., et al. Cytochrome c and dATP-dependent formation of Apaf-1/caspase-9 complex initiates and apoptotic protease cascade. Cell. 91 (4), 479-489 (1997).
- Rogakou, E. P., Pilch, D. R., Orr, A. H., Ivanova, V. S., Bonner, W. M. Double strand breaks induce histone H2AX phosphorylation on serine 139. J. Biol. Chem. 273 (10), 5858-5868 (1998).
- Westwick, J. K., Weitzel, C., Minden, A., Karin, M., Brenner, D. A. Tumor necrosis factor α stimulates AP-1 activity through prolonged activation of the c-jun kinase. J. Biol. Chem. 269 (42), 26396-26401 (1994).
- Bindokas, V. P., Jordán, J., Lee, C. C., Miller, R. J. Superoxide production in rat hippocampal neurons: selective imaging with hydroethidine. J. Neurosci. 16 (4), 1324-1336 (1996).
- Barhoumi, R., Bailey, R. H., Burghardt, R. C. Kinetic analysis of glutathione in anchored cells with monochlorobimane. J. Cytometry. 19 (3), 226-234 (1994).
- Huang, T. C., Lee, J. F., Chen, J. Y. Pardaxin an antimicrobial peptide, triggers caspase-dependent and ROS-mediated apoptosis in HT-1080 Cells. Mar. Drugs. 9 (10), 1995-2009 (2011).
- Bao, S., Knoell, D. L. Zinc modulates cytokine-induced lung epithelial cell barrier permeability. Am. J. Physiol. Lung Cell Mol. Physiol. 291 (6), L1132-L1141 (2006).
- Xia, M., et al. Compound Cytotoxicity Profiling Using Quantitative High-Throughput Screening. Environ Health Perspect. 116 (3), 284-291 (2008).
Reprints and Permissions
